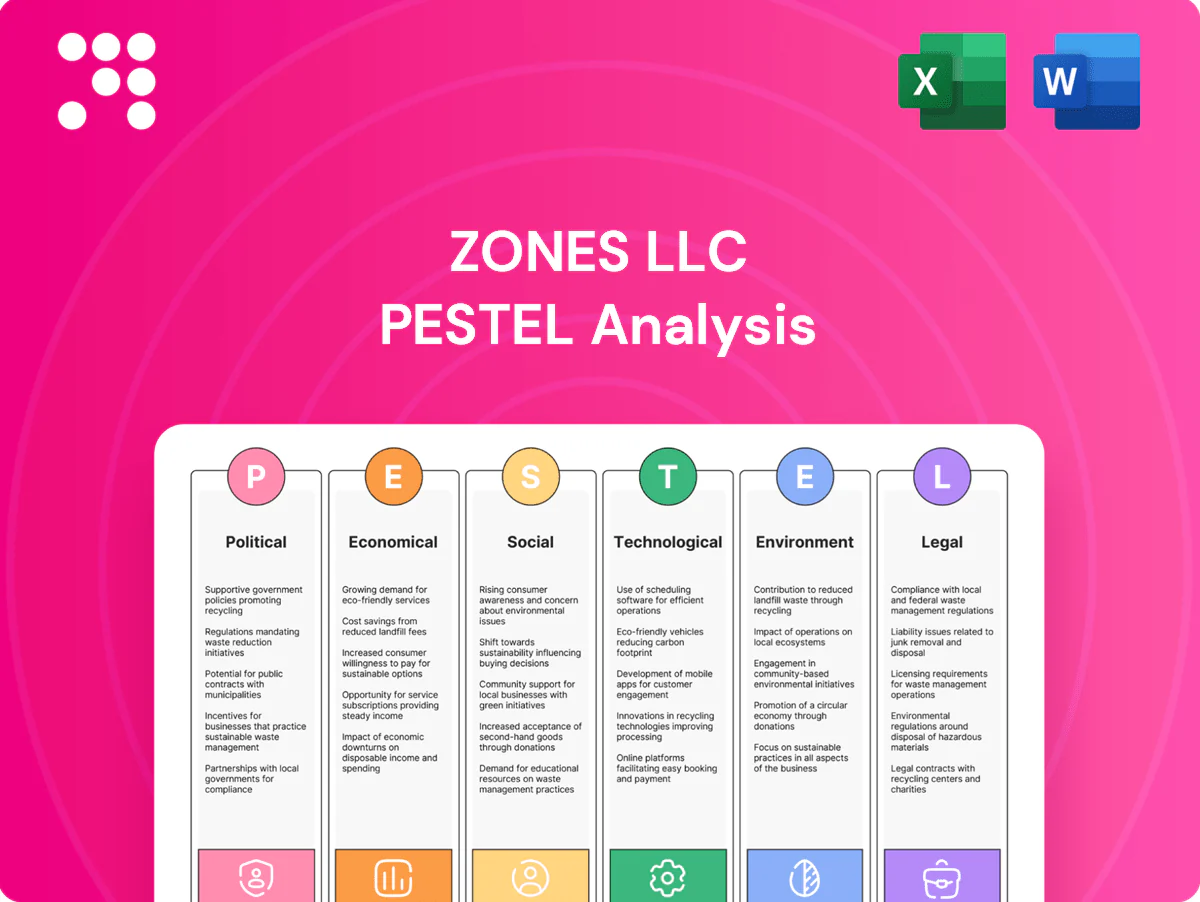
Zones LLC PESTLE Analysis

Your Shortcut to Market Insight Starts Here
Gain a competitive edge with our focused PESTLE Analysis of Zones LLC—three to five-minute read, deep external insight. See how political, economic, social, technological, legal, and environmental forces shape strategy and risk. Ideal for investors and planners seeking ready-to-use intelligence. Purchase the full report for the complete, editable breakdown and actionable recommendations.
Political factors

Government IT spending priorities
Stimulus programs such as the IIJA (total $550 billion, including $65 billion for broadband) and the CHIPS and Science Act ($52 billion) keep public IT refresh and digital transformation demand strong. Shifts to cybersecurity, zero-trust and cloud-first policies accelerate pipelines, while austerity or election-driven reprioritization can delay awards. Zones must track multi-year appropriations and align bids to funded missions.
Geopolitical tensions and trade policy
Tariffs, export controls (expanded 2022–24) and sanctions have tightened access to semiconductors, networking gear and advanced software, while global chip sales approached $600B in 2024. Vendor restrictions force frequent supplier list changes. 2023–24 shipping disruptions raised freight costs and lead times. Zones must diversify suppliers, qualify alternates and enforce compliance-led sourcing.

Public procurement rules
Complex RFPs, set-asides and local content rules materially affect Zones LLC win rates and margins, forcing higher bid costs and reduced average margin per contract. OECD estimates public procurement at about 12% of GDP, so framework agreements and preferred vendor lists gate large opportunities. Long approval cycles—often 60–120 days—strain cash flow and forecasting, making investment in compliance, certifications and bid management critical.

Data sovereignty and localization policies
Many countries now mandate data residency for government and regulated workloads; as of 2024 over 80 countries have data localization measures, forcing cloud architecture, partner selection, and support models to prioritize in-country infrastructure. Non-compliance can lead to disqualification from public tenders and multimillion-dollar revenue loss, so Zones must deliver localized cloud options and sovereign-compliant solutions.
- data: 80+ countries (2024)
- risk: tender disqualification, revenue loss
- requirement: localized cloud offerings
- impact: partner selection & support models
Political stability in key markets
Political instability in Zones LLC key markets can disrupt operations, logistics, and customer projects, increasing project delays and supply-chain interruptions. Currency volatility during crises raises cross-border pricing risk and hedging costs, while policy discontinuity puts long-term managed services contracts at risk of renegotiation. Zones mitigates exposure through geographic diversification and contingency planning, maintaining regional teams and multi-sourcing to preserve service continuity.
- operational disruption
- currency volatility risk
- policy continuity impact
- diversification & contingency
Public IT demand up; chips ~$600B, data residency 80+
Stimulus programs (IIJA $550B incl. $65B broadband; CHIPS $52B) sustain public IT demand but election-driven reprioritization can delay awards. Tariffs, export controls and 2023–24 shipping shocks tightened supply; global chip sales ~$600B (2024) and 80+ countries mandate data residency, raising sourcing and architecture costs. Public procurement ~12% GDP and 60–120 day approval cycles force diversification, localization and compliance investment.
| Tag | Value |
|---|---|
| IIJA | $550B |
| CHIPS | $52B |
| Global chips (2024) | ~$600B |
| Data residency | 80+ countries |
| Public procurement | ~12% GDP |
What is included in the product
 Detailed Word Document
Provides a concise PESTLE assessment of Zones LLC, examining Political, Economic, Social, Technological, Environmental and Legal drivers with data-backed trends and region/industry relevance; designed for executives, consultants and investors to identify risks, opportunities and inform strategic, scenario-based planning.

 Customizable Excel Spreadsheet
A concise, visually segmented PESTLE summary for Zones LLC that distills external risks and opportunities into an editable, presentation‑ready format—easily shareable across teams and customizable for region or business line.
Economic factors

IT spending cycle and macro growth
GDP momentum and corporate confidence drive endpoint, data‑center and cloud refresh cycles—global IT spending was roughly $5 trillion in 2024 (Gartner) while US policy rates stood at 5.25–5.50% in mid‑2025, tightening credit and deferring capex but boosting demand for opex managed services. Counter‑cyclical purchases of efficiency tools can offset slowdowns; Zones can pivot to ROI‑focused and pay‑as‑you‑go offers.
Inflation and cost pressures
Component prices rose about 7% year‑on‑year while container freight costs increased roughly 15% y/y, squeezing Zones LLC margins if not passed through. Technical talent wages accelerated near 6% in 2024, elevating delivery costs for services. Customers are intensifying cost optimization — ~70% of buyers cited price pressure in 2024 surveys — so competitive pricing tightens. Dynamic pricing and value engineering are essential to protect margins.

Supply chain constraints
Lead times for servers (typically 16–20 weeks), networking gear (12–18 weeks) and semiconductor components (10–14 weeks) materially delay Zones LLC project delivery and revenue recognition. OEM allocations continue to favor larger strategic customers, concentrating supply with top partners. Maintaining buffer inventory and multi-vendor designs reduces single-supplier risk, while publishing transparent timelines preserves customer trust.

Currency fluctuations
Multi-currency transactions expose Zones LLC revenues and COGS to FX swings; the US dollar remained strong (DXY ~104 mid-2025) and held about 59% of global reserves at end-2024, pressuring international demand and margins. Active hedging programs and local-currency invoicing can cut volatility, and Zones should align contract terms with explicit FX risk limits and netting policies.
Sectoral mix and resilience
Sectoral demand for Zones LLC varies across commercial, government, education, and healthcare; public and healthcare spending tends to be steadier in downturns, with public sources covering roughly 70% of health spending on average in OECD countries (OECD). Exposure to high-growth verticals such as cloud-native and cybersecurity—markets each exceeding $200B globally in recent years—boosts resilience. Portfolio balance across these sectors improves revenue stability.
- Demand mix: commercial, government, education, healthcare
- Public/health steadiness: public share ~70% (OECD)
- High-growth verticals: cloud-native & cybersecurity >$200B markets
- Portfolio balance: stabilizes revenue and reduces cyclicality
Public IT demand up; chips ~$600B, data residency 80+
GDP and corporate confidence underpin IT refreshes—global IT spend ~$5T (Gartner 2024) while US policy rates 5.25–5.50% (mid‑2025) tighten capex. Component prices +7% y/y and freight +15% y/y squeeze margins; tech wages +6% (2024). Lead times: servers 16–20w; DXY ~104 (mid‑2025) pressures FX-exposed revenue; pivot to opex, hedging, value pricing.
| Metric | Value |
|---|---|
| Global IT spend | $5T (2024) |
| US policy rate | 5.25–5.50% (mid‑2025) |
| Component prices | +7% y/y (2024) |
| Freight | +15% y/y |
| DXY | ~104 (mid‑2025) |
Preview Before You Purchase
Zones LLC PESTLE Analysis
The preview shown here is the exact document you’ll receive after purchase—fully formatted and ready to use. This Zones LLC PESTLE Analysis is the final file, with complete content, layout and professional structure. You’ll be able to download this exact document immediately after payment.

Original: $10.00
-65%$10.00
$3.50Product Information
Product Information
Shipping & Returns
Shipping & Returns
Description
Your Shortcut to Market Insight Starts Here
Gain a competitive edge with our focused PESTLE Analysis of Zones LLC—three to five-minute read, deep external insight. See how political, economic, social, technological, legal, and environmental forces shape strategy and risk. Ideal for investors and planners seeking ready-to-use intelligence. Purchase the full report for the complete, editable breakdown and actionable recommendations.
Political factors
Government IT spending priorities
Stimulus programs such as the IIJA (total $550 billion, including $65 billion for broadband) and the CHIPS and Science Act ($52 billion) keep public IT refresh and digital transformation demand strong. Shifts to cybersecurity, zero-trust and cloud-first policies accelerate pipelines, while austerity or election-driven reprioritization can delay awards. Zones must track multi-year appropriations and align bids to funded missions.
Geopolitical tensions and trade policy
Tariffs, export controls (expanded 2022–24) and sanctions have tightened access to semiconductors, networking gear and advanced software, while global chip sales approached $600B in 2024. Vendor restrictions force frequent supplier list changes. 2023–24 shipping disruptions raised freight costs and lead times. Zones must diversify suppliers, qualify alternates and enforce compliance-led sourcing.
Public procurement rules
Complex RFPs, set-asides and local content rules materially affect Zones LLC win rates and margins, forcing higher bid costs and reduced average margin per contract. OECD estimates public procurement at about 12% of GDP, so framework agreements and preferred vendor lists gate large opportunities. Long approval cycles—often 60–120 days—strain cash flow and forecasting, making investment in compliance, certifications and bid management critical.
Data sovereignty and localization policies
Many countries now mandate data residency for government and regulated workloads; as of 2024 over 80 countries have data localization measures, forcing cloud architecture, partner selection, and support models to prioritize in-country infrastructure. Non-compliance can lead to disqualification from public tenders and multimillion-dollar revenue loss, so Zones must deliver localized cloud options and sovereign-compliant solutions.
- data: 80+ countries (2024)
- risk: tender disqualification, revenue loss
- requirement: localized cloud offerings
- impact: partner selection & support models
Political stability in key markets
Political instability in Zones LLC key markets can disrupt operations, logistics, and customer projects, increasing project delays and supply-chain interruptions. Currency volatility during crises raises cross-border pricing risk and hedging costs, while policy discontinuity puts long-term managed services contracts at risk of renegotiation. Zones mitigates exposure through geographic diversification and contingency planning, maintaining regional teams and multi-sourcing to preserve service continuity.
- operational disruption
- currency volatility risk
- policy continuity impact
- diversification & contingency
Public IT demand up; chips ~$600B, data residency 80+
Stimulus programs (IIJA $550B incl. $65B broadband; CHIPS $52B) sustain public IT demand but election-driven reprioritization can delay awards. Tariffs, export controls and 2023–24 shipping shocks tightened supply; global chip sales ~$600B (2024) and 80+ countries mandate data residency, raising sourcing and architecture costs. Public procurement ~12% GDP and 60–120 day approval cycles force diversification, localization and compliance investment.
| Tag | Value |
|---|---|
| IIJA | $550B |
| CHIPS | $52B |
| Global chips (2024) | ~$600B |
| Data residency | 80+ countries |
| Public procurement | ~12% GDP |
What is included in the product
Detailed Word Document
Provides a concise PESTLE assessment of Zones LLC, examining Political, Economic, Social, Technological, Environmental and Legal drivers with data-backed trends and region/industry relevance; designed for executives, consultants and investors to identify risks, opportunities and inform strategic, scenario-based planning.
Customizable Excel Spreadsheet
A concise, visually segmented PESTLE summary for Zones LLC that distills external risks and opportunities into an editable, presentation‑ready format—easily shareable across teams and customizable for region or business line.
Economic factors
IT spending cycle and macro growth
GDP momentum and corporate confidence drive endpoint, data‑center and cloud refresh cycles—global IT spending was roughly $5 trillion in 2024 (Gartner) while US policy rates stood at 5.25–5.50% in mid‑2025, tightening credit and deferring capex but boosting demand for opex managed services. Counter‑cyclical purchases of efficiency tools can offset slowdowns; Zones can pivot to ROI‑focused and pay‑as‑you‑go offers.
Inflation and cost pressures
Component prices rose about 7% year‑on‑year while container freight costs increased roughly 15% y/y, squeezing Zones LLC margins if not passed through. Technical talent wages accelerated near 6% in 2024, elevating delivery costs for services. Customers are intensifying cost optimization — ~70% of buyers cited price pressure in 2024 surveys — so competitive pricing tightens. Dynamic pricing and value engineering are essential to protect margins.
Supply chain constraints
Lead times for servers (typically 16–20 weeks), networking gear (12–18 weeks) and semiconductor components (10–14 weeks) materially delay Zones LLC project delivery and revenue recognition. OEM allocations continue to favor larger strategic customers, concentrating supply with top partners. Maintaining buffer inventory and multi-vendor designs reduces single-supplier risk, while publishing transparent timelines preserves customer trust.
Currency fluctuations
Multi-currency transactions expose Zones LLC revenues and COGS to FX swings; the US dollar remained strong (DXY ~104 mid-2025) and held about 59% of global reserves at end-2024, pressuring international demand and margins. Active hedging programs and local-currency invoicing can cut volatility, and Zones should align contract terms with explicit FX risk limits and netting policies.
Sectoral mix and resilience
Sectoral demand for Zones LLC varies across commercial, government, education, and healthcare; public and healthcare spending tends to be steadier in downturns, with public sources covering roughly 70% of health spending on average in OECD countries (OECD). Exposure to high-growth verticals such as cloud-native and cybersecurity—markets each exceeding $200B globally in recent years—boosts resilience. Portfolio balance across these sectors improves revenue stability.
- Demand mix: commercial, government, education, healthcare
- Public/health steadiness: public share ~70% (OECD)
- High-growth verticals: cloud-native & cybersecurity >$200B markets
- Portfolio balance: stabilizes revenue and reduces cyclicality
Public IT demand up; chips ~$600B, data residency 80+
GDP and corporate confidence underpin IT refreshes—global IT spend ~$5T (Gartner 2024) while US policy rates 5.25–5.50% (mid‑2025) tighten capex. Component prices +7% y/y and freight +15% y/y squeeze margins; tech wages +6% (2024). Lead times: servers 16–20w; DXY ~104 (mid‑2025) pressures FX-exposed revenue; pivot to opex, hedging, value pricing.
| Metric | Value |
|---|---|
| Global IT spend | $5T (2024) |
| US policy rate | 5.25–5.50% (mid‑2025) |
| Component prices | +7% y/y (2024) |
| Freight | +15% y/y |
| DXY | ~104 (mid‑2025) |
Preview Before You Purchase
Zones LLC PESTLE Analysis
The preview shown here is the exact document you’ll receive after purchase—fully formatted and ready to use. This Zones LLC PESTLE Analysis is the final file, with complete content, layout and professional structure. You’ll be able to download this exact document immediately after payment.











