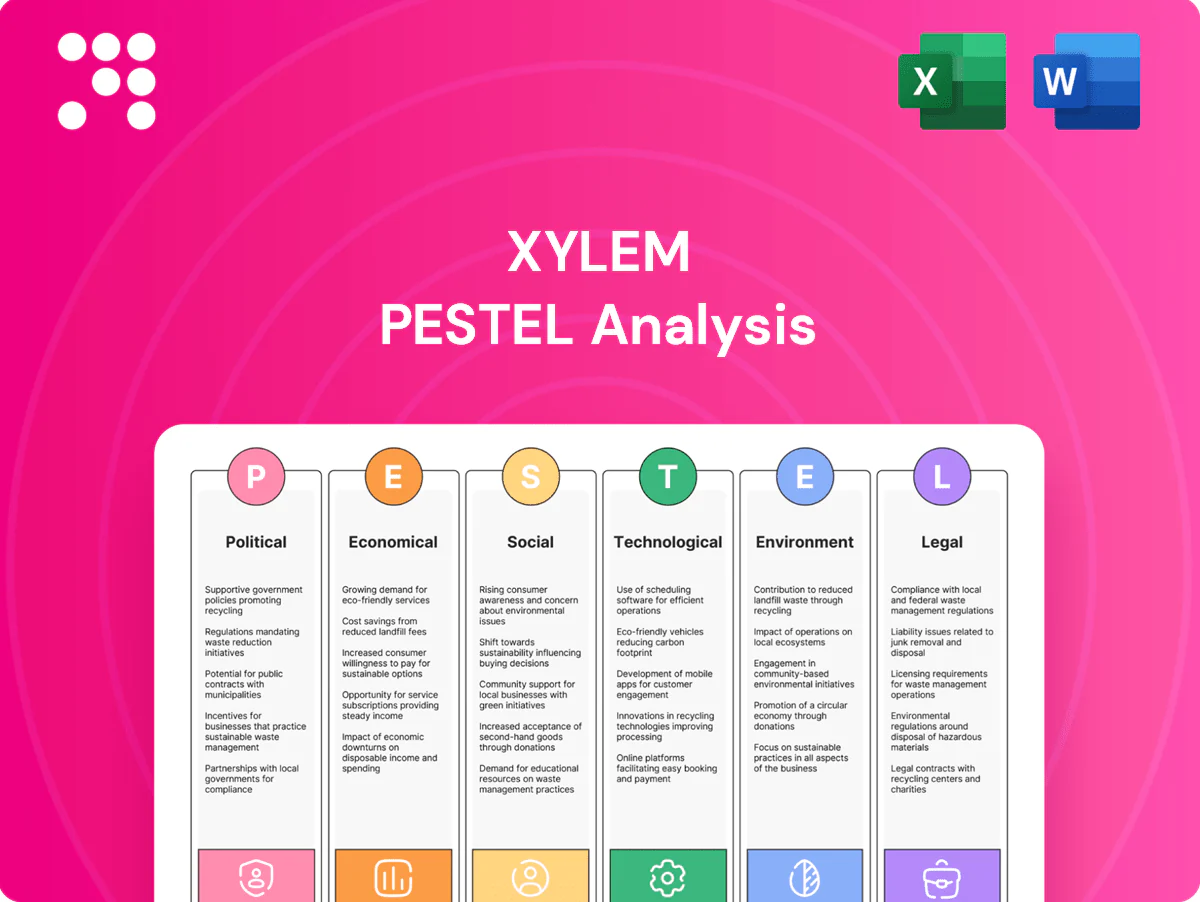
Xylem PESTLE Analysis

Plan Smarter. Present Sharper. Compete Stronger.
Explore how political shifts, economic cycles, technological innovation and environmental regulation are reshaping Xylem's outlook in this concise PESTLE snapshot. Our expert analysis turns external trends into strategic actions. Purchase the full PESTLE for the complete, ready-to-use intelligence.
Political factors

Infrastructure spending and public budgets
Xylem’s municipal demand is closely tied to government-funded water programs; for example the 2021 US Infrastructure Investment and Jobs Act committed roughly $55 billion for water infrastructure, accelerating pipe, pump and treatment upgrades, while fiscal austerity, political gridlock or election cycles can delay tenders and lengthen sales cycles.
Water policy, tariffs, and public-private models
Shifts toward privatization and PPPs — World Bank PPI database records over 800 private water projects since 1990 — open procurement to performance-based solutions that favor Xylem’s tech-led offerings. Tariff reforms and cost-recovery mandates matter because OECD estimates a $200–300 billion annual investment need for water infrastructure, affecting utilities’ capex capacity. National water security plans focus on leakage reduction and reuse (global non-revenue water ~30%), aligning with Xylem’s leakage and reuse portfolio, while populist tariff freezes can suppress utility investment and delay project rollouts.

Geopolitical risk and supply chain exposure
Trade tensions, sanctions and export controls can interrupt component flows and regional sales for Xylem, a company operating in over 150 countries, raising costs and lead times. Localization policies push in-country manufacturing and service footprints, reflected in Xylem’s network of roughly 90 manufacturing and regional hubs. Political instability in emerging markets threatens project execution and receivables, and diversified sourcing plus regional hubs mitigate such shocks.

Development finance and multilateral funding
World Bank, regional development banks and climate funds underwrite large water projects, mobilizing billions annually; Green Climate Fund approved over 13 billion USD by 2024. Eligibility increasingly favors efficient, resilient, low-emission solutions, lengthening technical requirements. Project pipelines can be lengthy but provide multi-year visibility once approved. Vendor compliance and reporting requirements raise administrative and cost burdens.
- Underwriting scale: MDBs & climate funds mobilize billions
- Eligibility: efficiency, resilience, low emissions prioritized
- Pipeline: long timelines, multi-year visibility
- Vendor burden: higher compliance and reporting costs
Urbanization and national resilience agendas
Governments increasingly prioritize drought, flood and stormwater resilience as urban populations rise from 56% in 2020 toward 68% by 2050 (UN DESA), driving investments in rapid-response water infrastructure. Mandates to cut non-revenue water (global average ~30%, IWA) and deploy smart metering boost demand for digital networks. Recovery funds such as the US $55 billion water allocation in the Infrastructure Investment and Jobs Act and the EU Recovery and Resilience Facility (723.8 billion EUR) can fast-track pump and treatment deployments, while civil defense planning favors reliable, rapidly deployable equipment.
- Resilience funding: US $55B; EU RRF 723.8bn EUR
- Urbanization: 56% (2020) → 68% (2050)
- NRW: ~30% global average
- Drivers: smart metering mandates, disaster recovery fast-tracking
Govt water spending, MDB climate funds and PPPs drive smart-meter demand; policy risks slow sales
Xylem’s municipal demand tied to government water spending (US $55B in 2021 IIJA, EU RRF 723.8bn EUR) and MDB/climate funding (Green Climate Fund >$13B approved by 2024). Privatization/PPPs (World Bank PPI >800 water projects since 1990) and smart-meter mandates boost tech uptake, while tariff freezes, trade barriers and political instability lengthen sales cycles and raise compliance costs.
| Metric | Value |
|---|---|
| US water IIJA | $55B |
| EU RRF | €723.8B |
| GCF approved (2024) | $13B+ |
| Global NRW | ~30% |
What is included in the product
 Detailed Word Document
Explores how macro-environmental forces uniquely impact Xylem across Political, Economic, Social, Technological, Environmental and Legal dimensions, with data-backed trends and forward-looking insights to inform executives, investors and strategists and to be inserted directly into plans or decks.

 Customizable Excel Spreadsheet
A concise, visually segmented Xylem PESTLE that summarizes external risks and opportunities for quick inclusion in presentations or planning sessions, allowing users to add region- or business-specific notes for fast team alignment.
Economic factors

Cyclical municipal and industrial capex
Macro slowdowns defer municipal and industrial capex, weighing on Xylem equipment sales even as 2024 revenue stayed near $6.1 billion; utilities often push projects into later years. Industrial output and commodity cycles drive process-water demand volatility, linking orders to metals and energy swings. Xylem reported a multi‑quarter backlog (~$2.0 billion at end‑2024) that buffers near‑term weakness but makes order timing lumpy. Service and aftermarket revenues have proven more resilient than new equipment sales.
Interest rates and project financing costs
Higher rates (US fed funds ~5.25% and 10-year Treasury ~4.4% mid-2025) raise the cost of long-lived water infrastructure, pressuring ROI and favoring smaller capital projects. Utilities increasingly prefer retrofits and efficiency upgrades with 2–5 year paybacks. Vendor financing and outcome-based contracts (availability/performance models) help close deals. Rate cuts historically revive deferred projects and enable longer-scope tenders.

Currency volatility across global footprint
FX swings materially affect Xylem’s reported revenues and margins, with global dollar strength in 2023–24 amplifying translation impacts for multinational industrials; local-cost manufacturing and natural hedging lower translation risk by matching costs to local currency. Emerging market currency depreciations, often in double digits (eg several EM currencies fell 20–40% in 2023–24), squeeze customer affordability and tender sizes. Pricing discipline and active hedging programs are critical to protect margins and cash flow.

Energy prices and operating cost focus
Pumping consumes roughly 10% of global electricity (IEA), so high power costs drive strong demand for high-efficiency pumps. Variable speed drives, advanced hydraulics and optimization software increasingly sell on energy savings and controls rather than upfront capex. Customers prioritise total cost of ownership; falling energy prices can stretch payback periods and delay upgrades.
- Energy intensity: pumps ≈10% global electricity
- Tech drivers: VSDs, advanced hydraulics, optimization software
- Buyer focus: TCO over capex
- Market sensitivity: lower energy prices lengthen payback
Population growth and water scarcity economics
Structural scarcity raises the value of leakage control, reuse and desalination pretreatment; 2 billion people live in water-stressed countries (UN) and non-revenue water averages about 30% globally (World Bank). Agricultural efficiency gains matter as farming uses roughly 70% of freshwater (FAO). Willingness to pay rises where scarcity is acute, but pricing pressure persists in low-income regions.
- 2 billion people in water-stressed areas (UN)
- ~30% global non-revenue water (World Bank)
- ~70% freshwater used by agriculture (FAO)
- Higher willingness to pay in acute scarcity; pricing pressure in low-income markets
Govt water spending, MDB climate funds and PPPs drive smart-meter demand; policy risks slow sales
Macro slowdowns defer municipal and industrial capex, keeping Xylem revenue near $6.1B (2024) and backlog ~$2.0B (end‑2024). Higher rates (fed funds ~5.25%, 10yr ~4.4% mid‑2025) raise infrastructure ROI hurdles, favoring retrofits and vendor financing. FX swings and EM currency falls (20–40% in 2023–24) pressure margins; energy prices and 10% pump electricity share drive demand for efficiency.
| Metric | Value |
|---|---|
| 2024 Revenue | $6.1B |
| Backlog | $2.0B |
| Fed funds / 10yr | ~5.25% / ~4.4% (mid‑2025) |
| Water stress / NRW | 2B people / ~30% |
Preview Before You Purchase
Xylem PESTLE Analysis
The Xylem PESTLE Analysis preview shown here is the exact document you’ll receive after purchase—fully formatted and ready to use. It contains the complete political, economic, social, technological, legal and environmental assessment as displayed, with no placeholders or edits needed. After checkout you’ll instantly download this same finished file, structured for immediate application.

Product Information
Product Information
Shipping & Returns
Shipping & Returns
Description
Plan Smarter. Present Sharper. Compete Stronger.
Explore how political shifts, economic cycles, technological innovation and environmental regulation are reshaping Xylem's outlook in this concise PESTLE snapshot. Our expert analysis turns external trends into strategic actions. Purchase the full PESTLE for the complete, ready-to-use intelligence.
Political factors
Infrastructure spending and public budgets
Xylem’s municipal demand is closely tied to government-funded water programs; for example the 2021 US Infrastructure Investment and Jobs Act committed roughly $55 billion for water infrastructure, accelerating pipe, pump and treatment upgrades, while fiscal austerity, political gridlock or election cycles can delay tenders and lengthen sales cycles.
Water policy, tariffs, and public-private models
Shifts toward privatization and PPPs — World Bank PPI database records over 800 private water projects since 1990 — open procurement to performance-based solutions that favor Xylem’s tech-led offerings. Tariff reforms and cost-recovery mandates matter because OECD estimates a $200–300 billion annual investment need for water infrastructure, affecting utilities’ capex capacity. National water security plans focus on leakage reduction and reuse (global non-revenue water ~30%), aligning with Xylem’s leakage and reuse portfolio, while populist tariff freezes can suppress utility investment and delay project rollouts.
Geopolitical risk and supply chain exposure
Trade tensions, sanctions and export controls can interrupt component flows and regional sales for Xylem, a company operating in over 150 countries, raising costs and lead times. Localization policies push in-country manufacturing and service footprints, reflected in Xylem’s network of roughly 90 manufacturing and regional hubs. Political instability in emerging markets threatens project execution and receivables, and diversified sourcing plus regional hubs mitigate such shocks.
Development finance and multilateral funding
World Bank, regional development banks and climate funds underwrite large water projects, mobilizing billions annually; Green Climate Fund approved over 13 billion USD by 2024. Eligibility increasingly favors efficient, resilient, low-emission solutions, lengthening technical requirements. Project pipelines can be lengthy but provide multi-year visibility once approved. Vendor compliance and reporting requirements raise administrative and cost burdens.
- Underwriting scale: MDBs & climate funds mobilize billions
- Eligibility: efficiency, resilience, low emissions prioritized
- Pipeline: long timelines, multi-year visibility
- Vendor burden: higher compliance and reporting costs
Urbanization and national resilience agendas
Governments increasingly prioritize drought, flood and stormwater resilience as urban populations rise from 56% in 2020 toward 68% by 2050 (UN DESA), driving investments in rapid-response water infrastructure. Mandates to cut non-revenue water (global average ~30%, IWA) and deploy smart metering boost demand for digital networks. Recovery funds such as the US $55 billion water allocation in the Infrastructure Investment and Jobs Act and the EU Recovery and Resilience Facility (723.8 billion EUR) can fast-track pump and treatment deployments, while civil defense planning favors reliable, rapidly deployable equipment.
- Resilience funding: US $55B; EU RRF 723.8bn EUR
- Urbanization: 56% (2020) → 68% (2050)
- NRW: ~30% global average
- Drivers: smart metering mandates, disaster recovery fast-tracking
Govt water spending, MDB climate funds and PPPs drive smart-meter demand; policy risks slow sales
Xylem’s municipal demand tied to government water spending (US $55B in 2021 IIJA, EU RRF 723.8bn EUR) and MDB/climate funding (Green Climate Fund >$13B approved by 2024). Privatization/PPPs (World Bank PPI >800 water projects since 1990) and smart-meter mandates boost tech uptake, while tariff freezes, trade barriers and political instability lengthen sales cycles and raise compliance costs.
| Metric | Value |
|---|---|
| US water IIJA | $55B |
| EU RRF | €723.8B |
| GCF approved (2024) | $13B+ |
| Global NRW | ~30% |
What is included in the product
Detailed Word Document
Explores how macro-environmental forces uniquely impact Xylem across Political, Economic, Social, Technological, Environmental and Legal dimensions, with data-backed trends and forward-looking insights to inform executives, investors and strategists and to be inserted directly into plans or decks.
Customizable Excel Spreadsheet
A concise, visually segmented Xylem PESTLE that summarizes external risks and opportunities for quick inclusion in presentations or planning sessions, allowing users to add region- or business-specific notes for fast team alignment.
Economic factors
Cyclical municipal and industrial capex
Macro slowdowns defer municipal and industrial capex, weighing on Xylem equipment sales even as 2024 revenue stayed near $6.1 billion; utilities often push projects into later years. Industrial output and commodity cycles drive process-water demand volatility, linking orders to metals and energy swings. Xylem reported a multi‑quarter backlog (~$2.0 billion at end‑2024) that buffers near‑term weakness but makes order timing lumpy. Service and aftermarket revenues have proven more resilient than new equipment sales.
Interest rates and project financing costs
Higher rates (US fed funds ~5.25% and 10-year Treasury ~4.4% mid-2025) raise the cost of long-lived water infrastructure, pressuring ROI and favoring smaller capital projects. Utilities increasingly prefer retrofits and efficiency upgrades with 2–5 year paybacks. Vendor financing and outcome-based contracts (availability/performance models) help close deals. Rate cuts historically revive deferred projects and enable longer-scope tenders.
Currency volatility across global footprint
FX swings materially affect Xylem’s reported revenues and margins, with global dollar strength in 2023–24 amplifying translation impacts for multinational industrials; local-cost manufacturing and natural hedging lower translation risk by matching costs to local currency. Emerging market currency depreciations, often in double digits (eg several EM currencies fell 20–40% in 2023–24), squeeze customer affordability and tender sizes. Pricing discipline and active hedging programs are critical to protect margins and cash flow.
Energy prices and operating cost focus
Pumping consumes roughly 10% of global electricity (IEA), so high power costs drive strong demand for high-efficiency pumps. Variable speed drives, advanced hydraulics and optimization software increasingly sell on energy savings and controls rather than upfront capex. Customers prioritise total cost of ownership; falling energy prices can stretch payback periods and delay upgrades.
- Energy intensity: pumps ≈10% global electricity
- Tech drivers: VSDs, advanced hydraulics, optimization software
- Buyer focus: TCO over capex
- Market sensitivity: lower energy prices lengthen payback
Population growth and water scarcity economics
Structural scarcity raises the value of leakage control, reuse and desalination pretreatment; 2 billion people live in water-stressed countries (UN) and non-revenue water averages about 30% globally (World Bank). Agricultural efficiency gains matter as farming uses roughly 70% of freshwater (FAO). Willingness to pay rises where scarcity is acute, but pricing pressure persists in low-income regions.
- 2 billion people in water-stressed areas (UN)
- ~30% global non-revenue water (World Bank)
- ~70% freshwater used by agriculture (FAO)
- Higher willingness to pay in acute scarcity; pricing pressure in low-income markets
Govt water spending, MDB climate funds and PPPs drive smart-meter demand; policy risks slow sales
Macro slowdowns defer municipal and industrial capex, keeping Xylem revenue near $6.1B (2024) and backlog ~$2.0B (end‑2024). Higher rates (fed funds ~5.25%, 10yr ~4.4% mid‑2025) raise infrastructure ROI hurdles, favoring retrofits and vendor financing. FX swings and EM currency falls (20–40% in 2023–24) pressure margins; energy prices and 10% pump electricity share drive demand for efficiency.
| Metric | Value |
|---|---|
| 2024 Revenue | $6.1B |
| Backlog | $2.0B |
| Fed funds / 10yr | ~5.25% / ~4.4% (mid‑2025) |
| Water stress / NRW | 2B people / ~30% |
Preview Before You Purchase
Xylem PESTLE Analysis
The Xylem PESTLE Analysis preview shown here is the exact document you’ll receive after purchase—fully formatted and ready to use. It contains the complete political, economic, social, technological, legal and environmental assessment as displayed, with no placeholders or edits needed. After checkout you’ll instantly download this same finished file, structured for immediate application.











