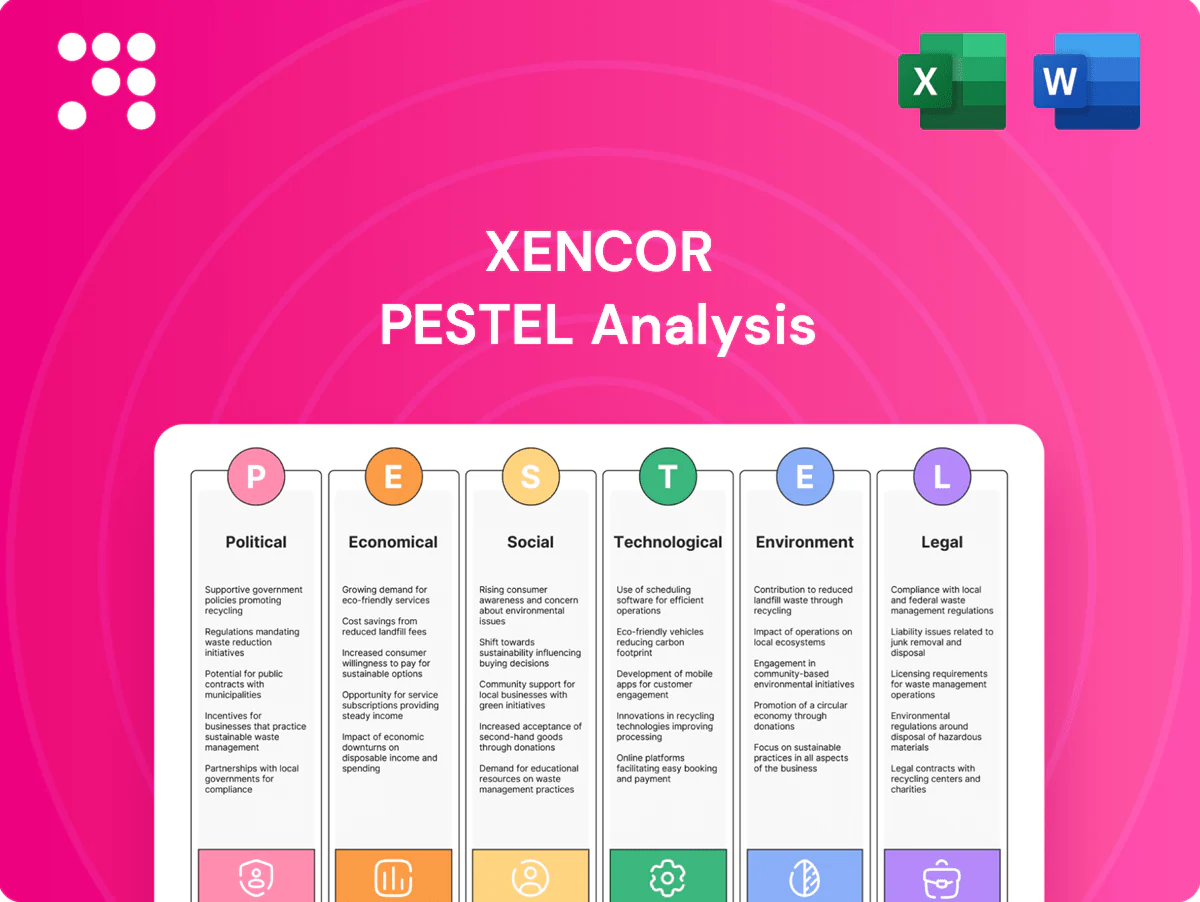
Xencor PESTLE Analysis

Make Smarter Strategic Decisions with a Complete PESTEL View
Gain a competitive edge with our PESTLE Analysis of Xencor—uncover how political, economic, social, technological, legal and environmental forces shape its strategy and pipeline. Ready-made for investors and strategists, this concise briefing points to risks and opportunities; purchase the full report for the complete, editable deep-dive and actionable intelligence.
Political factors

Regulatory approval climate (FDA/EMA)
FDA PDUFA targets standard reviews at 10 months and priority reviews at 6 months, while EMA centralized assessment targets 210 days plus clock stops, so timelines, guidance clarity and agency priorities materially shape Xencor’s path to market. Shifts in leadership or policy can raise evidentiary bars or speed breakthrough/PRIME programs (PRIME launched 2016). Divergence between U.S. and EU rules alters trial design, regulatory filings and costs.
Drug pricing and reimbursement policy
Government actions such as the Inflation Reduction Act’s Medicare negotiation (phased starts in 2026) and rising international reference pricing tighten revenue upside for Xencor, where specialty drugs now represent ~55% of US drug spend (2023 IQVIA). Political pressure to cut specialty prices can lower partnering and launch premiums, while value‑based contracts may favor XmAb’s differentiated efficacy/safety and stabilize reimbursement, supporting late‑stage valuation confidence.

Public funding and innovation incentives
Grants and tax credits, including the 25% orphan-drug clinical trial tax credit and a ~49 billion USD NIH budget, plus pandemic-era programs like the ~18 billion USD Operation Warp Speed, de-risk Xencor’s early programs. Shifts in NIH and foundation priorities reshape translational collaborations and co-funding. Seven-year orphan exclusivity and oncology incentives bolster economic viability for Xencor assets. Rising geopolitical R&D competition expands funding but increases compliance and export-control overhead.

Trade policy and cross-border collaboration
Trade policy shapes Xencor’s global trials and biologics manufacturing: tariffs, export controls and cross-border data rules add compliance costs and can delay supply chains amid a global biologics market estimated at about $350 billion in 2023.
- Tariffs/export controls raise compliance costs
- Visa/customs affect access to international sites
- Sourcing reagents/single-use systems vulnerable to trade tensions
- Ex-US pharma partnerships require local political risk management
Healthcare infrastructure and public health agendas
National cancer plans and autoimmune initiatives shape Xencor trial recruitment and hospital uptake, while US federal research funding (NIH FY2024 ~49.7 billion) and political backing for precision medicine boost biomarker-driven studies and companion diagnostics. Pandemic preparedness can both divert clinical resources and enable fast-track regulatory pathways. Public procurement and formulary policies determine hospital access and uptake in major markets.
- National plans influence patient pools and adoption
- NIH FY2024 ~49.7 billion supports biomarker research
- Pandemic policies = resource diversion or accelerated review
- Procurement/formulary rules affect hospital access
FDA/EMA timelines and IRA pricing squeeze biologics revenue; NIH and orphan incentives cushion R&D
Regulatory timelines (FDA PDUFA 6–10 months; EMA ~210 days) and divergent U.S./EU rules materially affect Xencor trial design and costs. IRA Medicare negotiation (phased from 2026) and specialty drug pricing pressure (specialty ~55% of US drug spend, 2023) compress revenue upside. NIH FY2024 ~49.7B and orphan incentives (7-year exclusivity) support R&D and valuation.
| Metric | Value |
|---|---|
| FDA review | 6–10 months |
| EMA review | ~210 days |
| Specialty share US spend | ~55% (2023) |
| NIH FY2024 | $49.7B |
| Global biologics market | $350B (2023) |
What is included in the product
 Detailed Word Document
Explores how macro-environmental factors uniquely affect Xencor across Political, Economic, Social, Technological, Environmental, and Legal dimensions, with data-backed trends and region-specific regulatory context. Designed for executives and investors, the analysis includes detailed subpoints, forward-looking scenarios, and actionable insights to identify risks and growth opportunities.

 Customizable Excel Spreadsheet
Xencor PESTLE delivers a clean, segmented summary of external factors—political, economic, social, technological, legal and environmental—so teams can quickly assess risks and market positioning, drop concise slides into presentations, and share annotated notes for faster strategic alignment.
Economic factors

Capital markets and funding cycles
Biotech valuation cycles set Xencor’s cost of capital, shaping whether it uses equity for pipeline advancement or leans on partnerships; in mid‑2025 the 10‑year US Treasury yield near 4.0% raised discount rates and hurdle returns. Risk‑on windows enable follow‑on offerings and secondary raises, while downturns force prioritization and partnering. Liquidity conditions dictate milestone‑heavy deal structures and M&A appetite.
Partnering economics and royalty streams
Licensing of XmAb technology produces upfronts, milestone payments, and royalties that smooth Xencor cash flows and de-risk timing of revenue recognition. Deal economics depend on clinical risk, the competitive antibody landscape, and platform differentiation, with higher-value terms tied to first-in-class signals. Co-development cost sharing with partners can extend runway by shifting clinical spend. Robust royalty inflation protection is increasingly important amid pricing pressure and reimbursement scrutiny.

Biologics manufacturing costs and COGS
Rising input prices—cell culture media and chromatography resins up roughly 12% YoY in 2023–24—compress Xencor’s margins by increasing COGS. Scale-up efficiency and higher yields remain critical: a 10–20% uplift in downstream yield can cut unit costs materially. CDMO capacity ran near 85–90% utilization in 2023–24, tightening pricing cycles and budgets. Targeted process innovations have shown potential to lower COGS by around 15–20%.

Payer mix and market access dynamics
Oncology and autoimmune therapies for Xencor skew toward specialty channels with routine prior authorization, and US value assessments (ICER) commonly reference $100,000–$150,000 per QALY while UK/NICE thresholds sit around £20,000–£30,000; these shape launch pricing and early uptake. Copay dynamics and manufacturer patient-assistance programs can cut patient OOP by as much as 70–90%, materially reducing realized net price. Global expansion forces navigation of diverse HTA thresholds across 30+ agencies, impacting market access timing and pricing flexibility.
- Channel: specialty pharmacies/prior auth
- ICER: $100k–$150k/QALY; NICE: £20k–£30k/QALY
- Patient assistance: lowers OOP 70–90%
- HTA: 30+ national agencies, varied thresholds
Macroeconomic stability and currency
Recession risk—IMF April 2025 global growth forecast about 3.0%—can compress healthcare spending and investor risk tolerance, pressuring Xencor R&D funding and licensing deals. Currency swings have raised ex-US trial and milestone-payment volatility after a roughly 6–9% annual USD move vs major currencies in 2024–25. Inflation elevated operating costs and scientific salary bands; U.S. CPI remained in the low single digits into mid-2025. Supply-chain disruptions lengthened lead times and working capital needs for biologics components.
- Recession risk: IMF global growth ~3.0% (Apr 2025)
- Currency volatility: 6–9% annual USD swings (2024–25)
- Inflation: U.S. CPI low single digits into mid-2025
- Supply chain: extended lead times → higher WC
FDA/EMA timelines and IRA pricing squeeze biologics revenue; NIH and orphan incentives cushion R&D
Macro rates (10y US Treasury ~4.0% mid‑2025) raise Xencor’s discount rates, tilting funding toward deals and partnerships. Licensing (upfronts, milestones, royalties) smooths cash flow; co‑development shifts clinical spend. Input costs rose ~12% YoY (2023–24) and CDMO utilization ~85–90%, squeezing margins. IMF global growth ~3.0% (Apr 2025) and low‑single‑digit US CPI keep pricing/reimbursement pressure.
| Metric | Value |
|---|---|
| 10y US Treasury | ~4.0% (mid‑2025) |
| Input costs | +~12% YoY (2023–24) |
| CDMO utilization | 85–90% |
| Global growth (IMF) | ~3.0% Apr 2025 |
Full Version Awaits
Xencor PESTLE Analysis
This preview of the Xencor PESTLE Analysis is the exact, fully formatted document you’ll receive after purchase. It contains the complete political, economic, social, technological, legal and environmental assessment as shown—no placeholders or teasers. After checkout you’ll instantly download this same ready-to-use file.

Product Information
Product Information
Shipping & Returns
Shipping & Returns
Description
Make Smarter Strategic Decisions with a Complete PESTEL View
Gain a competitive edge with our PESTLE Analysis of Xencor—uncover how political, economic, social, technological, legal and environmental forces shape its strategy and pipeline. Ready-made for investors and strategists, this concise briefing points to risks and opportunities; purchase the full report for the complete, editable deep-dive and actionable intelligence.
Political factors
Regulatory approval climate (FDA/EMA)
FDA PDUFA targets standard reviews at 10 months and priority reviews at 6 months, while EMA centralized assessment targets 210 days plus clock stops, so timelines, guidance clarity and agency priorities materially shape Xencor’s path to market. Shifts in leadership or policy can raise evidentiary bars or speed breakthrough/PRIME programs (PRIME launched 2016). Divergence between U.S. and EU rules alters trial design, regulatory filings and costs.
Drug pricing and reimbursement policy
Government actions such as the Inflation Reduction Act’s Medicare negotiation (phased starts in 2026) and rising international reference pricing tighten revenue upside for Xencor, where specialty drugs now represent ~55% of US drug spend (2023 IQVIA). Political pressure to cut specialty prices can lower partnering and launch premiums, while value‑based contracts may favor XmAb’s differentiated efficacy/safety and stabilize reimbursement, supporting late‑stage valuation confidence.
Public funding and innovation incentives
Grants and tax credits, including the 25% orphan-drug clinical trial tax credit and a ~49 billion USD NIH budget, plus pandemic-era programs like the ~18 billion USD Operation Warp Speed, de-risk Xencor’s early programs. Shifts in NIH and foundation priorities reshape translational collaborations and co-funding. Seven-year orphan exclusivity and oncology incentives bolster economic viability for Xencor assets. Rising geopolitical R&D competition expands funding but increases compliance and export-control overhead.
Trade policy and cross-border collaboration
Trade policy shapes Xencor’s global trials and biologics manufacturing: tariffs, export controls and cross-border data rules add compliance costs and can delay supply chains amid a global biologics market estimated at about $350 billion in 2023.
- Tariffs/export controls raise compliance costs
- Visa/customs affect access to international sites
- Sourcing reagents/single-use systems vulnerable to trade tensions
- Ex-US pharma partnerships require local political risk management
Healthcare infrastructure and public health agendas
National cancer plans and autoimmune initiatives shape Xencor trial recruitment and hospital uptake, while US federal research funding (NIH FY2024 ~49.7 billion) and political backing for precision medicine boost biomarker-driven studies and companion diagnostics. Pandemic preparedness can both divert clinical resources and enable fast-track regulatory pathways. Public procurement and formulary policies determine hospital access and uptake in major markets.
- National plans influence patient pools and adoption
- NIH FY2024 ~49.7 billion supports biomarker research
- Pandemic policies = resource diversion or accelerated review
- Procurement/formulary rules affect hospital access
FDA/EMA timelines and IRA pricing squeeze biologics revenue; NIH and orphan incentives cushion R&D
Regulatory timelines (FDA PDUFA 6–10 months; EMA ~210 days) and divergent U.S./EU rules materially affect Xencor trial design and costs. IRA Medicare negotiation (phased from 2026) and specialty drug pricing pressure (specialty ~55% of US drug spend, 2023) compress revenue upside. NIH FY2024 ~49.7B and orphan incentives (7-year exclusivity) support R&D and valuation.
| Metric | Value |
|---|---|
| FDA review | 6–10 months |
| EMA review | ~210 days |
| Specialty share US spend | ~55% (2023) |
| NIH FY2024 | $49.7B |
| Global biologics market | $350B (2023) |
What is included in the product
Detailed Word Document
Explores how macro-environmental factors uniquely affect Xencor across Political, Economic, Social, Technological, Environmental, and Legal dimensions, with data-backed trends and region-specific regulatory context. Designed for executives and investors, the analysis includes detailed subpoints, forward-looking scenarios, and actionable insights to identify risks and growth opportunities.
Customizable Excel Spreadsheet
Xencor PESTLE delivers a clean, segmented summary of external factors—political, economic, social, technological, legal and environmental—so teams can quickly assess risks and market positioning, drop concise slides into presentations, and share annotated notes for faster strategic alignment.
Economic factors
Capital markets and funding cycles
Biotech valuation cycles set Xencor’s cost of capital, shaping whether it uses equity for pipeline advancement or leans on partnerships; in mid‑2025 the 10‑year US Treasury yield near 4.0% raised discount rates and hurdle returns. Risk‑on windows enable follow‑on offerings and secondary raises, while downturns force prioritization and partnering. Liquidity conditions dictate milestone‑heavy deal structures and M&A appetite.
Partnering economics and royalty streams
Licensing of XmAb technology produces upfronts, milestone payments, and royalties that smooth Xencor cash flows and de-risk timing of revenue recognition. Deal economics depend on clinical risk, the competitive antibody landscape, and platform differentiation, with higher-value terms tied to first-in-class signals. Co-development cost sharing with partners can extend runway by shifting clinical spend. Robust royalty inflation protection is increasingly important amid pricing pressure and reimbursement scrutiny.
Biologics manufacturing costs and COGS
Rising input prices—cell culture media and chromatography resins up roughly 12% YoY in 2023–24—compress Xencor’s margins by increasing COGS. Scale-up efficiency and higher yields remain critical: a 10–20% uplift in downstream yield can cut unit costs materially. CDMO capacity ran near 85–90% utilization in 2023–24, tightening pricing cycles and budgets. Targeted process innovations have shown potential to lower COGS by around 15–20%.
Payer mix and market access dynamics
Oncology and autoimmune therapies for Xencor skew toward specialty channels with routine prior authorization, and US value assessments (ICER) commonly reference $100,000–$150,000 per QALY while UK/NICE thresholds sit around £20,000–£30,000; these shape launch pricing and early uptake. Copay dynamics and manufacturer patient-assistance programs can cut patient OOP by as much as 70–90%, materially reducing realized net price. Global expansion forces navigation of diverse HTA thresholds across 30+ agencies, impacting market access timing and pricing flexibility.
- Channel: specialty pharmacies/prior auth
- ICER: $100k–$150k/QALY; NICE: £20k–£30k/QALY
- Patient assistance: lowers OOP 70–90%
- HTA: 30+ national agencies, varied thresholds
Macroeconomic stability and currency
Recession risk—IMF April 2025 global growth forecast about 3.0%—can compress healthcare spending and investor risk tolerance, pressuring Xencor R&D funding and licensing deals. Currency swings have raised ex-US trial and milestone-payment volatility after a roughly 6–9% annual USD move vs major currencies in 2024–25. Inflation elevated operating costs and scientific salary bands; U.S. CPI remained in the low single digits into mid-2025. Supply-chain disruptions lengthened lead times and working capital needs for biologics components.
- Recession risk: IMF global growth ~3.0% (Apr 2025)
- Currency volatility: 6–9% annual USD swings (2024–25)
- Inflation: U.S. CPI low single digits into mid-2025
- Supply chain: extended lead times → higher WC
FDA/EMA timelines and IRA pricing squeeze biologics revenue; NIH and orphan incentives cushion R&D
Macro rates (10y US Treasury ~4.0% mid‑2025) raise Xencor’s discount rates, tilting funding toward deals and partnerships. Licensing (upfronts, milestones, royalties) smooths cash flow; co‑development shifts clinical spend. Input costs rose ~12% YoY (2023–24) and CDMO utilization ~85–90%, squeezing margins. IMF global growth ~3.0% (Apr 2025) and low‑single‑digit US CPI keep pricing/reimbursement pressure.
| Metric | Value |
|---|---|
| 10y US Treasury | ~4.0% (mid‑2025) |
| Input costs | +~12% YoY (2023–24) |
| CDMO utilization | 85–90% |
| Global growth (IMF) | ~3.0% Apr 2025 |
Full Version Awaits
Xencor PESTLE Analysis
This preview of the Xencor PESTLE Analysis is the exact, fully formatted document you’ll receive after purchase. It contains the complete political, economic, social, technological, legal and environmental assessment as shown—no placeholders or teasers. After checkout you’ll instantly download this same ready-to-use file.











