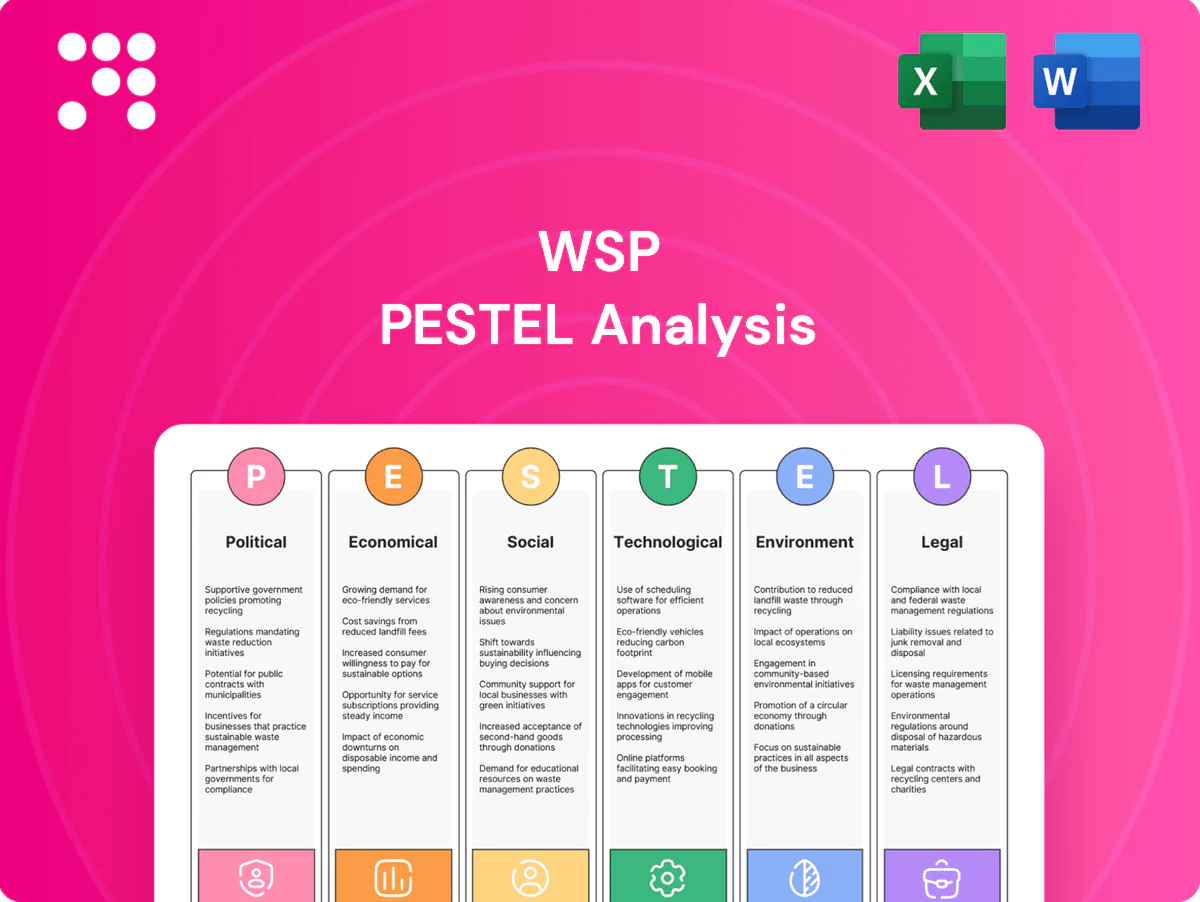
WSP PESTLE Analysis

Your Shortcut to Market Insight Starts Here
Discover how political shifts, economic trends, social dynamics, technological advances, legal changes, and environmental pressures are shaping WSP’s strategic outlook. Our concise PESTLE highlights key external risks and opportunities for investors and planners. Purchase the full report to get actionable, exportable insights instantly.
Political factors

Infrastructure policy shifts
Government priorities drive funding for transport, water and energy projects that underpin WSP’s pipeline, highlighted by stimulus packages like the US Infrastructure Investment and Jobs Act allocating about 550 billion USD in new spending through 2026. Post-election shifts can reallocate budgets and pivot delivery models between public and PPPs, altering project pipelines. WSP must align proposals to policy agendas and tender calendars; proactive stakeholder engagement reduces volatility and captures stimulus-led demand.
Geopolitical risk and trade
Sanctions, supply‑chain restrictions and regional tensions lengthen project timing and raise input costs, with World Bank data showing merchandise trade volume grew just 0.7% in 2023, reflecting constrained flows. Cross‑border workfaces face permitting delays and compliance burdens that increase overhead and risk. Diversification across markets lowers concentration risk while scenario planning guides resource allocation and dynamic pricing.

Urbanization and public spending
Rising urbanization — UN estimates 56% of the global population was urban in 2023 — sustains political support for transit, housing and resilience programs amid a projected $15 trillion global infrastructure investment gap to 2040. Fiscal constraints at municipal/state level often delay approvals or favor lower-cost options; WSP can offer phased designs and value engineering aligned to budget cycles. Evidence-based outcomes strengthen voter-backed initiative approvals.

Climate policy and net zero
- Policy-driven demand growth
- Green finance uptake hinges on clarity
- WSP as roadmap translator
- Taxonomy alignment boosts public funding access
Procurement and localization
Rules on local content, ESG and transparency materially shape bid competitiveness; WSP reported CAD 10.8 billion revenue in 2024, underscoring scale that must be balanced with local hiring and supply-chain commitments. Political scrutiny rewards firms with demonstrable community impact and clean integrity records, improving approval odds. Robust governance and local partnerships raise win rates and speed regulatory approvals.
- local content: align to 20–40% thresholds
- ESG: net-zero and social requirements in >50 markets
- governance: stronger compliance = higher approval probability
USD550bn IIJA, $15T gap to 2040 force firms into green finance
US IIJA USD550bn to 2026, 140+ countries and 1,000+ cities net‑zero, and a $15T global infrastructure gap to 2040 expand demand; WSP (CAD10.8bn revenue 2024) must manage local‑content/ESG rules amid trade frictions (merchandise trade +0.7% 2023) via market diversification and green‑finance alignment.
| Metric | Value |
|---|---|
| WSP revenue (2024) | CAD10.8bn |
| IIJA | USD550bn |
| Infra gap to 2040 | USD15T |
What is included in the product
 Detailed Word Document
Explores how Political, Economic, Social, Technological, Environmental, and Legal forces uniquely affect WSP, using current data and trends to highlight risks and growth levers; designed for executives, consultants, and investors to inform strategy, funding pitches, and scenario planning with region- and industry-specific examples and forward-looking insights.

 Customizable Excel Spreadsheet
A clean, visually segmented PESTLE summary for WSP that’s easily dropped into presentations or shared across teams; allows quick annotations for region- or business-line-specific risks and supports rapid alignment in planning and strategy sessions.
Economic factors

Cycles and capital availability
Interest rates and credit conditions—US federal funds 5.25–5.50% in 2024 and ECB deposit rate ~4.00% in 2024—tighten financing and can delay private infrastructure and real estate starts, while public programs such as the US IIJA ($1.2tn) support counter-cyclical activity. WSP can shift toward regulated and essential sectors, use flexible staffing and 6–12 month backlog management to protect margins.
Inflation and cost pressures
Rising wages, materials and subcontractor costs compressed fixed-fee project margins as global construction cost inflation averaged 6.2% in 2024 (Turner & Townsend), increasing bid risk for WSP on large programs. Indexation and clear contingency clauses have preserved profitability on legacy contracts. Efficient delivery through standardized designs and repeatable packages offsets inflationary pressure, while timely change orders and strict scope control remain critical to protect margins.

Currency fluctuations
WSPs multi-country revenues and costs expose the group to foreign exchange volatility across its international footprint. Robust hedging policies and natural currency offsets in revenue versus cost bases help reduce reported earnings swings. Pricing strategies and aligning contract currencies mitigate transactional risk. Transparent FX guidance in quarterly financial filings supports investor confidence.

Energy and commodity trends
Energy price volatility (Brent ~86 USD/b in 2024) raises construction delays and operating costs, squeezing margins in infrastructure projects.
Growing mining and energy-transition investments (global clean-energy capex >1.7 trillion USD regionally in 2023–24) expand WSP advisory and engineering demand; WSP can pivot to grid modernization, storage and critical-minerals projects to capture that growth.
Portfolio diversification balances sector cyclicality, smoothing revenue swings.
- Brent ~86 USD/b (2024)
- Clean-energy capex >1.7T USD (2023–24)
- Focus: grid, storage, critical minerals
- Portfolio balance reduces cyclicality
Labor market dynamics
Tight engineering labor markets are driving wage inflation and capacity constraints for WSP, with the firm operating roughly 55,000 employees globally in 2024 and facing elevated recruitment costs and longer project lead times. WSP’s strong employer brand and structured training programs support utilization and retention, while selective M&A has been used to acquire scarce specialist skills at scale. Global delivery centers in lower-cost regions materially improve cost-to-serve and margin resilience.
- Headcount: ~55,000 (WSP, 2024)
- Wage pressure: higher recruitment and salary budgets in 2024
- M&A: targeted hires for niche engineering skills
- Global delivery centers: lower cost-to-serve, improved margins
USD550bn IIJA, $15T gap to 2040 force firms into green finance
Macro tightening (US fed funds 5.25–5.50% and ECB deposit ~4.0% in 2024) raises financing costs and can delay private starts while US IIJA ($1.2tn) supports public work. Construction inflation ~6.2% (2024) and Brent ~86 USD/b increase project costs. Clean‑energy capex >1.7T USD (2023–24) and WSP headcount ~55,000 (2024) shape demand and labor supply.
| Metric | Value (2024) |
|---|---|
| US fed funds | 5.25–5.50% |
| ECB deposit | ~4.0% |
| Brent | ~86 USD/b |
| Construction inflation | 6.2% |
| Clean‑energy capex | >1.7T USD |
| WSP headcount | ~55,000 |
What You See Is What You Get
WSP PESTLE Analysis
The WSP PESTLE Analysis preview shown here is the exact document you’ll receive after purchase, fully formatted and ready to use. This real file reflects the complete content, structure and professional layout with no placeholders or teasers. After checkout you’ll be able to download the same finished report instantly. What you see is what you’ll get.

Original: $10.00
-65%$10.00
$3.50Product Information
Product Information
Shipping & Returns
Shipping & Returns
Description
Your Shortcut to Market Insight Starts Here
Discover how political shifts, economic trends, social dynamics, technological advances, legal changes, and environmental pressures are shaping WSP’s strategic outlook. Our concise PESTLE highlights key external risks and opportunities for investors and planners. Purchase the full report to get actionable, exportable insights instantly.
Political factors
Infrastructure policy shifts
Government priorities drive funding for transport, water and energy projects that underpin WSP’s pipeline, highlighted by stimulus packages like the US Infrastructure Investment and Jobs Act allocating about 550 billion USD in new spending through 2026. Post-election shifts can reallocate budgets and pivot delivery models between public and PPPs, altering project pipelines. WSP must align proposals to policy agendas and tender calendars; proactive stakeholder engagement reduces volatility and captures stimulus-led demand.
Geopolitical risk and trade
Sanctions, supply‑chain restrictions and regional tensions lengthen project timing and raise input costs, with World Bank data showing merchandise trade volume grew just 0.7% in 2023, reflecting constrained flows. Cross‑border workfaces face permitting delays and compliance burdens that increase overhead and risk. Diversification across markets lowers concentration risk while scenario planning guides resource allocation and dynamic pricing.
Urbanization and public spending
Rising urbanization — UN estimates 56% of the global population was urban in 2023 — sustains political support for transit, housing and resilience programs amid a projected $15 trillion global infrastructure investment gap to 2040. Fiscal constraints at municipal/state level often delay approvals or favor lower-cost options; WSP can offer phased designs and value engineering aligned to budget cycles. Evidence-based outcomes strengthen voter-backed initiative approvals.
Climate policy and net zero
- Policy-driven demand growth
- Green finance uptake hinges on clarity
- WSP as roadmap translator
- Taxonomy alignment boosts public funding access
Procurement and localization
Rules on local content, ESG and transparency materially shape bid competitiveness; WSP reported CAD 10.8 billion revenue in 2024, underscoring scale that must be balanced with local hiring and supply-chain commitments. Political scrutiny rewards firms with demonstrable community impact and clean integrity records, improving approval odds. Robust governance and local partnerships raise win rates and speed regulatory approvals.
- local content: align to 20–40% thresholds
- ESG: net-zero and social requirements in >50 markets
- governance: stronger compliance = higher approval probability
USD550bn IIJA, $15T gap to 2040 force firms into green finance
US IIJA USD550bn to 2026, 140+ countries and 1,000+ cities net‑zero, and a $15T global infrastructure gap to 2040 expand demand; WSP (CAD10.8bn revenue 2024) must manage local‑content/ESG rules amid trade frictions (merchandise trade +0.7% 2023) via market diversification and green‑finance alignment.
| Metric | Value |
|---|---|
| WSP revenue (2024) | CAD10.8bn |
| IIJA | USD550bn |
| Infra gap to 2040 | USD15T |
What is included in the product
Detailed Word Document
Explores how Political, Economic, Social, Technological, Environmental, and Legal forces uniquely affect WSP, using current data and trends to highlight risks and growth levers; designed for executives, consultants, and investors to inform strategy, funding pitches, and scenario planning with region- and industry-specific examples and forward-looking insights.
Customizable Excel Spreadsheet
A clean, visually segmented PESTLE summary for WSP that’s easily dropped into presentations or shared across teams; allows quick annotations for region- or business-line-specific risks and supports rapid alignment in planning and strategy sessions.
Economic factors
Cycles and capital availability
Interest rates and credit conditions—US federal funds 5.25–5.50% in 2024 and ECB deposit rate ~4.00% in 2024—tighten financing and can delay private infrastructure and real estate starts, while public programs such as the US IIJA ($1.2tn) support counter-cyclical activity. WSP can shift toward regulated and essential sectors, use flexible staffing and 6–12 month backlog management to protect margins.
Inflation and cost pressures
Rising wages, materials and subcontractor costs compressed fixed-fee project margins as global construction cost inflation averaged 6.2% in 2024 (Turner & Townsend), increasing bid risk for WSP on large programs. Indexation and clear contingency clauses have preserved profitability on legacy contracts. Efficient delivery through standardized designs and repeatable packages offsets inflationary pressure, while timely change orders and strict scope control remain critical to protect margins.
Currency fluctuations
WSPs multi-country revenues and costs expose the group to foreign exchange volatility across its international footprint. Robust hedging policies and natural currency offsets in revenue versus cost bases help reduce reported earnings swings. Pricing strategies and aligning contract currencies mitigate transactional risk. Transparent FX guidance in quarterly financial filings supports investor confidence.
Energy and commodity trends
Energy price volatility (Brent ~86 USD/b in 2024) raises construction delays and operating costs, squeezing margins in infrastructure projects.
Growing mining and energy-transition investments (global clean-energy capex >1.7 trillion USD regionally in 2023–24) expand WSP advisory and engineering demand; WSP can pivot to grid modernization, storage and critical-minerals projects to capture that growth.
Portfolio diversification balances sector cyclicality, smoothing revenue swings.
- Brent ~86 USD/b (2024)
- Clean-energy capex >1.7T USD (2023–24)
- Focus: grid, storage, critical minerals
- Portfolio balance reduces cyclicality
Labor market dynamics
Tight engineering labor markets are driving wage inflation and capacity constraints for WSP, with the firm operating roughly 55,000 employees globally in 2024 and facing elevated recruitment costs and longer project lead times. WSP’s strong employer brand and structured training programs support utilization and retention, while selective M&A has been used to acquire scarce specialist skills at scale. Global delivery centers in lower-cost regions materially improve cost-to-serve and margin resilience.
- Headcount: ~55,000 (WSP, 2024)
- Wage pressure: higher recruitment and salary budgets in 2024
- M&A: targeted hires for niche engineering skills
- Global delivery centers: lower cost-to-serve, improved margins
USD550bn IIJA, $15T gap to 2040 force firms into green finance
Macro tightening (US fed funds 5.25–5.50% and ECB deposit ~4.0% in 2024) raises financing costs and can delay private starts while US IIJA ($1.2tn) supports public work. Construction inflation ~6.2% (2024) and Brent ~86 USD/b increase project costs. Clean‑energy capex >1.7T USD (2023–24) and WSP headcount ~55,000 (2024) shape demand and labor supply.
| Metric | Value (2024) |
|---|---|
| US fed funds | 5.25–5.50% |
| ECB deposit | ~4.0% |
| Brent | ~86 USD/b |
| Construction inflation | 6.2% |
| Clean‑energy capex | >1.7T USD |
| WSP headcount | ~55,000 |
What You See Is What You Get
WSP PESTLE Analysis
The WSP PESTLE Analysis preview shown here is the exact document you’ll receive after purchase, fully formatted and ready to use. This real file reflects the complete content, structure and professional layout with no placeholders or teasers. After checkout you’ll be able to download the same finished report instantly. What you see is what you’ll get.











