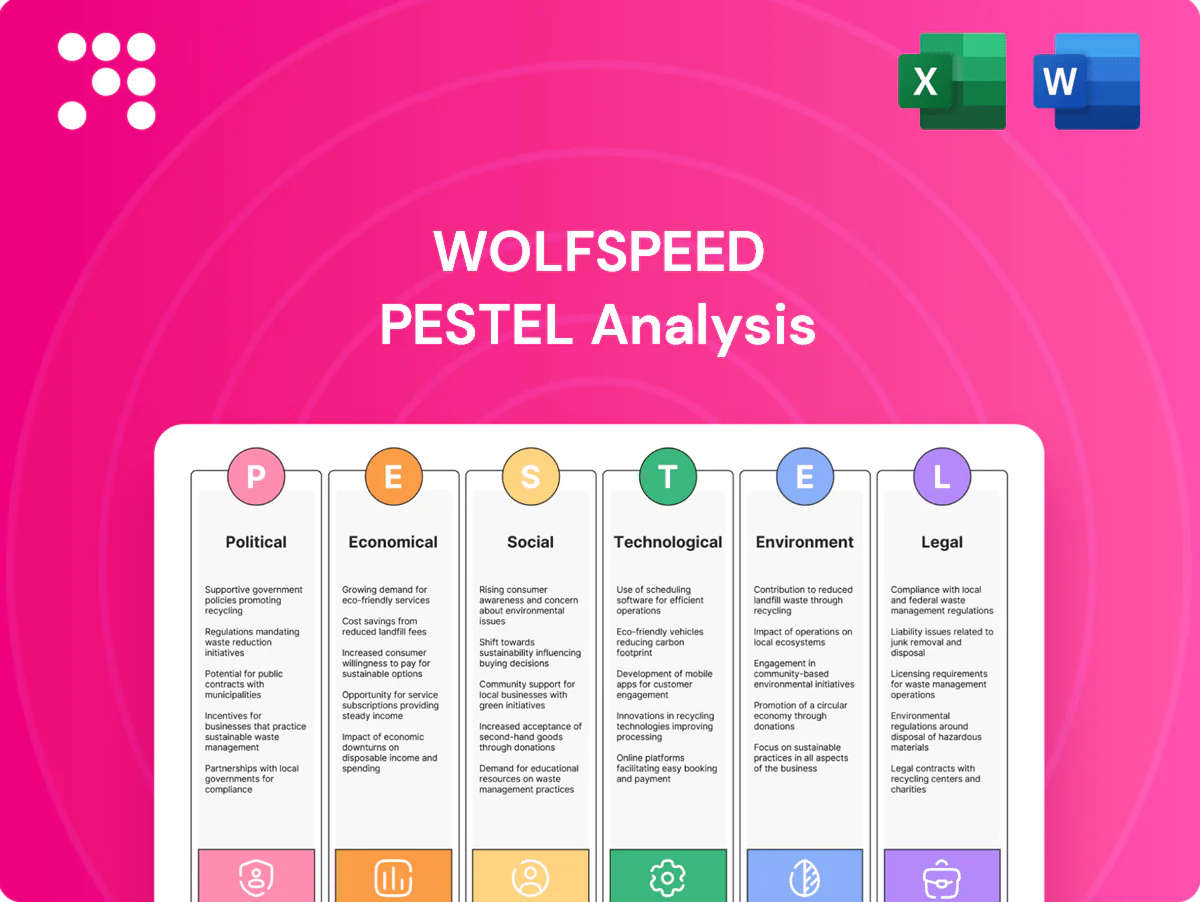
Wolfspeed PESTLE Analysis

Skip the Research. Get the Strategy.
Discover how political shifts, supply-chain economics, and rapid tech advances are shaping Wolfspeed's trajectory in our concise PESTLE snapshot—designed to inform investors and strategists. Buy the full analysis for the complete, actionable breakdown you can use immediately.
Political factors

US industrial policy incentives
CHIPS Act provides $52.7 billion for domestic semiconductor incentives including grants, tax credits, and loan guarantees that can reduce Wolfspeed’s fab and materials capex burden.
Securing awards improves project IRR and accelerates capacity ramps, while compliance, reporting, and localization requirements add complexity and extend timelines.
Competitive allocation among peers can dilute individual awards and delay realization of expected funding.
Export controls and geopolitics
Export controls expanded by the US Commerce Department in 2022–2023 to cover advanced RF/GaN tooling, software and certain power semiconductors, narrowing Wolfspeed's addressable markets and complicating collaborations with customers in restricted jurisdictions. Wolfspeed must segment product lines, secure export licenses and monitor Bureau of Industry and Security updates while China — ~55% of global semiconductor demand in 2023 — remains geopolitically sensitive. Supply-chain rerouting and dual-sourcing have become standard to cut disruption risk, and heightened US-China tensions can quickly shift regional demand.

EV and renewable energy policy support
Subsidies, mandates and infrastructure funding such as the US Inflation Reduction Act (about $369 billion for clean energy) and EV tax credits up to $7,500 accelerate SiC demand for e-mobility and grid applications as global EV sales reached roughly 14 million in 2024. Policy reversals or election swings introduce planning risk for Wolfspeed’s multi‑year capacity builds. Regional differences (US, EU 2035 CO2 standards, China incentives) yield uneven growth, so close policy tracking guides capacity placement and customer mix.

Trade tariffs and localization pressures
Tariffs on components and equipment — including US Section 301 levies often up to 25% — raise Wolfspeed’s input costs and complicate BOM management; CHIPS Act incentives ($52 billion) and growing local-content rules push regional manufacturing footprints. Wolfspeed’s US SiC materials leadership and domestic capacity help offset tariff exposure, while long-term contracts can embed tariff pass-through or cost-sharing mechanisms.
- Tariff impact: Section 301 up to 25%
- Policy driver: CHIPS Act funding $52 billion
- Mitigation: domestic SiC sourcing reduces import share
- Commercial: long-term contracts enable pass-throughs
Permitting and regional development incentives
Permitting, environmental reviews and utility hookups directly affect Wolfspeed fab timelines, with permit delays cascading into customer delivery risk and potential schedule slippage for power-device supply. State and local incentives—land grants, tax abatements and workforce training—can materially improve project economics and lower unit costs. Community benefits agreements increasingly shape local hiring and supply-chain sourcing, influencing operating models and stakeholder support.
- Site approvals → timeline risk
- Incentives → improved NPV
- CBA → hiring/sourcing constraints
- Permit delays → customer delivery exposure
CHIPS $52.7B lowers SiC capex and boosts IRR; export controls, tariffs raise risks
CHIPS Act $52.7B lowers Wolfspeed fab/materials capex and boosts project IRR but awards are competitive and conditional.
US export controls (expanded 2022–23) shrink RF/GaN addressable markets; China ≈55% of semiconductor demand (2023); EV sales ~14M (2024) and IRA ~$369B accelerate SiC demand.
Tariffs up to 25% and permitting/timeline risks raise costs; domestic SiC capacity and long‑term contracts help mitigate exposure.
| Factor | Data/Impact | Mitigation |
|---|---|---|
| CHIPS | $52.7B; capex relief | Grant capture, localization |
| IRA/EV | $369B; EVs ~14M (2024) | Scale SiC for e-mobility |
| Export controls | 2022–23 expansion; limits China sales | Product segmentation, licenses |
| Tariffs | Section 301 up to 25% | Domestic sourcing, pass-through |
| Permitting | Site delays → schedule risk | Local incentives, community agreements |
What is included in the product
 Detailed Word Document
Explores how Political, Economic, Social, Technological, Environmental, and Legal forces uniquely impact Wolfspeed, with each category expanded into detailed, example-driven sub-points reflecting current market and regulatory dynamics. Backed by data and forward-looking insights, the analysis is formatted for direct use in business plans, pitch decks, and strategic decision-making by executives, investors, and advisors.

 Customizable Excel Spreadsheet
Concise, visually segmented Wolfspeed PESTLE summary for quick reference in meetings or presentations, editable for region- or business-specific notes and easily dropped into decks or shared across teams to streamline external risk discussions and strategic planning.
Economic factors

Cyclical semiconductor demand
Industrial, auto, and telecom cycles drive Wolfspeed order volatility even as SiC adoption rises; the global SiC market was about USD 1.2 billion in 2024 and is forecast to grow ~25–30% CAGR to 2030. Long-term agreements (LTAs) give multi-year backlog visibility that cushions downturns, while customer inventory corrections can temporarily mask the underlying secular adoption of SiC devices.
High capex and yield learning
Wolfspeed’s crystal growth, epitaxy and 200mm transitions demand sustained multi‑year capex, with the company committing billions to 200mm capacity expansion across 2024–25; yield ramps are therefore central, as improving yields cuts cost per amp and expands margins, while under‑ramped tools depress early gross margins; efficient yield learning curves remain a key competitive moat.

EV adoption and powertrain mix
SiC content per vehicle varies widely with high‑voltage architectures and inverter choices, typically ~150–800g for modern HV EVs. Global EV sales reached ~14 million in 2024 (≈12% of light‑vehicle sales), so OEM design wins drive Wolfspeed utilization and revenue visibility. OEM cost‑down roadmaps imply 20–40% unit cost reductions over ~3 years to meet price targets. Expanding into charging and auxiliaries (EV charging market ≈$15B in 2024) diversifies auto exposure.

Pricing power vs. new entrants
Short-term tight SiC supply supported Wolfspeed premium pricing, while announced 300 mm capacity expansions will test price elasticity as volumes scale. Device differentiation, published reliability data and superior module-level efficiency underpin sustained ASPs. Vertical integration into substrates and epitaxy stabilizes COGS and margins. Multi-quarter customer qualification cycles raise switching costs and protect pricing power.
- 300 mm capacity expansions
- Vertical integration: substrates + epi
- Module performance drives ASPs
- Multi-quarter qualification = switching costs
FX and commodity/utility costs
Wolfspeed’s predominantly US cost base versus global revenue mix creates FX exposure; the company reported FY2024 revenue of about $1.16 billion, meaning currency swings can materially affect margins. Energy-intensive SiC fabrication ties profitability to electricity prices (US industrial average ~9¢/kWh in 2024), while long-term gas and renewables PPAs and fixed energy contracts have been used to dampen volatility. Inflation in tools and consumables—industry equipment cost inflation near doubledigit in recent cycles—adds pressure to capital budgets.
- FX risk: global sales vs US costs; FY2024 revenue ≈ $1.16B
- Energy: US industrial power ≈ $0.09/kWh (2024)
- Mitigation: long-term energy contracts and renewables PPAs
- Capex pressure: elevated tool/consumable inflation
CHIPS $52.7B lowers SiC capex and boosts IRR; export controls, tariffs raise risks
SiC market ≈ $1.2B in 2024, forecast ~25–30% CAGR to 2030; Wolfspeed FY2024 revenue ≈ $1.16B. Multi‑year, multi‑billion capex for 200mm transitions ties margins to yield ramps; short-term tight supply supports ASPs but 300mm scale will pressure pricing. US cost base creates FX exposure; energy intensity links margins to ≈$0.09/kWh industrial power (2024).
| Metric | Value |
|---|---|
| SiC market (2024) | $1.2B |
| SiC CAGR to 2030 | ~25–30% |
| Wolfspeed FY2024 rev | $1.16B |
| US industrial power (2024) | $0.09/kWh |
| Capex | multi‑year, multi‑billion (200mm) |
Preview the Actual Deliverable
Wolfspeed PESTLE Analysis
The preview shown here is the exact Wolfspeed PESTLE Analysis you’ll receive after purchase—fully formatted, professionally structured, and ready to use. This is the real document, not a teaser or placeholder. After checkout you’ll instantly download the identical file with the same content, layout, and analysis. No surprises—what you see is what you get.

Original: $10.00
-65%$10.00
$3.50Product Information
Product Information
Shipping & Returns
Shipping & Returns
Description
Skip the Research. Get the Strategy.
Discover how political shifts, supply-chain economics, and rapid tech advances are shaping Wolfspeed's trajectory in our concise PESTLE snapshot—designed to inform investors and strategists. Buy the full analysis for the complete, actionable breakdown you can use immediately.
Political factors
US industrial policy incentives
CHIPS Act provides $52.7 billion for domestic semiconductor incentives including grants, tax credits, and loan guarantees that can reduce Wolfspeed’s fab and materials capex burden.
Securing awards improves project IRR and accelerates capacity ramps, while compliance, reporting, and localization requirements add complexity and extend timelines.
Competitive allocation among peers can dilute individual awards and delay realization of expected funding.
Export controls and geopolitics
Export controls expanded by the US Commerce Department in 2022–2023 to cover advanced RF/GaN tooling, software and certain power semiconductors, narrowing Wolfspeed's addressable markets and complicating collaborations with customers in restricted jurisdictions. Wolfspeed must segment product lines, secure export licenses and monitor Bureau of Industry and Security updates while China — ~55% of global semiconductor demand in 2023 — remains geopolitically sensitive. Supply-chain rerouting and dual-sourcing have become standard to cut disruption risk, and heightened US-China tensions can quickly shift regional demand.
EV and renewable energy policy support
Subsidies, mandates and infrastructure funding such as the US Inflation Reduction Act (about $369 billion for clean energy) and EV tax credits up to $7,500 accelerate SiC demand for e-mobility and grid applications as global EV sales reached roughly 14 million in 2024. Policy reversals or election swings introduce planning risk for Wolfspeed’s multi‑year capacity builds. Regional differences (US, EU 2035 CO2 standards, China incentives) yield uneven growth, so close policy tracking guides capacity placement and customer mix.
Trade tariffs and localization pressures
Tariffs on components and equipment — including US Section 301 levies often up to 25% — raise Wolfspeed’s input costs and complicate BOM management; CHIPS Act incentives ($52 billion) and growing local-content rules push regional manufacturing footprints. Wolfspeed’s US SiC materials leadership and domestic capacity help offset tariff exposure, while long-term contracts can embed tariff pass-through or cost-sharing mechanisms.
- Tariff impact: Section 301 up to 25%
- Policy driver: CHIPS Act funding $52 billion
- Mitigation: domestic SiC sourcing reduces import share
- Commercial: long-term contracts enable pass-throughs
Permitting and regional development incentives
Permitting, environmental reviews and utility hookups directly affect Wolfspeed fab timelines, with permit delays cascading into customer delivery risk and potential schedule slippage for power-device supply. State and local incentives—land grants, tax abatements and workforce training—can materially improve project economics and lower unit costs. Community benefits agreements increasingly shape local hiring and supply-chain sourcing, influencing operating models and stakeholder support.
- Site approvals → timeline risk
- Incentives → improved NPV
- CBA → hiring/sourcing constraints
- Permit delays → customer delivery exposure
CHIPS $52.7B lowers SiC capex and boosts IRR; export controls, tariffs raise risks
CHIPS Act $52.7B lowers Wolfspeed fab/materials capex and boosts project IRR but awards are competitive and conditional.
US export controls (expanded 2022–23) shrink RF/GaN addressable markets; China ≈55% of semiconductor demand (2023); EV sales ~14M (2024) and IRA ~$369B accelerate SiC demand.
Tariffs up to 25% and permitting/timeline risks raise costs; domestic SiC capacity and long‑term contracts help mitigate exposure.
| Factor | Data/Impact | Mitigation |
|---|---|---|
| CHIPS | $52.7B; capex relief | Grant capture, localization |
| IRA/EV | $369B; EVs ~14M (2024) | Scale SiC for e-mobility |
| Export controls | 2022–23 expansion; limits China sales | Product segmentation, licenses |
| Tariffs | Section 301 up to 25% | Domestic sourcing, pass-through |
| Permitting | Site delays → schedule risk | Local incentives, community agreements |
What is included in the product
Detailed Word Document
Explores how Political, Economic, Social, Technological, Environmental, and Legal forces uniquely impact Wolfspeed, with each category expanded into detailed, example-driven sub-points reflecting current market and regulatory dynamics. Backed by data and forward-looking insights, the analysis is formatted for direct use in business plans, pitch decks, and strategic decision-making by executives, investors, and advisors.
Customizable Excel Spreadsheet
Concise, visually segmented Wolfspeed PESTLE summary for quick reference in meetings or presentations, editable for region- or business-specific notes and easily dropped into decks or shared across teams to streamline external risk discussions and strategic planning.
Economic factors
Cyclical semiconductor demand
Industrial, auto, and telecom cycles drive Wolfspeed order volatility even as SiC adoption rises; the global SiC market was about USD 1.2 billion in 2024 and is forecast to grow ~25–30% CAGR to 2030. Long-term agreements (LTAs) give multi-year backlog visibility that cushions downturns, while customer inventory corrections can temporarily mask the underlying secular adoption of SiC devices.
High capex and yield learning
Wolfspeed’s crystal growth, epitaxy and 200mm transitions demand sustained multi‑year capex, with the company committing billions to 200mm capacity expansion across 2024–25; yield ramps are therefore central, as improving yields cuts cost per amp and expands margins, while under‑ramped tools depress early gross margins; efficient yield learning curves remain a key competitive moat.
EV adoption and powertrain mix
SiC content per vehicle varies widely with high‑voltage architectures and inverter choices, typically ~150–800g for modern HV EVs. Global EV sales reached ~14 million in 2024 (≈12% of light‑vehicle sales), so OEM design wins drive Wolfspeed utilization and revenue visibility. OEM cost‑down roadmaps imply 20–40% unit cost reductions over ~3 years to meet price targets. Expanding into charging and auxiliaries (EV charging market ≈$15B in 2024) diversifies auto exposure.
Pricing power vs. new entrants
Short-term tight SiC supply supported Wolfspeed premium pricing, while announced 300 mm capacity expansions will test price elasticity as volumes scale. Device differentiation, published reliability data and superior module-level efficiency underpin sustained ASPs. Vertical integration into substrates and epitaxy stabilizes COGS and margins. Multi-quarter customer qualification cycles raise switching costs and protect pricing power.
- 300 mm capacity expansions
- Vertical integration: substrates + epi
- Module performance drives ASPs
- Multi-quarter qualification = switching costs
FX and commodity/utility costs
Wolfspeed’s predominantly US cost base versus global revenue mix creates FX exposure; the company reported FY2024 revenue of about $1.16 billion, meaning currency swings can materially affect margins. Energy-intensive SiC fabrication ties profitability to electricity prices (US industrial average ~9¢/kWh in 2024), while long-term gas and renewables PPAs and fixed energy contracts have been used to dampen volatility. Inflation in tools and consumables—industry equipment cost inflation near doubledigit in recent cycles—adds pressure to capital budgets.
- FX risk: global sales vs US costs; FY2024 revenue ≈ $1.16B
- Energy: US industrial power ≈ $0.09/kWh (2024)
- Mitigation: long-term energy contracts and renewables PPAs
- Capex pressure: elevated tool/consumable inflation
CHIPS $52.7B lowers SiC capex and boosts IRR; export controls, tariffs raise risks
SiC market ≈ $1.2B in 2024, forecast ~25–30% CAGR to 2030; Wolfspeed FY2024 revenue ≈ $1.16B. Multi‑year, multi‑billion capex for 200mm transitions ties margins to yield ramps; short-term tight supply supports ASPs but 300mm scale will pressure pricing. US cost base creates FX exposure; energy intensity links margins to ≈$0.09/kWh industrial power (2024).
| Metric | Value |
|---|---|
| SiC market (2024) | $1.2B |
| SiC CAGR to 2030 | ~25–30% |
| Wolfspeed FY2024 rev | $1.16B |
| US industrial power (2024) | $0.09/kWh |
| Capex | multi‑year, multi‑billion (200mm) |
Preview the Actual Deliverable
Wolfspeed PESTLE Analysis
The preview shown here is the exact Wolfspeed PESTLE Analysis you’ll receive after purchase—fully formatted, professionally structured, and ready to use. This is the real document, not a teaser or placeholder. After checkout you’ll instantly download the identical file with the same content, layout, and analysis. No surprises—what you see is what you get.











