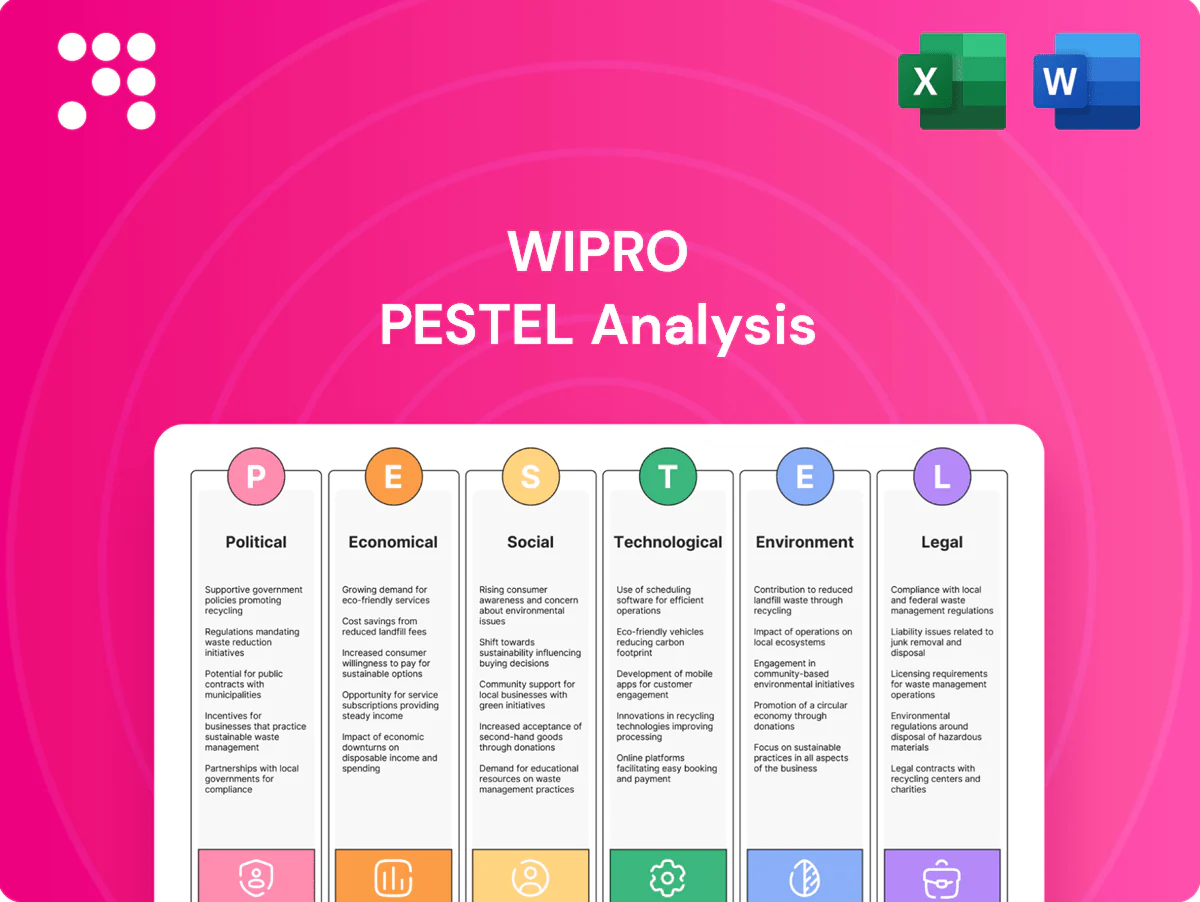
Wipro PESTLE Analysis

Your Shortcut to Market Insight Starts Here
Unlock how political shifts, economic trends, and tech disruption shape Wipro’s strategy with our concise PESTLE snapshot. This analysis highlights regulatory risks, market opportunities, and sustainability pressures you need to know. Ideal for investors and strategists building forecasts or deals. Purchase the full PESTLE to get detailed, actionable insights and ready-to-use charts.
Political factors

Geopolitical risk across client markets
Operating across the US, Europe and APAC exposes Wipro—which derives roughly 65% of revenue from North America and Europe—to policy swings, trade tensions and sanctions; shifts in US visa norms or EU procurement rules can disrupt on-site delivery. Geopolitical instability has lengthened sales cycles and delayed projects in recent years. Proactive country-risk monitoring and diversified delivery centers across India, Latin America and Eastern Europe mitigate shocks.
Government IT spending and digital agendas
National digital transformation programs like India’s Digital India (launched 2015) create large public-sector opportunities that align with Wipro’s services; Wipro reported FY24 revenue of about $11.5B, underlining its scale to pursue multi-year deals prioritizing cybersecurity, cloud and citizen services. Budget cycles and election outcomes frequently shift timing and scope, so building local partnerships and strict compliance is essential to win government tenders.

Incentives for technology and export services
Policies in India and key hubs—tax incentives, SEZ benefits, and enhanced R&D credits—support export-led IT margins; Wipro reported ~USD 11.3bn revenue in FY24, benefiting from such regimes. Sunset clauses or policy shifts can raise effective tax rates and compress margins quickly. Active industry advocacy and footprint optimization across SEZs and low-tax jurisdictions help preserve and extend cost advantages.

Data localization and sovereignty policies
Many countries mandate local storage and processing of sensitive data—notably RBI's 2018 payments data localization directive and China’s PIPL (2021)—which shapes Wipro’s cloud architectures and partner selection. Non-compliance risks contract losses in regulated banking, healthcare and public sectors. Investing in regional data centers and certified compliance frameworks is critical to retain clients and revenue.
- RBI 2018: payments data localization
- PIPL 2021: strict cross‑border controls
- Focus: regional DCs + compliance certifications
Public-private partnerships and critical infrastructure
Modernization of healthcare, utilities and transport increasingly relies on public-private partnerships, where Wipro can provide platforms, systems integration and managed services to enable digital transformation; India's National Infrastructure Pipeline is valued at ₹111 lakh crore (≈US$1.4 trillion) for 2019–25, highlighting scale tied to political priorities; sovereign projects demand clear risk-sharing and robust SLAs.
- Pipeline scale: ₹111 lakh crore (≈US$1.4T) 2019–25
- Wipro roles: platforms, integration, managed services
- Political priority: determines project pipeline strength
- Contract design: risk-sharing and strict SLAs essential
NA/EU policy risk imperils IT exporter with 65% revenue exposure
Wipro faces policy risk from trade, visa and procurement shifts across US/EU where ~65% of revenue comes; FY24 revenue ~USD 11.3B. Data localization (RBI 2018, China PIPL 2021) and election-driven budget changes lengthen sales cycles and affect margins. Diversified delivery centers, regional DCs and SEZ/tax planning are mitigation levers.
| Item | Metric/Year | Impact | Mitigation |
|---|---|---|---|
| Revenue concentration | 65% NA/EU | Policy exposure | Nearshore + India |
| FY revenue | USD 11.3B (FY24) | Scale for govt deals | Local partnerships |
| Localization rules | RBI 2018 / PIPL 2021 | Compliance cost | Regional DCs |
| Infrastructure pipeline | ₹111 lakh crore (2019–25) | Opportunity | PPP focus |
What is included in the product
 Detailed Word Document
Explores how macro-environmental factors uniquely affect Wipro across Political, Economic, Social, Technological, Environmental, and Legal dimensions, with data-backed trends and region/industry relevance. Designed for executives, consultants, and investors, it delivers actionable, forward-looking insights and ready-to-use formatting for strategy and reporting.

 Customizable Excel Spreadsheet
Concise, visually segmented Wipro PESTLE summary for quick referencing in meetings or presentations, easily shared and dropped into PowerPoints to streamline external risk discussions and align cross-functional teams.
Economic factors

Global GDP cycles and IT spend elasticity
Enterprise tech budgets expand in GDP upcycles and tighten in slowdowns; IMF projected global growth near 3% in 2024 and industry estimates put global IT spend around the 5 trillion dollar range in 2024. Discretionary digital programs show the highest elasticity, while run-the-business services remain steadier. Wipro’s larger managed-services base gives revenue resilience, while transformation wins drive upside; counter-cyclical offerings and cost-takeout programs help defend revenues.
Currency volatility and margin management
Wipro generates the bulk of revenue from North America and Europe (roughly 60% and 22% respectively), while a significant portion of costs remains in INR and other local currencies, making FX swings a direct driver of operating margins and deal pricing. Management uses hedging programs and onshore-offshore delivery mix to protect margins, and transparent FX pass-through clauses in contracts help stabilize deal economics amid currency volatility.

Wage inflation and talent supply-demand
Tight tech labor markets have driven wage inflation, with Indian IT industry attrition averaging around 20–25% in 2023–24, raising compensation and churn risk for Wipro. Competition from global peers and product tech firms intensifies pressure on wages and hiring velocity. Wipro offsets cost pressure through automation and pyramid optimization, while strategic reskilling programs reduce reliance on higher-cost lateral hires.

Client consolidation and vendor rationalization
Enterprises are actively shrinking vendor lists to capture scale benefits, with industry surveys in 2024 showing increased consolidation toward a few strategic suppliers; larger outcome-based deals now favor players with end-to-end capabilities, pressuring Wipro to evidence domain depth and robust platform partnerships to qualify.
Wipro's win rates improve where strong governance and value-tracking frameworks are demonstrated, aligning with buyer demand for measurable outcomes and contract-level KPIs.
- trend: vendor consolidation rising in 2024
- requirement: outcome-based, end-to-end offerings
- priority: demonstrate domain depth + platform alliances
- enabler: governance, value tracking → higher win rates
M&A environment and investment capacity
Higher interest rates (US Fed funds 5.25–5.50% in 2024–25) and tighter valuations constrain deal financing but also create selective buying opportunities; Wipro’s $1.45bn Capco acquisition (2021) exemplifies using M&A to scale vertical capabilities in cloud, data and cybersecurity.
Success hinges on integration quality to realize synergies and on a disciplined pipeline with standardized post-merger playbooks to protect returns.
- Interest rates: US Fed 5.25–5.50% (2024–25)
- Notable deal: Wipro acquired Capco for $1.45bn
- Focus: cloud, data, cybersecurity
- Priority: integration + playbooks
NA/EU policy risk imperils IT exporter with 65% revenue exposure
Global GDP ~3% (IMF 2024) with global IT spend ≈ $5T drives cyclical enterprise tech budgets; Wipro's managed-services mix cushions downturns while transformation wins add upside. Revenue mix: North America ~60%, Europe ~22%; FX, hedging and onshore-offshore mix shape margins. Attrition 20–25% (2023–24) raises wage pressure; automation, reskilling and pyramid optimization mitigate costs. Higher rates (Fed 5.25–5.50%) tighten financing but enable selective M&A (Capco $1.45bn).
| Metric | Value |
|---|---|
| Global GDP (2024) | ~3% |
| Global IT spend (2024) | $5T |
| NA revenue | ~60% |
| Attrition (2023–24) | 20–25% |
| Fed funds (2024–25) | 5.25–5.50% |
| Notable M&A | Capco $1.45bn |
What You See Is What You Get
Wipro PESTLE Analysis
The preview shown here is the exact Wipro PESTLE Analysis you’ll receive after purchase—fully formatted and ready to use. The content, layout, and insights visible are the final file delivered upon payment. No placeholders or surprises—this is the real, professionally structured report.

Product Information
Product Information
Shipping & Returns
Shipping & Returns
Description
Your Shortcut to Market Insight Starts Here
Unlock how political shifts, economic trends, and tech disruption shape Wipro’s strategy with our concise PESTLE snapshot. This analysis highlights regulatory risks, market opportunities, and sustainability pressures you need to know. Ideal for investors and strategists building forecasts or deals. Purchase the full PESTLE to get detailed, actionable insights and ready-to-use charts.
Political factors
Geopolitical risk across client markets
Operating across the US, Europe and APAC exposes Wipro—which derives roughly 65% of revenue from North America and Europe—to policy swings, trade tensions and sanctions; shifts in US visa norms or EU procurement rules can disrupt on-site delivery. Geopolitical instability has lengthened sales cycles and delayed projects in recent years. Proactive country-risk monitoring and diversified delivery centers across India, Latin America and Eastern Europe mitigate shocks.
Government IT spending and digital agendas
National digital transformation programs like India’s Digital India (launched 2015) create large public-sector opportunities that align with Wipro’s services; Wipro reported FY24 revenue of about $11.5B, underlining its scale to pursue multi-year deals prioritizing cybersecurity, cloud and citizen services. Budget cycles and election outcomes frequently shift timing and scope, so building local partnerships and strict compliance is essential to win government tenders.
Incentives for technology and export services
Policies in India and key hubs—tax incentives, SEZ benefits, and enhanced R&D credits—support export-led IT margins; Wipro reported ~USD 11.3bn revenue in FY24, benefiting from such regimes. Sunset clauses or policy shifts can raise effective tax rates and compress margins quickly. Active industry advocacy and footprint optimization across SEZs and low-tax jurisdictions help preserve and extend cost advantages.
Data localization and sovereignty policies
Many countries mandate local storage and processing of sensitive data—notably RBI's 2018 payments data localization directive and China’s PIPL (2021)—which shapes Wipro’s cloud architectures and partner selection. Non-compliance risks contract losses in regulated banking, healthcare and public sectors. Investing in regional data centers and certified compliance frameworks is critical to retain clients and revenue.
- RBI 2018: payments data localization
- PIPL 2021: strict cross‑border controls
- Focus: regional DCs + compliance certifications
Public-private partnerships and critical infrastructure
Modernization of healthcare, utilities and transport increasingly relies on public-private partnerships, where Wipro can provide platforms, systems integration and managed services to enable digital transformation; India's National Infrastructure Pipeline is valued at ₹111 lakh crore (≈US$1.4 trillion) for 2019–25, highlighting scale tied to political priorities; sovereign projects demand clear risk-sharing and robust SLAs.
- Pipeline scale: ₹111 lakh crore (≈US$1.4T) 2019–25
- Wipro roles: platforms, integration, managed services
- Political priority: determines project pipeline strength
- Contract design: risk-sharing and strict SLAs essential
NA/EU policy risk imperils IT exporter with 65% revenue exposure
Wipro faces policy risk from trade, visa and procurement shifts across US/EU where ~65% of revenue comes; FY24 revenue ~USD 11.3B. Data localization (RBI 2018, China PIPL 2021) and election-driven budget changes lengthen sales cycles and affect margins. Diversified delivery centers, regional DCs and SEZ/tax planning are mitigation levers.
| Item | Metric/Year | Impact | Mitigation |
|---|---|---|---|
| Revenue concentration | 65% NA/EU | Policy exposure | Nearshore + India |
| FY revenue | USD 11.3B (FY24) | Scale for govt deals | Local partnerships |
| Localization rules | RBI 2018 / PIPL 2021 | Compliance cost | Regional DCs |
| Infrastructure pipeline | ₹111 lakh crore (2019–25) | Opportunity | PPP focus |
What is included in the product
Detailed Word Document
Explores how macro-environmental factors uniquely affect Wipro across Political, Economic, Social, Technological, Environmental, and Legal dimensions, with data-backed trends and region/industry relevance. Designed for executives, consultants, and investors, it delivers actionable, forward-looking insights and ready-to-use formatting for strategy and reporting.
Customizable Excel Spreadsheet
Concise, visually segmented Wipro PESTLE summary for quick referencing in meetings or presentations, easily shared and dropped into PowerPoints to streamline external risk discussions and align cross-functional teams.
Economic factors
Global GDP cycles and IT spend elasticity
Enterprise tech budgets expand in GDP upcycles and tighten in slowdowns; IMF projected global growth near 3% in 2024 and industry estimates put global IT spend around the 5 trillion dollar range in 2024. Discretionary digital programs show the highest elasticity, while run-the-business services remain steadier. Wipro’s larger managed-services base gives revenue resilience, while transformation wins drive upside; counter-cyclical offerings and cost-takeout programs help defend revenues.
Currency volatility and margin management
Wipro generates the bulk of revenue from North America and Europe (roughly 60% and 22% respectively), while a significant portion of costs remains in INR and other local currencies, making FX swings a direct driver of operating margins and deal pricing. Management uses hedging programs and onshore-offshore delivery mix to protect margins, and transparent FX pass-through clauses in contracts help stabilize deal economics amid currency volatility.
Wage inflation and talent supply-demand
Tight tech labor markets have driven wage inflation, with Indian IT industry attrition averaging around 20–25% in 2023–24, raising compensation and churn risk for Wipro. Competition from global peers and product tech firms intensifies pressure on wages and hiring velocity. Wipro offsets cost pressure through automation and pyramid optimization, while strategic reskilling programs reduce reliance on higher-cost lateral hires.
Client consolidation and vendor rationalization
Enterprises are actively shrinking vendor lists to capture scale benefits, with industry surveys in 2024 showing increased consolidation toward a few strategic suppliers; larger outcome-based deals now favor players with end-to-end capabilities, pressuring Wipro to evidence domain depth and robust platform partnerships to qualify.
Wipro's win rates improve where strong governance and value-tracking frameworks are demonstrated, aligning with buyer demand for measurable outcomes and contract-level KPIs.
- trend: vendor consolidation rising in 2024
- requirement: outcome-based, end-to-end offerings
- priority: demonstrate domain depth + platform alliances
- enabler: governance, value tracking → higher win rates
M&A environment and investment capacity
Higher interest rates (US Fed funds 5.25–5.50% in 2024–25) and tighter valuations constrain deal financing but also create selective buying opportunities; Wipro’s $1.45bn Capco acquisition (2021) exemplifies using M&A to scale vertical capabilities in cloud, data and cybersecurity.
Success hinges on integration quality to realize synergies and on a disciplined pipeline with standardized post-merger playbooks to protect returns.
- Interest rates: US Fed 5.25–5.50% (2024–25)
- Notable deal: Wipro acquired Capco for $1.45bn
- Focus: cloud, data, cybersecurity
- Priority: integration + playbooks
NA/EU policy risk imperils IT exporter with 65% revenue exposure
Global GDP ~3% (IMF 2024) with global IT spend ≈ $5T drives cyclical enterprise tech budgets; Wipro's managed-services mix cushions downturns while transformation wins add upside. Revenue mix: North America ~60%, Europe ~22%; FX, hedging and onshore-offshore mix shape margins. Attrition 20–25% (2023–24) raises wage pressure; automation, reskilling and pyramid optimization mitigate costs. Higher rates (Fed 5.25–5.50%) tighten financing but enable selective M&A (Capco $1.45bn).
| Metric | Value |
|---|---|
| Global GDP (2024) | ~3% |
| Global IT spend (2024) | $5T |
| NA revenue | ~60% |
| Attrition (2023–24) | 20–25% |
| Fed funds (2024–25) | 5.25–5.50% |
| Notable M&A | Capco $1.45bn |
What You See Is What You Get
Wipro PESTLE Analysis
The preview shown here is the exact Wipro PESTLE Analysis you’ll receive after purchase—fully formatted and ready to use. The content, layout, and insights visible are the final file delivered upon payment. No placeholders or surprises—this is the real, professionally structured report.











