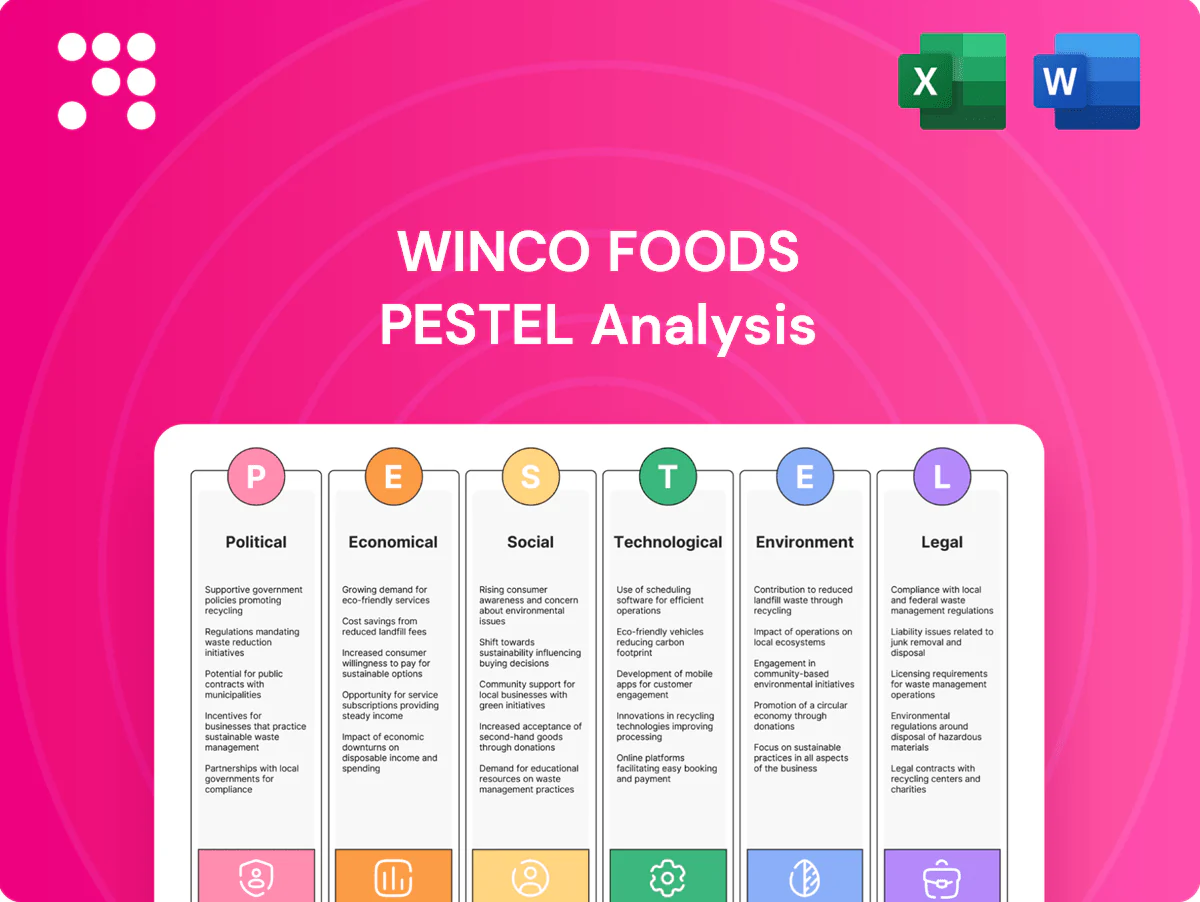
WinCo Foods PESTLE Analysis

Skip the Research. Get the Strategy.
Discover how political, economic, social, technological, legal and environmental forces are reshaping WinCo Foods’ competitive outlook and margins. This concise PESTLE snapshot highlights regulatory risks, supply-chain pressures and shifting consumer trends you need to know. Buy the full analysis for a detailed, actionable briefing you can use today.
Political factors

Food assistance policy (SNAP/WIC) dependence
Changes to SNAP/WIC eligibility, benefit levels or retailer rules directly affect traffic and basket sizes at value grocers given SNAP reaches over 40 million Americans and WIC serves about 6 million (2024). WinCo’s low‑price, bulk model appeals to cost‑conscious, SNAP households, magnifying sensitivity. Modernizations—expanded online redemption and updated approved‑item lists—can shift share toward retailers with e‑commerce capability. Active advocacy and rapid compliance adaptation reduce downside risk.
Trade policy and agricultural tariffs
Tariffs such as US Section 301 measures (up to 25%) and country-specific agricultural duties can raise landed costs and squeeze grocery gross margins by several hundred basis points; WinCo’s EDLP model limits pass-through pricing. Diversifying suppliers and locking multiyear contracts hedge volatility, while active monitoring of USMCA developments, China tariffs and seasonal produce quota changes is essential.

State and local governance on zoning and permits
Warehouse-format WinCo stores need footprints often 50,000–140,000 sq ft and parking typically 4–5 spaces per 1,000 sq ft, driving site requirements and truck access. Local zoning, permitting and community approvals can take 3–12+ months and delay openings. State/local incentives—commonly tens of thousands per job in 2024—can offset development costs. Traffic and small-business opposition can trigger costly studies and legal hurdles.

Labor and workforce policy direction
Federal minimum wage remains $7.25 (since 2009) while dozens of states and localities have raised floors or added scheduling/paid-leave rules through 2024–25, shifting labor cost variability for retailers.
As an employee-owned chain, WinCo must balance competitive hourly pay with ESOP-driven profit-sharing; policy-driven wage hikes or paid-leave mandates compress margins and reduce bonus pool capacity.
Proactive engagement with state legislators helps WinCo align regulations with employee-owner economics and preserve distributable profits.
- policy: federal $7.25; many state/local increases through 2024–25
- structure: ESOP profit pools sensitive to labor-cost changes
- impact: higher wages/leave reduce bonus distributions
- response: active policymaker engagement to protect employee-owner outcomes
Transportation and infrastructure investment
Public investment under the Bipartisan Infrastructure Law (1.2 trillion USD, including about 110 billion USD for roads and bridges) directly affects WinCo Foods logistics costs and reliability; trucks still move roughly 72% of US freight by tonnage, so highway quality and cold-chain expansion matter for spoilage and lead times. Congestion and rail bottlenecks raise dwell times and spoilage risk, while efficient intermodal nodes amplify WinCo’s high-volume DC throughput; infrastructure grants or disruptions can materially change DC productivity and operating margins.
- Highways/bridges: 110B USD impact on trucking reliability
- Modal risk: trucks ~72% of freight by tonnage, congestion raises spoilage risk
- DC productivity: intermodal efficiency and grants can materially alter throughput and costs
SNAP & WIC boost grocery traffic; tariffs, wages, and infrastructure reshape logistics
SNAP >40M & WIC ~6M (2024) drive traffic; online SNAP modernization shifts share to e‑commerce-enabled grocers. Tariffs (Section 301 up to 25%) and ag duties raise landed costs vs WinCo EDLP. State/local wage hikes through 2024–25 compress ESOP bonuses. Bipartisan Infrastructure Law $1.2T (incl. $110B roads) affects trucking reliability.
| Factor | Key data | Impact | Response |
|---|---|---|---|
| Food aid | SNAP>40M; WIC~6M (2024) | Sales sensitivity | Advocacy, e‑redemption |
| Tariffs | Up to 25% Section 301 | Margin pressure | Supplier diversification |
| Labor | State/local hikes 2024–25 | ESOP compression | Policy engagement |
| Infrastructure | $1.2T law; $110B roads | Logistics risk | Route/DC planning |
What is included in the product
 Detailed Word Document
Explores how macro-environmental forces uniquely affect WinCo Foods across Political, Economic, Social, Technological, Environmental, and Legal dimensions, with data-driven examples and trend context; designed to help executives, consultants, and entrepreneurs identify threats and opportunities. Each category offers forward-looking insights and actionable sub-points tailored to WinCo’s regional grocery operations for use in plans, decks, or reports.

 Customizable Excel Spreadsheet
Condensed WinCo Foods PESTLE summary organized by political, economic, social, technological, environmental and legal factors for quick reference in meetings or presentations, editable for regional/context notes and easily dropped into slides or shared across teams to streamline external risk discussions and strategic planning.
Economic factors

Inflation and consumer trade-down
High grocery inflation has pushed households toward EDLP and private label—private-label penetration reached about 18% of US grocery sales in 2023–24 per NielsenIQ, while food-at-home inflation eased to roughly 3% in 2024 (BLS), sustaining trade-down. WinCo’s bulk, low-overhead EDLP model captures that traffic and preserves unit margins. If deflationary turns occur, price competition intensifies and nominal comps shrink. Active mix management is critical to protect margins across cycles.
Fuel and freight cost volatility
U.S. on‑highway diesel averaged about $4.03/gal in 2024 (EIA), directly shaping WinCo inbound/outbound economics for heavy and refrigerated loads. Fuel surcharges routinely cascade into supplier pricing, often adding mid-single‑digit percent cost pressure. Strategic regional DC placement and backhaul optimization can trim freight spend by roughly 5–10%. Energy hedging and modal shifts toward rail (up to ~30% lower long‑haul cost per ton‑mile) smooth volatility.

Commodity price swings (meat, grains, dairy)
Protein and grain cycles reshaped WinCo’s basket and margins as 2024–mid‑2025 commodity swings saw corn futures trade roughly $3.80–5.60/bu, live cattle $150–185/cwt and Class III milk $13–22/cwt, pressuring cost of goods sold. Bulk SKUs amplify unit‑cost visibility, raising price elasticity among value shoppers. Forward buys and rhythmic promotions helped manage price perception, while tighter markets rewarded closer supplier partnerships for better allocation.

Labor market tightness and wage pressure
Tight local labor markets push hourly grocery wages and hiring costs higher; U.S. unemployment was near 3.7% in mid‑2025 and average hourly earnings rose ~4.2% y/y (BLS), increasing WinCo's staffing cost pressure. Employee ownership at WinCo improves retention and productivity, partially offsetting wage inflation. Cross‑training and role cross‑utilization sustain service levels when staffing is lean; economic slowdowns typically reduce turnover and normalize costs.
- Higher hourly costs: +4.2% y/y avg earnings (mid‑2025)
- Labor tightness: U.S. unemployment ~3.7% (mid‑2025)
- Offset: employee ownership boosts retention/productivity
- Mitigation: training/cross‑utilization; downturns lower turnover
Interest rates and capital deployment
SNAP & WIC boost grocery traffic; tariffs, wages, and infrastructure reshape logistics
High grocery inflation and 18% private‑label penetration (NielsenIQ 2023–24) sustain EDLP demand; food‑at‑home inflation eased to ~3% in 2024 (BLS), keeping trade‑down.
Diesel ~ $4.03/gal (2024, EIA) and commodity swings (corn $3.80–5.60/bu) raise COGS; logistics optimization saves ~5–10%.
Unemployment ~3.7% and avg earnings +4.2% y/y (mid‑2025) press wages; Fed funds ~5.25–5.50% (Jul 2025) tightens capex.
| Metric | Value |
|---|---|
| Private label | ~18% |
| Food‑at‑home inflation | ~3% (2024) |
| Diesel | $4.03/gal (2024) |
| Unemployment | ~3.7% (mid‑2025) |
| Avg earnings | +4.2% y/y |
| Fed funds | 5.25–5.50% (Jul 2025) |
Preview Before You Purchase
WinCo Foods PESTLE Analysis
The preview shown here is the exact WinCo Foods PESTLE Analysis document you’ll receive after purchase—fully formatted and ready to use. The content, structure, and layout in this preview are identical to the downloadable file. No placeholders or teasers—this is the final, professional report.

Original: $10.00
-65%$10.00
$3.50Product Information
Product Information
Shipping & Returns
Shipping & Returns
Description
Skip the Research. Get the Strategy.
Discover how political, economic, social, technological, legal and environmental forces are reshaping WinCo Foods’ competitive outlook and margins. This concise PESTLE snapshot highlights regulatory risks, supply-chain pressures and shifting consumer trends you need to know. Buy the full analysis for a detailed, actionable briefing you can use today.
Political factors
Food assistance policy (SNAP/WIC) dependence
Changes to SNAP/WIC eligibility, benefit levels or retailer rules directly affect traffic and basket sizes at value grocers given SNAP reaches over 40 million Americans and WIC serves about 6 million (2024). WinCo’s low‑price, bulk model appeals to cost‑conscious, SNAP households, magnifying sensitivity. Modernizations—expanded online redemption and updated approved‑item lists—can shift share toward retailers with e‑commerce capability. Active advocacy and rapid compliance adaptation reduce downside risk.
Trade policy and agricultural tariffs
Tariffs such as US Section 301 measures (up to 25%) and country-specific agricultural duties can raise landed costs and squeeze grocery gross margins by several hundred basis points; WinCo’s EDLP model limits pass-through pricing. Diversifying suppliers and locking multiyear contracts hedge volatility, while active monitoring of USMCA developments, China tariffs and seasonal produce quota changes is essential.
State and local governance on zoning and permits
Warehouse-format WinCo stores need footprints often 50,000–140,000 sq ft and parking typically 4–5 spaces per 1,000 sq ft, driving site requirements and truck access. Local zoning, permitting and community approvals can take 3–12+ months and delay openings. State/local incentives—commonly tens of thousands per job in 2024—can offset development costs. Traffic and small-business opposition can trigger costly studies and legal hurdles.
Labor and workforce policy direction
Federal minimum wage remains $7.25 (since 2009) while dozens of states and localities have raised floors or added scheduling/paid-leave rules through 2024–25, shifting labor cost variability for retailers.
As an employee-owned chain, WinCo must balance competitive hourly pay with ESOP-driven profit-sharing; policy-driven wage hikes or paid-leave mandates compress margins and reduce bonus pool capacity.
Proactive engagement with state legislators helps WinCo align regulations with employee-owner economics and preserve distributable profits.
- policy: federal $7.25; many state/local increases through 2024–25
- structure: ESOP profit pools sensitive to labor-cost changes
- impact: higher wages/leave reduce bonus distributions
- response: active policymaker engagement to protect employee-owner outcomes
Transportation and infrastructure investment
Public investment under the Bipartisan Infrastructure Law (1.2 trillion USD, including about 110 billion USD for roads and bridges) directly affects WinCo Foods logistics costs and reliability; trucks still move roughly 72% of US freight by tonnage, so highway quality and cold-chain expansion matter for spoilage and lead times. Congestion and rail bottlenecks raise dwell times and spoilage risk, while efficient intermodal nodes amplify WinCo’s high-volume DC throughput; infrastructure grants or disruptions can materially change DC productivity and operating margins.
- Highways/bridges: 110B USD impact on trucking reliability
- Modal risk: trucks ~72% of freight by tonnage, congestion raises spoilage risk
- DC productivity: intermodal efficiency and grants can materially alter throughput and costs
SNAP & WIC boost grocery traffic; tariffs, wages, and infrastructure reshape logistics
SNAP >40M & WIC ~6M (2024) drive traffic; online SNAP modernization shifts share to e‑commerce-enabled grocers. Tariffs (Section 301 up to 25%) and ag duties raise landed costs vs WinCo EDLP. State/local wage hikes through 2024–25 compress ESOP bonuses. Bipartisan Infrastructure Law $1.2T (incl. $110B roads) affects trucking reliability.
| Factor | Key data | Impact | Response |
|---|---|---|---|
| Food aid | SNAP>40M; WIC~6M (2024) | Sales sensitivity | Advocacy, e‑redemption |
| Tariffs | Up to 25% Section 301 | Margin pressure | Supplier diversification |
| Labor | State/local hikes 2024–25 | ESOP compression | Policy engagement |
| Infrastructure | $1.2T law; $110B roads | Logistics risk | Route/DC planning |
What is included in the product
Detailed Word Document
Explores how macro-environmental forces uniquely affect WinCo Foods across Political, Economic, Social, Technological, Environmental, and Legal dimensions, with data-driven examples and trend context; designed to help executives, consultants, and entrepreneurs identify threats and opportunities. Each category offers forward-looking insights and actionable sub-points tailored to WinCo’s regional grocery operations for use in plans, decks, or reports.
Customizable Excel Spreadsheet
Condensed WinCo Foods PESTLE summary organized by political, economic, social, technological, environmental and legal factors for quick reference in meetings or presentations, editable for regional/context notes and easily dropped into slides or shared across teams to streamline external risk discussions and strategic planning.
Economic factors
Inflation and consumer trade-down
High grocery inflation has pushed households toward EDLP and private label—private-label penetration reached about 18% of US grocery sales in 2023–24 per NielsenIQ, while food-at-home inflation eased to roughly 3% in 2024 (BLS), sustaining trade-down. WinCo’s bulk, low-overhead EDLP model captures that traffic and preserves unit margins. If deflationary turns occur, price competition intensifies and nominal comps shrink. Active mix management is critical to protect margins across cycles.
Fuel and freight cost volatility
U.S. on‑highway diesel averaged about $4.03/gal in 2024 (EIA), directly shaping WinCo inbound/outbound economics for heavy and refrigerated loads. Fuel surcharges routinely cascade into supplier pricing, often adding mid-single‑digit percent cost pressure. Strategic regional DC placement and backhaul optimization can trim freight spend by roughly 5–10%. Energy hedging and modal shifts toward rail (up to ~30% lower long‑haul cost per ton‑mile) smooth volatility.
Commodity price swings (meat, grains, dairy)
Protein and grain cycles reshaped WinCo’s basket and margins as 2024–mid‑2025 commodity swings saw corn futures trade roughly $3.80–5.60/bu, live cattle $150–185/cwt and Class III milk $13–22/cwt, pressuring cost of goods sold. Bulk SKUs amplify unit‑cost visibility, raising price elasticity among value shoppers. Forward buys and rhythmic promotions helped manage price perception, while tighter markets rewarded closer supplier partnerships for better allocation.
Labor market tightness and wage pressure
Tight local labor markets push hourly grocery wages and hiring costs higher; U.S. unemployment was near 3.7% in mid‑2025 and average hourly earnings rose ~4.2% y/y (BLS), increasing WinCo's staffing cost pressure. Employee ownership at WinCo improves retention and productivity, partially offsetting wage inflation. Cross‑training and role cross‑utilization sustain service levels when staffing is lean; economic slowdowns typically reduce turnover and normalize costs.
- Higher hourly costs: +4.2% y/y avg earnings (mid‑2025)
- Labor tightness: U.S. unemployment ~3.7% (mid‑2025)
- Offset: employee ownership boosts retention/productivity
- Mitigation: training/cross‑utilization; downturns lower turnover
Interest rates and capital deployment
SNAP & WIC boost grocery traffic; tariffs, wages, and infrastructure reshape logistics
High grocery inflation and 18% private‑label penetration (NielsenIQ 2023–24) sustain EDLP demand; food‑at‑home inflation eased to ~3% in 2024 (BLS), keeping trade‑down.
Diesel ~ $4.03/gal (2024, EIA) and commodity swings (corn $3.80–5.60/bu) raise COGS; logistics optimization saves ~5–10%.
Unemployment ~3.7% and avg earnings +4.2% y/y (mid‑2025) press wages; Fed funds ~5.25–5.50% (Jul 2025) tightens capex.
| Metric | Value |
|---|---|
| Private label | ~18% |
| Food‑at‑home inflation | ~3% (2024) |
| Diesel | $4.03/gal (2024) |
| Unemployment | ~3.7% (mid‑2025) |
| Avg earnings | +4.2% y/y |
| Fed funds | 5.25–5.50% (Jul 2025) |
Preview Before You Purchase
WinCo Foods PESTLE Analysis
The preview shown here is the exact WinCo Foods PESTLE Analysis document you’ll receive after purchase—fully formatted and ready to use. The content, structure, and layout in this preview are identical to the downloadable file. No placeholders or teasers—this is the final, professional report.











