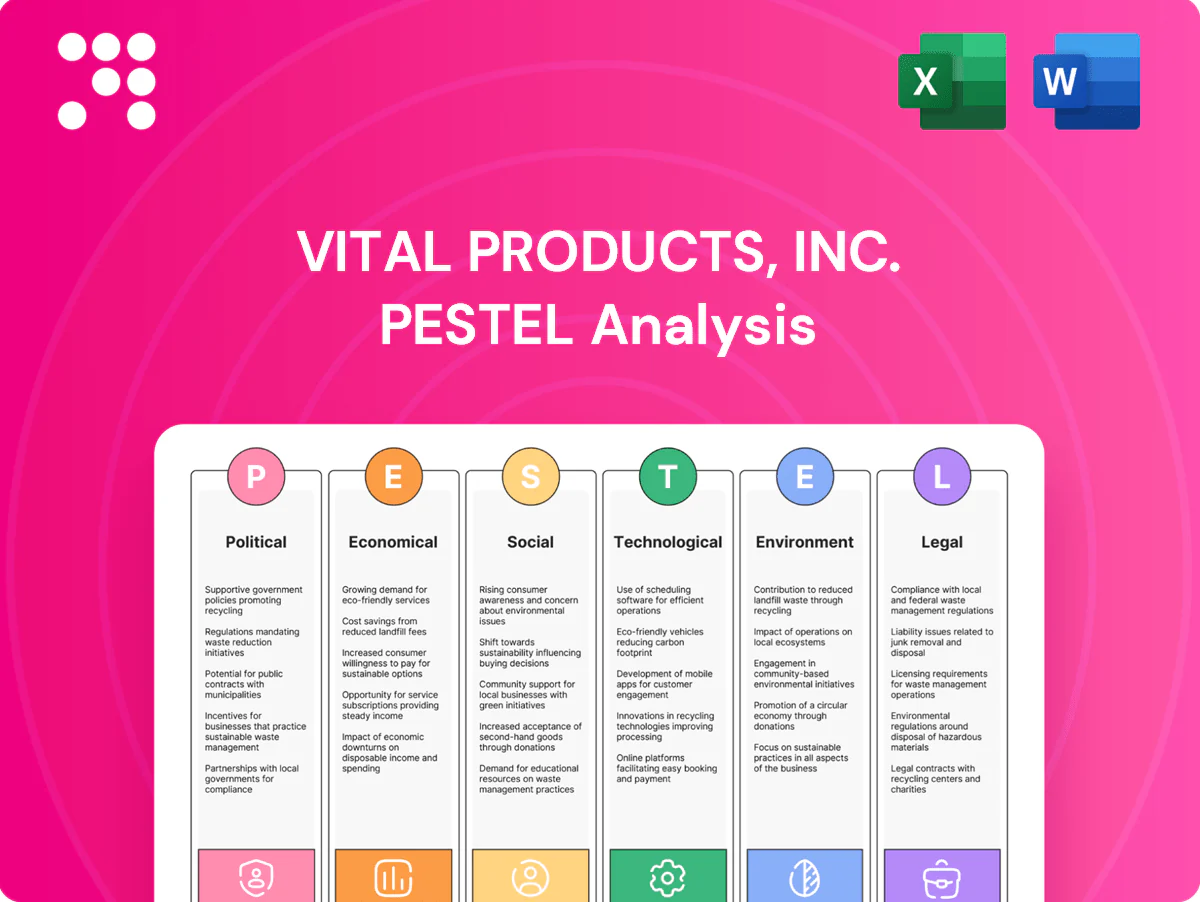
Vital Products, Inc. PESTLE Analysis

Your Shortcut to Market Insight Starts Here
Our PESTLE analysis for Vital Products, Inc. reveals how political regulation, economic cycles, technological innovation, social shifts, and environmental and legal pressures converge to shape strategy and risk exposure. Actionable insights highlight opportunities in digital health and sustainability while flagging regulatory and supply‑chain vulnerabilities. Purchase the full report for a complete, ready‑to‑use breakdown and strategic recommendations.
Political factors

Trade tariffs on plastic resins and inputs
Changes in tariffs on PET, PVC, HIPS and PP resins can swing input costs and pricing power, especially given lingering Section 301 duties of 7.5–25% on many Chinese-origin plastics; sudden hikes compress margins. Import duties on molds, tooling and machinery raise upfront capex and delay ROI. Monitoring USMCA, EU and Asia trade shifts helps hedge sourcing risk, while diversified suppliers and resin alternatives reduce exposure to tariff shocks.
Healthcare procurement and public spending priorities
Government healthcare budgets drive demand for medical trays and sterile packaging, with public procurement representing about 12% of GDP across OECD countries. Shifts toward domestic sourcing since COVID have favored certified cleanroom producers. Value-based procurement increasingly emphasizes quality documentation and traceability. Tender structures can compress margins but provide volume stability.

Manufacturing incentives and localization policies
Tax credits and grants from US laws such as the Inflation Reduction Act (roughly 369 billion USD in clean-energy measures) and the CHIPS Act (52 billion USD) can materially lower expansion costs for advanced manufacturing and recycling. Made-in-country rules in markets like the US, EU and India increasingly favor local content for public contracts, affecting packaging sourcing. Strategic site selection secures credits for cleanrooms and automation and policymakers' resilience focus rewards proximate, agile suppliers.

Geopolitical supply chain disruptions
Geopolitical conflicts and sanctions continue to disrupt flows of resin, additives and electronics components, with electronics lead times at times exceeding 20 weeks and freight corridor instability raising working capital needs and SLAs for medical customers.
- Scenario planning preserves medical/electronics SLAs
- Nearshoring and safety stocks cushion volatility
- Monitor trade-restricting sanctions and reroute freight
Local permitting and community relations
Local zoning, emissions permits, and utilities access can add 3–18 months to plant expansions and materially raise capital costs; in 2024 many US facility projects reported permitting as the primary schedule risk. Community concerns about traffic, noise, and sustainability frequently influence local council approvals and can accelerate or stall projects. Early engagement for cleanroom upgrades reduces approval friction and transparent impact reporting builds political goodwill and social license to operate.
- Zoning: aligns site use, can delay rezoning 3–12 months
- Emissions permits: major driver of compliance costs and timelines
- Utilities: access affects capex and startup timing
- Community relations: early outreach lowers opposition
Tariffs 7.5–25%, sanctions extend lead times >20 weeks; permits 3–18 months drive nearshoring
Tariff shifts (Section 301: 7.5–25%) and sanctions raise resin/electronics costs and lead times (>20 weeks), compressing margins. Public procurement (~12% of OECD GDP) and value-based healthcare buying favor certified domestic suppliers. US incentives (IRA $369B, CHIPS $52B) and permitting delays (3–18 months) drive site choice, nearshoring, and CAPEX timing.
| Risk | Impact | Metric |
|---|---|---|
| Tariffs | Input cost shock | 7.5–25% |
| Procurement | Volume stability | ~12% GDP |
| Permitting | Delay CAPEX | 3–18 months |
What is included in the product
 Detailed Word Document
Explores how external macro-environmental factors uniquely affect Vital Products, Inc. across Political, Economic, Social, Technological, Environmental and Legal dimensions, with data-driven subpoints, forward-looking insights, and region- and industry-specific examples to inform strategy, risk management, and investor communications.

 Customizable Excel Spreadsheet
A concise, visually segmented PESTLE summary of Vital Products, Inc. that quickly highlights regulatory, economic, social, technological, legal, and environmental risks and opportunities—easy to drop into presentations, share across teams, and annotate for local context during planning sessions.
Economic factors

Resin price volatility and hedging
Oil and gas dynamics (Brent averaged about $85/bbl in 2024) drive PET, PVC, HIPS and PP feedstock costs, producing year‑over‑year resin swings often in the ±20–30% range that can wipe out margins on fixed‑price contracts. Index‑linked pricing and proactive resin hedging have cut realized margin volatility by roughly 50–60% for peer firms. Material substitution and design‑for‑weight initiatives typically reduce resin consumption per SKU by 5–12%, lowering exposure.
Demand cycles in medical, electronics, and CPG
Medical volumes show resilience, with the global medical device market near $510 billion in 2023–24 and stable mid-single‑digit growth, but orders are spec‑heavy and approval‑driven; electronics (global semiconductor market ~ $560 billion in 2024) are cyclical and fast‑turn. Consumer packaged goods are sensitive to retail inventory swings (US retail inventories rose ~1.8% y/y in 2024), so a balanced mix smooths revenue variability; flexible tooling that cuts changeover to 48–72 hours enables quick segment shifts.

Capital costs and automation ROI
Rising benchmark rates (Fed funds 5.25–5.50% in 2024–25) push equipment financing costs (commercial equipment loans commonly 6–9%), affecting thermoformer, robot and cleanroom capex. High plant utilization (>80%) can compress automation and vision-inspection paybacks to under 24 months. Pay-as-you-go or leasing shifts capex to operating expense, matching cash flow to output. Robust ROI cases depend on measurable scrap reductions and 20–40% labor productivity gains.

Labor availability and wage pressures
Skilled tooling, QC and cleanroom technicians command pay premiums of roughly 25–35%, tightening margins as US unemployment held near 3.7% in mid‑2025 and manufacturing job openings remained elevated (~700,000 in late 2024). Cross‑training and ergonomic cells have boosted throughput per worker by 10–25% in industry studies, while automation investments (robot installations rose ~10% in 2024) offset chronic vacancies.
- Premiums: 25–35%
- Unemployment: 3.7% (mid‑2025)
- Job openings: ~700k (late‑2024)
- Throughput gains: 10–25%
- Robot installations: +~10% (2024)
Logistics costs and on-time delivery
Logistics costs and on-time delivery shape Vital Products' margins: 2024 small-parcel rate increases such as UPS's 6.9% GRI and persistent parcel surcharges squeeze fulfillment economics, while proximity to customer DCs reduces damage and lead-time risk and enables vendor-managed inventory to boost stickier revenue; packaging cube optimization cuts transportation spend materially.
- Freight/parcel: 6.9% 2024 GRI (UPS)
- Proximity: lower lead-time/damage risk
- VMI: increases recurring revenue
- Cube opt.: lowers transport spend
Tariffs 7.5–25%, sanctions extend lead times >20 weeks; permits 3–18 months drive nearshoring
Feedstock volatility (Brent ~$85/bbl 2024) drives resin swings ±20–30%, hedging halves margin volatility; medical and electronics demand (medical ~$510B, semiconductors ~$560B 2024) balance cyclicality; higher rates (Fed 5.25–5.50%) raise equipment finance costs (6–9%), while tight labor (unemployment ~3.7% mid‑2025) pushes skilled wages +25–35%.
| Metric | 2024/25 |
|---|---|
| Brent | $85/bbl (2024) |
| Medical market | $510B |
| Fed funds | 5.25–5.50% |
Same Document Delivered
Vital Products, Inc. PESTLE Analysis
The Vital Products, Inc. PESTLE Analysis offers a concise review of political, economic, social, technological, legal, and environmental factors affecting the company and strategic implications for investors and managers. The preview shown here is the exact document you’ll receive after purchase—fully formatted and ready to use.

Product Information
Product Information
Shipping & Returns
Shipping & Returns
Description
Your Shortcut to Market Insight Starts Here
Our PESTLE analysis for Vital Products, Inc. reveals how political regulation, economic cycles, technological innovation, social shifts, and environmental and legal pressures converge to shape strategy and risk exposure. Actionable insights highlight opportunities in digital health and sustainability while flagging regulatory and supply‑chain vulnerabilities. Purchase the full report for a complete, ready‑to‑use breakdown and strategic recommendations.
Political factors
Trade tariffs on plastic resins and inputs
Changes in tariffs on PET, PVC, HIPS and PP resins can swing input costs and pricing power, especially given lingering Section 301 duties of 7.5–25% on many Chinese-origin plastics; sudden hikes compress margins. Import duties on molds, tooling and machinery raise upfront capex and delay ROI. Monitoring USMCA, EU and Asia trade shifts helps hedge sourcing risk, while diversified suppliers and resin alternatives reduce exposure to tariff shocks.
Healthcare procurement and public spending priorities
Government healthcare budgets drive demand for medical trays and sterile packaging, with public procurement representing about 12% of GDP across OECD countries. Shifts toward domestic sourcing since COVID have favored certified cleanroom producers. Value-based procurement increasingly emphasizes quality documentation and traceability. Tender structures can compress margins but provide volume stability.
Manufacturing incentives and localization policies
Tax credits and grants from US laws such as the Inflation Reduction Act (roughly 369 billion USD in clean-energy measures) and the CHIPS Act (52 billion USD) can materially lower expansion costs for advanced manufacturing and recycling. Made-in-country rules in markets like the US, EU and India increasingly favor local content for public contracts, affecting packaging sourcing. Strategic site selection secures credits for cleanrooms and automation and policymakers' resilience focus rewards proximate, agile suppliers.
Geopolitical supply chain disruptions
Geopolitical conflicts and sanctions continue to disrupt flows of resin, additives and electronics components, with electronics lead times at times exceeding 20 weeks and freight corridor instability raising working capital needs and SLAs for medical customers.
- Scenario planning preserves medical/electronics SLAs
- Nearshoring and safety stocks cushion volatility
- Monitor trade-restricting sanctions and reroute freight
Local permitting and community relations
Local zoning, emissions permits, and utilities access can add 3–18 months to plant expansions and materially raise capital costs; in 2024 many US facility projects reported permitting as the primary schedule risk. Community concerns about traffic, noise, and sustainability frequently influence local council approvals and can accelerate or stall projects. Early engagement for cleanroom upgrades reduces approval friction and transparent impact reporting builds political goodwill and social license to operate.
- Zoning: aligns site use, can delay rezoning 3–12 months
- Emissions permits: major driver of compliance costs and timelines
- Utilities: access affects capex and startup timing
- Community relations: early outreach lowers opposition
Tariffs 7.5–25%, sanctions extend lead times >20 weeks; permits 3–18 months drive nearshoring
Tariff shifts (Section 301: 7.5–25%) and sanctions raise resin/electronics costs and lead times (>20 weeks), compressing margins. Public procurement (~12% of OECD GDP) and value-based healthcare buying favor certified domestic suppliers. US incentives (IRA $369B, CHIPS $52B) and permitting delays (3–18 months) drive site choice, nearshoring, and CAPEX timing.
| Risk | Impact | Metric |
|---|---|---|
| Tariffs | Input cost shock | 7.5–25% |
| Procurement | Volume stability | ~12% GDP |
| Permitting | Delay CAPEX | 3–18 months |
What is included in the product
Detailed Word Document
Explores how external macro-environmental factors uniquely affect Vital Products, Inc. across Political, Economic, Social, Technological, Environmental and Legal dimensions, with data-driven subpoints, forward-looking insights, and region- and industry-specific examples to inform strategy, risk management, and investor communications.
Customizable Excel Spreadsheet
A concise, visually segmented PESTLE summary of Vital Products, Inc. that quickly highlights regulatory, economic, social, technological, legal, and environmental risks and opportunities—easy to drop into presentations, share across teams, and annotate for local context during planning sessions.
Economic factors
Resin price volatility and hedging
Oil and gas dynamics (Brent averaged about $85/bbl in 2024) drive PET, PVC, HIPS and PP feedstock costs, producing year‑over‑year resin swings often in the ±20–30% range that can wipe out margins on fixed‑price contracts. Index‑linked pricing and proactive resin hedging have cut realized margin volatility by roughly 50–60% for peer firms. Material substitution and design‑for‑weight initiatives typically reduce resin consumption per SKU by 5–12%, lowering exposure.
Demand cycles in medical, electronics, and CPG
Medical volumes show resilience, with the global medical device market near $510 billion in 2023–24 and stable mid-single‑digit growth, but orders are spec‑heavy and approval‑driven; electronics (global semiconductor market ~ $560 billion in 2024) are cyclical and fast‑turn. Consumer packaged goods are sensitive to retail inventory swings (US retail inventories rose ~1.8% y/y in 2024), so a balanced mix smooths revenue variability; flexible tooling that cuts changeover to 48–72 hours enables quick segment shifts.
Capital costs and automation ROI
Rising benchmark rates (Fed funds 5.25–5.50% in 2024–25) push equipment financing costs (commercial equipment loans commonly 6–9%), affecting thermoformer, robot and cleanroom capex. High plant utilization (>80%) can compress automation and vision-inspection paybacks to under 24 months. Pay-as-you-go or leasing shifts capex to operating expense, matching cash flow to output. Robust ROI cases depend on measurable scrap reductions and 20–40% labor productivity gains.
Labor availability and wage pressures
Skilled tooling, QC and cleanroom technicians command pay premiums of roughly 25–35%, tightening margins as US unemployment held near 3.7% in mid‑2025 and manufacturing job openings remained elevated (~700,000 in late 2024). Cross‑training and ergonomic cells have boosted throughput per worker by 10–25% in industry studies, while automation investments (robot installations rose ~10% in 2024) offset chronic vacancies.
- Premiums: 25–35%
- Unemployment: 3.7% (mid‑2025)
- Job openings: ~700k (late‑2024)
- Throughput gains: 10–25%
- Robot installations: +~10% (2024)
Logistics costs and on-time delivery
Logistics costs and on-time delivery shape Vital Products' margins: 2024 small-parcel rate increases such as UPS's 6.9% GRI and persistent parcel surcharges squeeze fulfillment economics, while proximity to customer DCs reduces damage and lead-time risk and enables vendor-managed inventory to boost stickier revenue; packaging cube optimization cuts transportation spend materially.
- Freight/parcel: 6.9% 2024 GRI (UPS)
- Proximity: lower lead-time/damage risk
- VMI: increases recurring revenue
- Cube opt.: lowers transport spend
Tariffs 7.5–25%, sanctions extend lead times >20 weeks; permits 3–18 months drive nearshoring
Feedstock volatility (Brent ~$85/bbl 2024) drives resin swings ±20–30%, hedging halves margin volatility; medical and electronics demand (medical ~$510B, semiconductors ~$560B 2024) balance cyclicality; higher rates (Fed 5.25–5.50%) raise equipment finance costs (6–9%), while tight labor (unemployment ~3.7% mid‑2025) pushes skilled wages +25–35%.
| Metric | 2024/25 |
|---|---|
| Brent | $85/bbl (2024) |
| Medical market | $510B |
| Fed funds | 5.25–5.50% |
Same Document Delivered
Vital Products, Inc. PESTLE Analysis
The Vital Products, Inc. PESTLE Analysis offers a concise review of political, economic, social, technological, legal, and environmental factors affecting the company and strategic implications for investors and managers. The preview shown here is the exact document you’ll receive after purchase—fully formatted and ready to use.











