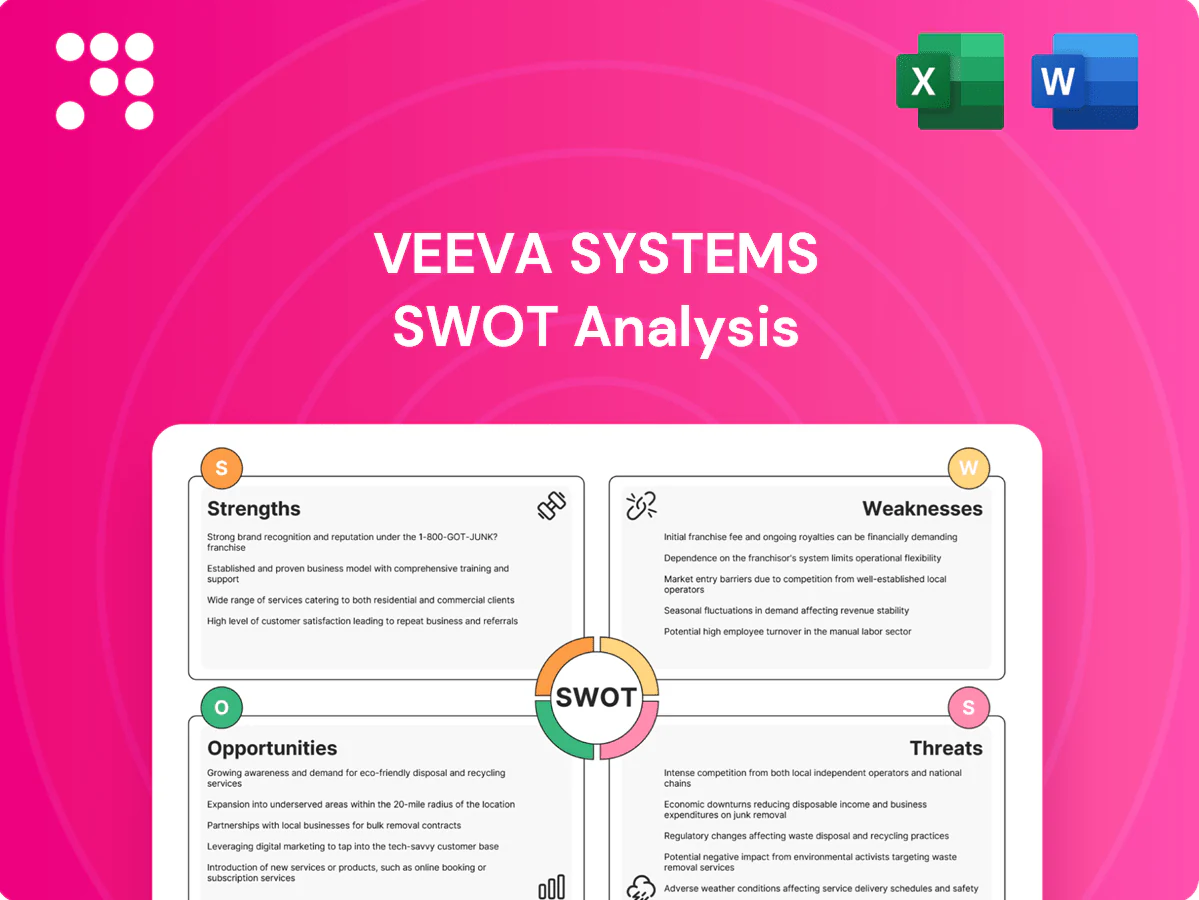
Veeva Systems SWOT Analysis

Make Insightful Decisions Backed by Expert Research
Veeva Systems shows strengths in life‑sciences‑focused SaaS, strong recurring revenue and regulatory expertise, but faces concentration risk and product dependency. Opportunities include AI‑enabled solutions and international expansion, while competition and pricing pressure pose threats. Want the full story behind these dynamics? Purchase the complete SWOT analysis for a professionally formatted Word and Excel report to inform strategy and investment.
Strengths

Vertical life sciences focus
Veeva’s vertical focus on pharma, biotech and medtech drives deep domain fit, with over 90% of revenue coming from life sciences customers. Purpose-built workflows map directly to GxP requirements and FDA/EMA submission pathways, reducing compliance burden. This specialization yields stronger product-market fit than horizontal SaaS and reinforces credibility with regulated buyers.
Broad, integrated platform
Veeva’s integrated suite—CRM, Vault, Data and Clinical—offers end-to-end capabilities that limit vendor sprawl and lower integration cost, supporting its >1,000 life‑sciences customers and driving FY2024 revenue above $2.1B. Connected cross‑module data flow improves decision speed and user productivity, while suite breadth ensures consistent UX and centralized governance across development, commercial and data functions.

High switching costs
Veeva’s embedded validated processes and compliance documentation deter churn, with the company serving 19 of the top 20 global pharma firms, reinforcing sector trust. Data migration in regulated settings is costly and risky, often requiring lengthy revalidation and project teams. User retraining and formal revalidation extend customer lock-in, while common multi-year contracts (typically 3–5 years) reinforce stickiness.

Regulatory and quality expertise
As of 2024 Veeva cloud solutions are engineered for validation, audit trails and strict content controls, supporting regulatory submissions, clinical trials and safety workflows. This pedigree lowers compliance risk for customers and speeds deployment in highly scrutinized environments. Veeva reports broad adoption across global life sciences firms.
- Built for validation, audit trails, content control
- Proven support for submissions, trials, safety
- Reduces compliance risk; accelerates deployment in regulated settings
Blue-chip customer base
Veeva has strong penetration with top global pharmas and growing biotechs, including 23 of the top 25 global pharmaceutical companies. Its large installed base of over 1,200 life‑science customers drives recurring subscription revenue and provides high-quality references. Land‑and‑expand motions have steadily increased ACV and customer lifetime value. Continuous customer feedback directly informs the product roadmap.
- Penetration: 23 of top 25 pharma
- Installed base: >1,200 customers
- Revenue model: recurring subscription/expansion
- Product dev: feedback-driven roadmap
>$2.1B; >90% life-sciences; 23/25
Veeva’s vertical focus yields >90% life‑sciences revenue and purpose‑built GxP workflows that reduce compliance burden. Its integrated suite (CRM, Vault, Data, Clinical) supports >1,200 customers, driving recurring revenue and FY2024 revenue >$2.1B. High trust: 23 of top 25 pharma use Veeva, with common 3–5 year contracts boosting retention.
| Metric | Value |
|---|---|
| FY2024 revenue | > $2.1B |
| Customers | > 1,200 |
| Top pharma penetration | 23/25 |
| Life‑sciences revenue share | > 90% |
| Typical contract length | 3–5 years |
What is included in the product
 Detailed Word Document
Delivers a strategic overview of Veeva Systems’s internal and external business factors, outlining strengths, weaknesses, opportunities, and threats; analyzes competitive position, growth drivers, operational gaps, and market risks shaping its future.

 Customizable Excel Spreadsheet
Provides a concise, Veeva Systems–focused SWOT matrix for fast strategy alignment and executive snapshots, easing cross‑team planning, stakeholder presentations, and quick updates as priorities change.
Weaknesses

Narrow industry concentration
Veeva's revenue remains concentrated in life sciences, with over 90% of sales tied to pharma and biotech customers, making its results closely linked to industry cycles and pharma budget shifts. Exposure to R&D spending volatility and pipeline delays elevates risk versus horizontal SaaS peers, so sector downturns can disproportionately hit growth and ARR expansion.
Dependence on key accounts
A meaningful share of Veeva’s ARR is concentrated in large life-science enterprises, creating exposure when a few strategic customers dominate renewals. Pricing pressure often emerges during renewals with these accounts, driven by customer leverage and expectation of scope concessions. Industry consolidation among pharmas can reduce user seats and contract scale, and loss of any top account would be materially adverse to revenue predictability.

Lengthy sales and validation cycles
Lengthy sales and compliance reviews, driven by FDA/EMA validation requirements, routinely elongate Veeva Systems NYSE: VEEV deal timelines and push implementation start dates into subsequent quarters.
Rigorous validation and change-control processes slow expansions and can defer subscription revenue recognition, complicating quarter-to-quarter comparability in 2024–2025.
These extended cycles make forecasting across global rollouts harder, increasing variance in revenue timing and execution risk.

Migration and platform transition risk
Shifts between core platforms or major product generations expose execution risk for Veeva as customers — including 20 of the top 25 global pharmaceutical companies — resist disruptive change; heavy customer customizations complicate upgrades, while any performance or feature gaps slow adoption and invite competitors to target accounts during transitions.
- Execution risk on migrations
- Customer customizations hinder upgrades
- Performance/feature gaps slow rollout
- Competitors target transitioning accounts
Talent and domain scarcity
- High demand for regulated SaaS talent
- GxP/data-security hires costly
- Knowledge-transfer bottlenecks
- Services scaling can strain margins
Life-science concentration: over 90%, FY2024 $2.77B, large-client renewal risk
Veeva revenue >90% tied to life sciences; FY2024 revenue $2.77B concentrates exposure to pharma R&D and budget cycles. ARR skews to large customers (20 of top 25 pharma use Veeva), creating renewal/pricing risk. Long validation/upgrades and high-cost GxP talent slow expansions and pressure services margins.
| Metric | Value |
|---|---|
| FY2024 revenue | $2.77B |
| Life-sciences revenue share | >90% |
| Top pharma customers | 20 of 25 |
Full Version Awaits
Veeva Systems SWOT Analysis
This is a real excerpt from the complete Veeva Systems SWOT analysis document you’ll receive upon purchase—no surprises, just professional quality. The preview below is pulled directly from the final report; buy now to unlock the full, editable version with in-depth findings and strategic implications.

Original: $10.00
-65%$10.00
$3.50Product Information
Product Information
Shipping & Returns
Shipping & Returns
Description
Make Insightful Decisions Backed by Expert Research
Veeva Systems shows strengths in life‑sciences‑focused SaaS, strong recurring revenue and regulatory expertise, but faces concentration risk and product dependency. Opportunities include AI‑enabled solutions and international expansion, while competition and pricing pressure pose threats. Want the full story behind these dynamics? Purchase the complete SWOT analysis for a professionally formatted Word and Excel report to inform strategy and investment.
Strengths
Vertical life sciences focus
Veeva’s vertical focus on pharma, biotech and medtech drives deep domain fit, with over 90% of revenue coming from life sciences customers. Purpose-built workflows map directly to GxP requirements and FDA/EMA submission pathways, reducing compliance burden. This specialization yields stronger product-market fit than horizontal SaaS and reinforces credibility with regulated buyers.
Broad, integrated platform
Veeva’s integrated suite—CRM, Vault, Data and Clinical—offers end-to-end capabilities that limit vendor sprawl and lower integration cost, supporting its >1,000 life‑sciences customers and driving FY2024 revenue above $2.1B. Connected cross‑module data flow improves decision speed and user productivity, while suite breadth ensures consistent UX and centralized governance across development, commercial and data functions.
High switching costs
Veeva’s embedded validated processes and compliance documentation deter churn, with the company serving 19 of the top 20 global pharma firms, reinforcing sector trust. Data migration in regulated settings is costly and risky, often requiring lengthy revalidation and project teams. User retraining and formal revalidation extend customer lock-in, while common multi-year contracts (typically 3–5 years) reinforce stickiness.
Regulatory and quality expertise
As of 2024 Veeva cloud solutions are engineered for validation, audit trails and strict content controls, supporting regulatory submissions, clinical trials and safety workflows. This pedigree lowers compliance risk for customers and speeds deployment in highly scrutinized environments. Veeva reports broad adoption across global life sciences firms.
- Built for validation, audit trails, content control
- Proven support for submissions, trials, safety
- Reduces compliance risk; accelerates deployment in regulated settings
Blue-chip customer base
Veeva has strong penetration with top global pharmas and growing biotechs, including 23 of the top 25 global pharmaceutical companies. Its large installed base of over 1,200 life‑science customers drives recurring subscription revenue and provides high-quality references. Land‑and‑expand motions have steadily increased ACV and customer lifetime value. Continuous customer feedback directly informs the product roadmap.
- Penetration: 23 of top 25 pharma
- Installed base: >1,200 customers
- Revenue model: recurring subscription/expansion
- Product dev: feedback-driven roadmap
>$2.1B; >90% life-sciences; 23/25
Veeva’s vertical focus yields >90% life‑sciences revenue and purpose‑built GxP workflows that reduce compliance burden. Its integrated suite (CRM, Vault, Data, Clinical) supports >1,200 customers, driving recurring revenue and FY2024 revenue >$2.1B. High trust: 23 of top 25 pharma use Veeva, with common 3–5 year contracts boosting retention.
| Metric | Value |
|---|---|
| FY2024 revenue | > $2.1B |
| Customers | > 1,200 |
| Top pharma penetration | 23/25 |
| Life‑sciences revenue share | > 90% |
| Typical contract length | 3–5 years |
What is included in the product
Detailed Word Document
Delivers a strategic overview of Veeva Systems’s internal and external business factors, outlining strengths, weaknesses, opportunities, and threats; analyzes competitive position, growth drivers, operational gaps, and market risks shaping its future.
Customizable Excel Spreadsheet
Provides a concise, Veeva Systems–focused SWOT matrix for fast strategy alignment and executive snapshots, easing cross‑team planning, stakeholder presentations, and quick updates as priorities change.
Weaknesses
Narrow industry concentration
Veeva's revenue remains concentrated in life sciences, with over 90% of sales tied to pharma and biotech customers, making its results closely linked to industry cycles and pharma budget shifts. Exposure to R&D spending volatility and pipeline delays elevates risk versus horizontal SaaS peers, so sector downturns can disproportionately hit growth and ARR expansion.
Dependence on key accounts
A meaningful share of Veeva’s ARR is concentrated in large life-science enterprises, creating exposure when a few strategic customers dominate renewals. Pricing pressure often emerges during renewals with these accounts, driven by customer leverage and expectation of scope concessions. Industry consolidation among pharmas can reduce user seats and contract scale, and loss of any top account would be materially adverse to revenue predictability.
Lengthy sales and validation cycles
Lengthy sales and compliance reviews, driven by FDA/EMA validation requirements, routinely elongate Veeva Systems NYSE: VEEV deal timelines and push implementation start dates into subsequent quarters.
Rigorous validation and change-control processes slow expansions and can defer subscription revenue recognition, complicating quarter-to-quarter comparability in 2024–2025.
These extended cycles make forecasting across global rollouts harder, increasing variance in revenue timing and execution risk.
Migration and platform transition risk
Shifts between core platforms or major product generations expose execution risk for Veeva as customers — including 20 of the top 25 global pharmaceutical companies — resist disruptive change; heavy customer customizations complicate upgrades, while any performance or feature gaps slow adoption and invite competitors to target accounts during transitions.
- Execution risk on migrations
- Customer customizations hinder upgrades
- Performance/feature gaps slow rollout
- Competitors target transitioning accounts
Talent and domain scarcity
- High demand for regulated SaaS talent
- GxP/data-security hires costly
- Knowledge-transfer bottlenecks
- Services scaling can strain margins
Life-science concentration: over 90%, FY2024 $2.77B, large-client renewal risk
Veeva revenue >90% tied to life sciences; FY2024 revenue $2.77B concentrates exposure to pharma R&D and budget cycles. ARR skews to large customers (20 of top 25 pharma use Veeva), creating renewal/pricing risk. Long validation/upgrades and high-cost GxP talent slow expansions and pressure services margins.
| Metric | Value |
|---|---|
| FY2024 revenue | $2.77B |
| Life-sciences revenue share | >90% |
| Top pharma customers | 20 of 25 |
Full Version Awaits
Veeva Systems SWOT Analysis
This is a real excerpt from the complete Veeva Systems SWOT analysis document you’ll receive upon purchase—no surprises, just professional quality. The preview below is pulled directly from the final report; buy now to unlock the full, editable version with in-depth findings and strategic implications.











