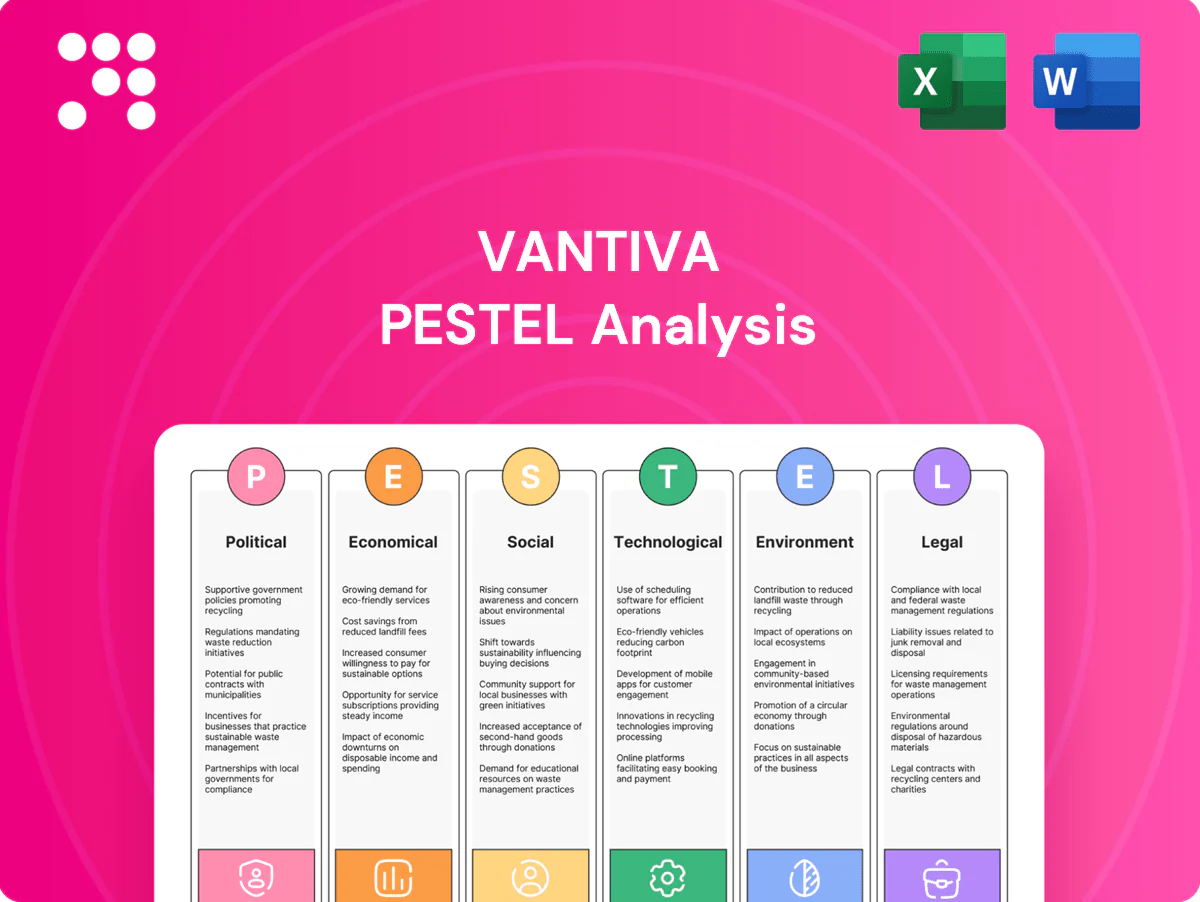
Vantiva PESTLE Analysis

Your Competitive Advantage Starts with This Report
Discover how political shifts, market trends, and technological change are shaping Vantiva's strategic outlook in our concise PESTLE snapshot. This 3–5 sentence overview highlights key external forces affecting risk and growth. Purchase the full PESTLE for deep-dive, actionable intelligence you can use in investment theses and strategic plans.
Political factors

Trade policies and tariffs on electronics
Import duties on components and finished CPE can materially shift cost structures and pricing power; US Section 301 tariffs on about $360bn of Chinese goods (rates roughly 7.5–25%) and EU safeguard duties raise input costs.
Shifts in EU–US–China trade relations worsen sourcing and lead times—container rate spikes in 2021–22 (peaks near $20,000 per FEU) illustrated vulnerability.
Preferential pacts like RCEP (effective Jan 2022, covers ~30% of global GDP) open lower-cost manufacturing routes, while sudden tariff hikes risk margin compression or customer repricing.
Export controls on advanced semiconductors
Since October 2022 US export controls on advanced semiconductors and related encryption technologies constrain Vantiva product roadmaps for set-top boxes and gateways by limiting access to high-performance chipsets. Licensing requirements from the US Commerce Department for shipments to China and other restricted markets can delay deliveries. Vendors often must redesign SKUs to comply and compliance costs rise across the supply chain.

Broadband infrastructure and media policy
Government-backed broadband rollouts drive CPE demand cycles: EU Digital Decade targets gigabit connectivity by 2030 and the US BEAD program commits $42.45 billion to broadband deployments, boosting supplier order pipelines. Local content rules and media regulations force operators to deploy specific CPE/features, while subsidy reversals or policy shifts can abruptly stall operator capex and delay rollouts.

Geopolitical instability and supply chain security
Geopolitical tensions disrupt logistics, component availability and contract manufacturing, exemplified by market closures after Russia sanctions since 2022; governments increasingly mandate supply-chain transparency, notably the EU CSRD affecting about 50,000 firms from 2024. Dual-sourcing has become both a political and operational hedge for Vantiva.
- Regional disruption: logistics & contract manufacturing
- Regulation: EU CSRD ~50,000 firms
- Dual-sourcing: political + operational hedge
- Sanctions: abrupt market closures (eg Russia)
Public procurement and standards alignment
State-backed operators often mandate alignment with national technical and security standards, and NIS2 implementation across EU member states (phased 2024–2025) increases procurement scrutiny; political preferences and strategic alliances can tilt vendor selection toward domestic suppliers. Alignment with Common Criteria and ISO 27001 improves eligibility, while policy-driven interoperability mandates can force hardware/software spec changes.
Tariffs, RCEP and export controls squeeze CPE margins; BEAD and EU rules raise demand and costs
Political risks shape Vantiva: tariffs (US Section 301 on ~$360bn Chinese goods, rates ~7.5–25%) and RCEP (Jan 2022, ~30% global GDP) alter sourcing and margins; BEAD ($42.45bn) and EU Digital Decade (gigabit by 2030) drive CPE demand. US export controls since Oct 2022 constrain high-end chip access; EU CSRD (~50,000 firms) and NIS2 (2024–25) raise compliance costs.
| Factor | Impact | Data |
|---|---|---|
| Tariffs | Higher input costs | Section 301 ~$360bn; 7.5–25% |
| Subsidies | Boost demand | BEAD $42.45bn; EU gigabit 2030 |
| Export controls | Chip access limits | US controls since Oct 2022 |
| Regulation | Compliance burden | CSRD ~50,000 firms; NIS2 2024–25 |
What is included in the product
 Detailed Word Document
Provides a concise PESTLE assessment of Vantiva—covering Political, Economic, Social, Technological, Environmental and Legal forces—with data-backed trends and region/industry specifics to reveal risks, opportunities and scenario-ready insights for executives, investors and strategists, formatted for immediate inclusion in plans and decks.

 Customizable Excel Spreadsheet
Vantiva PESTLE condenses external risks and market drivers into a visually segmented, easy-to-share summary that teams can drop into presentations, annotate for local context, and use to accelerate strategic decisions and risk discussions.
Economic factors

Consumer spending and operator capex cycles
Macroeconomic slowdowns in 2024 deferred many set-top and gateway refresh cycles as household discretionary spending tightened, delaying upgrade purchases and dragging unit volumes. Strong operator capex pockets in 2024–2025 sustained volume and ASP stability where service providers prioritized network and access hardware renewals. DVD Services volumes tracked title release schedules and retail demand spikes, with elasticity pressures intensifying in price-sensitive markets as consumers traded down or delayed purchases.
Component inflation and supply-demand balance
Semiconductor pricing and volatile lead times remain primary drivers of Vantiva's COGS swings, with tight supply forcing spot buys and occasional redesigns that raise unit costs. Deflationary cycles can lift gross margins but compress ASPs, squeezing revenue per unit. Global semiconductor sales were $556 billion in 2023 (WSTS), underscoring scale; inventory management is therefore a critical competitive differentiator.

Currency fluctuations across global operations
Vantiva's multi-currency revenues and costs—with reported 2023 revenue of about €1.3bn—leave margins exposed to FX swings across Europe, North America and Asia. The group uses hedging programs that reduce short-term volatility but cannot fully eliminate translation and transaction risk. Stronger US dollar in 2023–24 increased USD-denominated component costs for non-USD sales, while pricing adjustments often lag FX moves.

Scale economies and manufacturing footprint
High fixed costs in electronics manufacturing reward volume consolidation; global industry studies in 2024 show top-quartile plants achieve 15–25% lower unit fixed cost versus small sites. Nearshoring reduces logistics lead times (often ~20% faster) but can raise unit costs by ~5–10% depending on wages and tariffs. Contract manufacturing terms affect flexibility and working capital; longer payment terms improve cash flow but can limit responsiveness. Plant utilization drives profitability: each 5pp drop in utilization typically erodes gross margin materially.
- volume consolidation: lower fixed-cost/unit
- nearshoring: -20% lead time, +5–10% unit cost
- CM terms: flexibility vs cash flow
- utilization: direct margin lever
Streaming growth and revenue mix shifts
Rising OTT competition is reshaping operator device strategies and subsidy policies, driving demand toward advanced Wi‑Fi and 4K/8K set‑top boxes with embedded security and DRM.
Vantiva can offset hardware margin pressure through service attach and software monetization as physical media volumes decline structurally.
Global OTT revenue (~$190bn in 2024) and streaming subscriber growth justify shifting mix to software and services.
- OTT pressure → lower hardware subsidies
- Higher demand: Wi‑Fi, 4K/8K, security
- Service/software attach offsets margins
- Physical media declining → efficiency needed
Tariffs, RCEP and export controls squeeze CPE margins; BEAD and EU rules raise demand and costs
Macroeconomic slowdown in 2024 delayed consumer device refreshes, compressing unit volumes despite pockets of operator capex.
Semiconductor volatility (global sales $556bn in 2023) and FX exposed 2023 revenue ~€1.3bn to COGS swings and margin pressure.
OTT growth (~$190bn 2024) shifts mix to software/service attach to offset declining physical media and subsidy cuts.
| Metric | Value |
|---|---|
| Vantiva rev 2023 | €1.3bn |
| Semiconductor sales 2023 | $556bn |
| OTT revenue 2024 | $190bn |
What You See Is What You Get
Vantiva PESTLE Analysis
The preview shown here is the exact Vantiva PESTLE Analysis you’ll receive after purchase—fully formatted and ready to use. This file is the final version with no placeholders, and the layout, content, and structure are delivered exactly as displayed. You can download it instantly after checkout.

Original: $10.00
-65%$10.00
$3.50Product Information
Product Information
Shipping & Returns
Shipping & Returns
Description
Your Competitive Advantage Starts with This Report
Discover how political shifts, market trends, and technological change are shaping Vantiva's strategic outlook in our concise PESTLE snapshot. This 3–5 sentence overview highlights key external forces affecting risk and growth. Purchase the full PESTLE for deep-dive, actionable intelligence you can use in investment theses and strategic plans.
Political factors
Trade policies and tariffs on electronics
Import duties on components and finished CPE can materially shift cost structures and pricing power; US Section 301 tariffs on about $360bn of Chinese goods (rates roughly 7.5–25%) and EU safeguard duties raise input costs.
Shifts in EU–US–China trade relations worsen sourcing and lead times—container rate spikes in 2021–22 (peaks near $20,000 per FEU) illustrated vulnerability.
Preferential pacts like RCEP (effective Jan 2022, covers ~30% of global GDP) open lower-cost manufacturing routes, while sudden tariff hikes risk margin compression or customer repricing.
Export controls on advanced semiconductors
Since October 2022 US export controls on advanced semiconductors and related encryption technologies constrain Vantiva product roadmaps for set-top boxes and gateways by limiting access to high-performance chipsets. Licensing requirements from the US Commerce Department for shipments to China and other restricted markets can delay deliveries. Vendors often must redesign SKUs to comply and compliance costs rise across the supply chain.
Broadband infrastructure and media policy
Government-backed broadband rollouts drive CPE demand cycles: EU Digital Decade targets gigabit connectivity by 2030 and the US BEAD program commits $42.45 billion to broadband deployments, boosting supplier order pipelines. Local content rules and media regulations force operators to deploy specific CPE/features, while subsidy reversals or policy shifts can abruptly stall operator capex and delay rollouts.
Geopolitical instability and supply chain security
Geopolitical tensions disrupt logistics, component availability and contract manufacturing, exemplified by market closures after Russia sanctions since 2022; governments increasingly mandate supply-chain transparency, notably the EU CSRD affecting about 50,000 firms from 2024. Dual-sourcing has become both a political and operational hedge for Vantiva.
- Regional disruption: logistics & contract manufacturing
- Regulation: EU CSRD ~50,000 firms
- Dual-sourcing: political + operational hedge
- Sanctions: abrupt market closures (eg Russia)
Public procurement and standards alignment
State-backed operators often mandate alignment with national technical and security standards, and NIS2 implementation across EU member states (phased 2024–2025) increases procurement scrutiny; political preferences and strategic alliances can tilt vendor selection toward domestic suppliers. Alignment with Common Criteria and ISO 27001 improves eligibility, while policy-driven interoperability mandates can force hardware/software spec changes.
Tariffs, RCEP and export controls squeeze CPE margins; BEAD and EU rules raise demand and costs
Political risks shape Vantiva: tariffs (US Section 301 on ~$360bn Chinese goods, rates ~7.5–25%) and RCEP (Jan 2022, ~30% global GDP) alter sourcing and margins; BEAD ($42.45bn) and EU Digital Decade (gigabit by 2030) drive CPE demand. US export controls since Oct 2022 constrain high-end chip access; EU CSRD (~50,000 firms) and NIS2 (2024–25) raise compliance costs.
| Factor | Impact | Data |
|---|---|---|
| Tariffs | Higher input costs | Section 301 ~$360bn; 7.5–25% |
| Subsidies | Boost demand | BEAD $42.45bn; EU gigabit 2030 |
| Export controls | Chip access limits | US controls since Oct 2022 |
| Regulation | Compliance burden | CSRD ~50,000 firms; NIS2 2024–25 |
What is included in the product
Detailed Word Document
Provides a concise PESTLE assessment of Vantiva—covering Political, Economic, Social, Technological, Environmental and Legal forces—with data-backed trends and region/industry specifics to reveal risks, opportunities and scenario-ready insights for executives, investors and strategists, formatted for immediate inclusion in plans and decks.
Customizable Excel Spreadsheet
Vantiva PESTLE condenses external risks and market drivers into a visually segmented, easy-to-share summary that teams can drop into presentations, annotate for local context, and use to accelerate strategic decisions and risk discussions.
Economic factors
Consumer spending and operator capex cycles
Macroeconomic slowdowns in 2024 deferred many set-top and gateway refresh cycles as household discretionary spending tightened, delaying upgrade purchases and dragging unit volumes. Strong operator capex pockets in 2024–2025 sustained volume and ASP stability where service providers prioritized network and access hardware renewals. DVD Services volumes tracked title release schedules and retail demand spikes, with elasticity pressures intensifying in price-sensitive markets as consumers traded down or delayed purchases.
Component inflation and supply-demand balance
Semiconductor pricing and volatile lead times remain primary drivers of Vantiva's COGS swings, with tight supply forcing spot buys and occasional redesigns that raise unit costs. Deflationary cycles can lift gross margins but compress ASPs, squeezing revenue per unit. Global semiconductor sales were $556 billion in 2023 (WSTS), underscoring scale; inventory management is therefore a critical competitive differentiator.
Currency fluctuations across global operations
Vantiva's multi-currency revenues and costs—with reported 2023 revenue of about €1.3bn—leave margins exposed to FX swings across Europe, North America and Asia. The group uses hedging programs that reduce short-term volatility but cannot fully eliminate translation and transaction risk. Stronger US dollar in 2023–24 increased USD-denominated component costs for non-USD sales, while pricing adjustments often lag FX moves.
Scale economies and manufacturing footprint
High fixed costs in electronics manufacturing reward volume consolidation; global industry studies in 2024 show top-quartile plants achieve 15–25% lower unit fixed cost versus small sites. Nearshoring reduces logistics lead times (often ~20% faster) but can raise unit costs by ~5–10% depending on wages and tariffs. Contract manufacturing terms affect flexibility and working capital; longer payment terms improve cash flow but can limit responsiveness. Plant utilization drives profitability: each 5pp drop in utilization typically erodes gross margin materially.
- volume consolidation: lower fixed-cost/unit
- nearshoring: -20% lead time, +5–10% unit cost
- CM terms: flexibility vs cash flow
- utilization: direct margin lever
Streaming growth and revenue mix shifts
Rising OTT competition is reshaping operator device strategies and subsidy policies, driving demand toward advanced Wi‑Fi and 4K/8K set‑top boxes with embedded security and DRM.
Vantiva can offset hardware margin pressure through service attach and software monetization as physical media volumes decline structurally.
Global OTT revenue (~$190bn in 2024) and streaming subscriber growth justify shifting mix to software and services.
- OTT pressure → lower hardware subsidies
- Higher demand: Wi‑Fi, 4K/8K, security
- Service/software attach offsets margins
- Physical media declining → efficiency needed
Tariffs, RCEP and export controls squeeze CPE margins; BEAD and EU rules raise demand and costs
Macroeconomic slowdown in 2024 delayed consumer device refreshes, compressing unit volumes despite pockets of operator capex.
Semiconductor volatility (global sales $556bn in 2023) and FX exposed 2023 revenue ~€1.3bn to COGS swings and margin pressure.
OTT growth (~$190bn 2024) shifts mix to software/service attach to offset declining physical media and subsidy cuts.
| Metric | Value |
|---|---|
| Vantiva rev 2023 | €1.3bn |
| Semiconductor sales 2023 | $556bn |
| OTT revenue 2024 | $190bn |
What You See Is What You Get
Vantiva PESTLE Analysis
The preview shown here is the exact Vantiva PESTLE Analysis you’ll receive after purchase—fully formatted and ready to use. This file is the final version with no placeholders, and the layout, content, and structure are delivered exactly as displayed. You can download it instantly after checkout.











