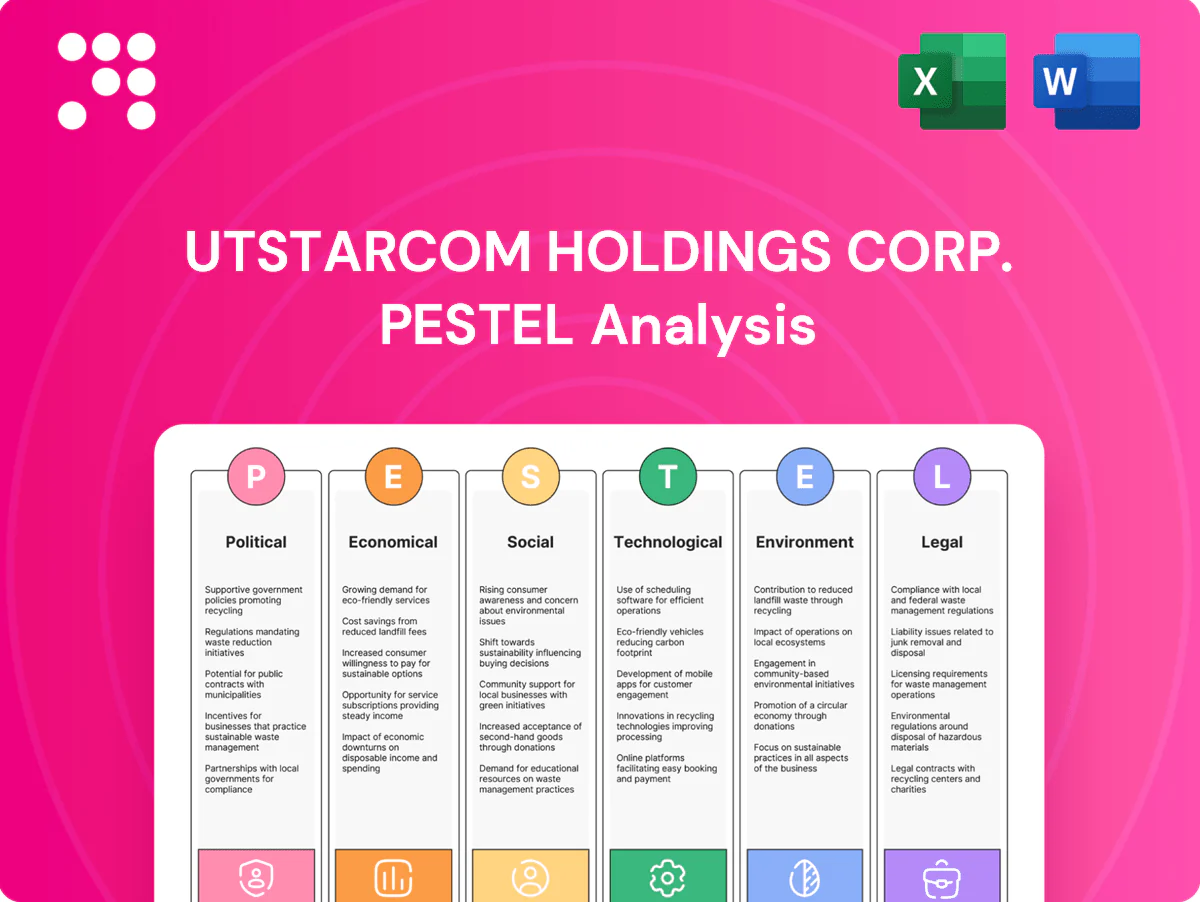
UTStarcom Holdings Corp. PESTLE Analysis

Skip the Research. Get the Strategy.
Our PESTLE Analysis for UTStarcom Holdings Corp. reveals how political, economic, social, technological, legal and environmental forces are reshaping its market position. Identify risks and growth levers with clear, evidence-based insights. Ideal for investors and strategists—buy the full report for the complete, downloadable breakdown.
Political factors

Geopolitical tensions and trade policy
UTStarcom’s cross-border operations face heightened risk from US–China tensions, export controls and sanctions that can restrict component sourcing and market access and impact sales in the $690 billion US–China goods corridor. Shifts in trade policy alter tariffs and compliance burdens across suppliers, forcing contingency sourcing and regionalization. Diplomatic moves can rapidly change sales pipelines and partner eligibility.
Government telecom investment priorities
Public funding for broadband, 5G and FTTx—notably the US Infrastructure Investment and Jobs Act with $65 billion for broadband and the EU NextGenerationEU €750 billion recovery fund—directly lifts carrier capex and vendor demand. National infrastructure plans and stimulus accelerate PTN and access deployments, while policy delays or reallocations can defer projects. Close alignment with state-backed operators boosts program visibility and win rates.

Vendor approval and national security reviews
Security-driven vendor lists and certifications determine eligibility in many countries; global supplier vetting intensified after the U.S. Entity List exceeded 1,600 entries by mid-2024. Political scrutiny can produce bans or preferred-supplier status, so UTStarcom must navigate country-specific security vetting and audits. A strong compliance posture mitigates exclusion risk and preserves access to tenders.

Spectrum allocation and regulatory direction
Spectrum policy directs carrier rollout timing and tech choices, shaping UTStarcom demand for transport and backhaul; the FCC C‑band auction raised $81 billion (2021) and global 5G connections exceeded ~1.5 billion by end‑2023, illustrating scale impacts. Costly auctions or allocation delays compress carrier investment cycles and can defer purchases. Harmonized spectrum across markets enables faster multi‑country deployments and lower per‑country capex, while proactive regulator engagement helps anticipate timing and required features.
- Allocation timing drives transport/backhaul demand
- High auction costs (e.g., $81B C‑band) slow investment
- Harmonization → faster multi‑country scale
- Regulatory engagement reduces timing/feature risk
Public procurement and localization policies
Local content rules and procurement preferences shape UTStarcoms market entry and pricing, with public procurement accounting for roughly 12% of global GDP and driving demand toward local suppliers. Requirements for local assembly or partnerships increase complexity and capex but unlock government-led projects; UTStarcom may need JV structures or local subsidiaries to qualify. Policy stability directly affects long-term planning and capital allocation.
- Local content rules: force supply-chain changes
- Procurement preferences: favor domestic bidders
- JV requirement: likely for market access
- Policy stability: crucial for CAPEX planning
Supply-chain regionalization: US–China $690B, Entity List >1,600
Geopolitical tension (US–China $690B goods corridor) plus US Entity List >1,600 (mid‑2024) and export controls force supply‑chain regionalization and restrict market access. Public funding (US IIJA $65B broadband) and big auctions (FCC C‑band $81B) boost carrier capex but auction costs and local content rules (public procurement ~12% GDP) raise compliance and JV needs.
| Factor | 2024/25 Metric | Impact |
|---|---|---|
| Trade tension | $690B corridor | Market access risk |
| Entity List | >1,600 entries | Vendor bans |
| Public funding | $65B IIJA | Capex uplift |
What is included in the product
 Detailed Word Document
Explores how Political, Economic, Social, Technological, Environmental and Legal forces uniquely impact UTStarcom Holdings Corp., with data-driven subpoints tied to its telecom equipment and services footprint. Designed for executives and investors, the analysis highlights region-specific risks, opportunities and forward-looking scenarios to inform strategy and funding decisions.

 Customizable Excel Spreadsheet
A concise, visually segmented PESTLE summary of UTStarcom Holdings that’s easily droppable into presentations or strategy sessions, editable for local context and shareable across teams to streamline risk discussions and market-positioning decisions.
Economic factors

Carrier capex cycles
Telecom operators’ capex cycles are the main demand driver for PTN and broadband access products, with network upgrade programs and rollouts typically planned over multi-year windows of about 3–5 years. Macro slowdowns or operator balance-sheet constraints have historically deferred upgrades (notably during the 2020 pandemic) while sustained traffic growth and competitive pressures accelerate spend. UTStarcom’s revenue visibility closely tracks RFP timing and these multi-year rollout plans, tying near-term bookings to operator capex calendars.
Exchange rates and cost inflation
Currency volatility (typical swings of 5–10% in USD vs regional currencies during 2023–25) affects UTStarcom pricing competitiveness, margins and imported component costs; semiconductor and logistics cost inflation (industry freight and wafer cost upticks of mid-single digits in 2022–24) can compress gross margins if not passed through. Hedging and multi-currency contracts stabilize outcomes, while regional pricing strategies are essential to sustain share.

Interest rates and financing conditions
Higher borrowing costs with the federal funds rate at 5.25–5.50% raise carriers’ cost of capital, potentially delaying network expansions and stretching payback periods. Vendor financing and EXIM-backed facilities can unlock deals by lowering upfront cash needs for buyers. UTStarcom’s balance sheet flexibility determines its ability to offer competitive financing and win bids, while rate pivots can catalyze deferred projects.

Market consolidation among operators
Carrier consolidation — for example the US T-Mobile/Sprint merger that reduced national carriers from four to three — often shrinks the buyer pool while increasing average project size and scope, favoring suppliers who can scale to multi-billion-dollar 5G rollouts.
- Fewer buyers: example US 4→3 post T‑Mobile/Sprint
- Larger deals: favors scale
- Standardization: may displace non‑incumbents
- Procurement: longer cycles, more scrutiny
- Retention: strategic account management critical
Emerging market growth
- IMF 2024: EMDE growth ~4.1%
- Budget focus: demand for low-cost robust solutions
- Risk: currency exposure, sovereign credit affects payment terms
- Advantage: local service capabilities = competitive edge
Supply-chain regionalization: US–China $690B, Entity List >1,600
Telecom capex cycles (3–5 yrs) drive UTStarcom demand; bookings align with operator RFP timing. FX swings (5–10% 2023–25) and component inflation pressure margins; hedging helps. Higher rates (Fed 5.25–5.50%) raise carriers’ cost of capital; EMDE growth (IMF 2024: 4.1%) supports greenfield demand.
| Metric | 2024–25 |
|---|---|
| Capex cycle | 3–5 yrs |
| FX volatility | 5–10% |
| Fed funds | 5.25–5.50% |
| EMDE growth | 4.1% |
Full Version Awaits
UTStarcom Holdings Corp. PESTLE Analysis
The preview shown here is the exact UTStarcom Holdings Corp. PESTLE Analysis you’ll receive after purchase—fully formatted and ready to use. It covers political, economic, social, technological, legal and environmental factors with concise, actionable insights. No placeholders or teasers—this is the final file delivered as shown.

Original: $10.00
-65%$10.00
$3.50Product Information
Product Information
Shipping & Returns
Shipping & Returns
Description
Skip the Research. Get the Strategy.
Our PESTLE Analysis for UTStarcom Holdings Corp. reveals how political, economic, social, technological, legal and environmental forces are reshaping its market position. Identify risks and growth levers with clear, evidence-based insights. Ideal for investors and strategists—buy the full report for the complete, downloadable breakdown.
Political factors
Geopolitical tensions and trade policy
UTStarcom’s cross-border operations face heightened risk from US–China tensions, export controls and sanctions that can restrict component sourcing and market access and impact sales in the $690 billion US–China goods corridor. Shifts in trade policy alter tariffs and compliance burdens across suppliers, forcing contingency sourcing and regionalization. Diplomatic moves can rapidly change sales pipelines and partner eligibility.
Government telecom investment priorities
Public funding for broadband, 5G and FTTx—notably the US Infrastructure Investment and Jobs Act with $65 billion for broadband and the EU NextGenerationEU €750 billion recovery fund—directly lifts carrier capex and vendor demand. National infrastructure plans and stimulus accelerate PTN and access deployments, while policy delays or reallocations can defer projects. Close alignment with state-backed operators boosts program visibility and win rates.
Vendor approval and national security reviews
Security-driven vendor lists and certifications determine eligibility in many countries; global supplier vetting intensified after the U.S. Entity List exceeded 1,600 entries by mid-2024. Political scrutiny can produce bans or preferred-supplier status, so UTStarcom must navigate country-specific security vetting and audits. A strong compliance posture mitigates exclusion risk and preserves access to tenders.
Spectrum allocation and regulatory direction
Spectrum policy directs carrier rollout timing and tech choices, shaping UTStarcom demand for transport and backhaul; the FCC C‑band auction raised $81 billion (2021) and global 5G connections exceeded ~1.5 billion by end‑2023, illustrating scale impacts. Costly auctions or allocation delays compress carrier investment cycles and can defer purchases. Harmonized spectrum across markets enables faster multi‑country deployments and lower per‑country capex, while proactive regulator engagement helps anticipate timing and required features.
- Allocation timing drives transport/backhaul demand
- High auction costs (e.g., $81B C‑band) slow investment
- Harmonization → faster multi‑country scale
- Regulatory engagement reduces timing/feature risk
Public procurement and localization policies
Local content rules and procurement preferences shape UTStarcoms market entry and pricing, with public procurement accounting for roughly 12% of global GDP and driving demand toward local suppliers. Requirements for local assembly or partnerships increase complexity and capex but unlock government-led projects; UTStarcom may need JV structures or local subsidiaries to qualify. Policy stability directly affects long-term planning and capital allocation.
- Local content rules: force supply-chain changes
- Procurement preferences: favor domestic bidders
- JV requirement: likely for market access
- Policy stability: crucial for CAPEX planning
Supply-chain regionalization: US–China $690B, Entity List >1,600
Geopolitical tension (US–China $690B goods corridor) plus US Entity List >1,600 (mid‑2024) and export controls force supply‑chain regionalization and restrict market access. Public funding (US IIJA $65B broadband) and big auctions (FCC C‑band $81B) boost carrier capex but auction costs and local content rules (public procurement ~12% GDP) raise compliance and JV needs.
| Factor | 2024/25 Metric | Impact |
|---|---|---|
| Trade tension | $690B corridor | Market access risk |
| Entity List | >1,600 entries | Vendor bans |
| Public funding | $65B IIJA | Capex uplift |
What is included in the product
Detailed Word Document
Explores how Political, Economic, Social, Technological, Environmental and Legal forces uniquely impact UTStarcom Holdings Corp., with data-driven subpoints tied to its telecom equipment and services footprint. Designed for executives and investors, the analysis highlights region-specific risks, opportunities and forward-looking scenarios to inform strategy and funding decisions.
Customizable Excel Spreadsheet
A concise, visually segmented PESTLE summary of UTStarcom Holdings that’s easily droppable into presentations or strategy sessions, editable for local context and shareable across teams to streamline risk discussions and market-positioning decisions.
Economic factors
Carrier capex cycles
Telecom operators’ capex cycles are the main demand driver for PTN and broadband access products, with network upgrade programs and rollouts typically planned over multi-year windows of about 3–5 years. Macro slowdowns or operator balance-sheet constraints have historically deferred upgrades (notably during the 2020 pandemic) while sustained traffic growth and competitive pressures accelerate spend. UTStarcom’s revenue visibility closely tracks RFP timing and these multi-year rollout plans, tying near-term bookings to operator capex calendars.
Exchange rates and cost inflation
Currency volatility (typical swings of 5–10% in USD vs regional currencies during 2023–25) affects UTStarcom pricing competitiveness, margins and imported component costs; semiconductor and logistics cost inflation (industry freight and wafer cost upticks of mid-single digits in 2022–24) can compress gross margins if not passed through. Hedging and multi-currency contracts stabilize outcomes, while regional pricing strategies are essential to sustain share.
Interest rates and financing conditions
Higher borrowing costs with the federal funds rate at 5.25–5.50% raise carriers’ cost of capital, potentially delaying network expansions and stretching payback periods. Vendor financing and EXIM-backed facilities can unlock deals by lowering upfront cash needs for buyers. UTStarcom’s balance sheet flexibility determines its ability to offer competitive financing and win bids, while rate pivots can catalyze deferred projects.
Market consolidation among operators
Carrier consolidation — for example the US T-Mobile/Sprint merger that reduced national carriers from four to three — often shrinks the buyer pool while increasing average project size and scope, favoring suppliers who can scale to multi-billion-dollar 5G rollouts.
- Fewer buyers: example US 4→3 post T‑Mobile/Sprint
- Larger deals: favors scale
- Standardization: may displace non‑incumbents
- Procurement: longer cycles, more scrutiny
- Retention: strategic account management critical
Emerging market growth
- IMF 2024: EMDE growth ~4.1%
- Budget focus: demand for low-cost robust solutions
- Risk: currency exposure, sovereign credit affects payment terms
- Advantage: local service capabilities = competitive edge
Supply-chain regionalization: US–China $690B, Entity List >1,600
Telecom capex cycles (3–5 yrs) drive UTStarcom demand; bookings align with operator RFP timing. FX swings (5–10% 2023–25) and component inflation pressure margins; hedging helps. Higher rates (Fed 5.25–5.50%) raise carriers’ cost of capital; EMDE growth (IMF 2024: 4.1%) supports greenfield demand.
| Metric | 2024–25 |
|---|---|
| Capex cycle | 3–5 yrs |
| FX volatility | 5–10% |
| Fed funds | 5.25–5.50% |
| EMDE growth | 4.1% |
Full Version Awaits
UTStarcom Holdings Corp. PESTLE Analysis
The preview shown here is the exact UTStarcom Holdings Corp. PESTLE Analysis you’ll receive after purchase—fully formatted and ready to use. It covers political, economic, social, technological, legal and environmental factors with concise, actionable insights. No placeholders or teasers—this is the final file delivered as shown.











