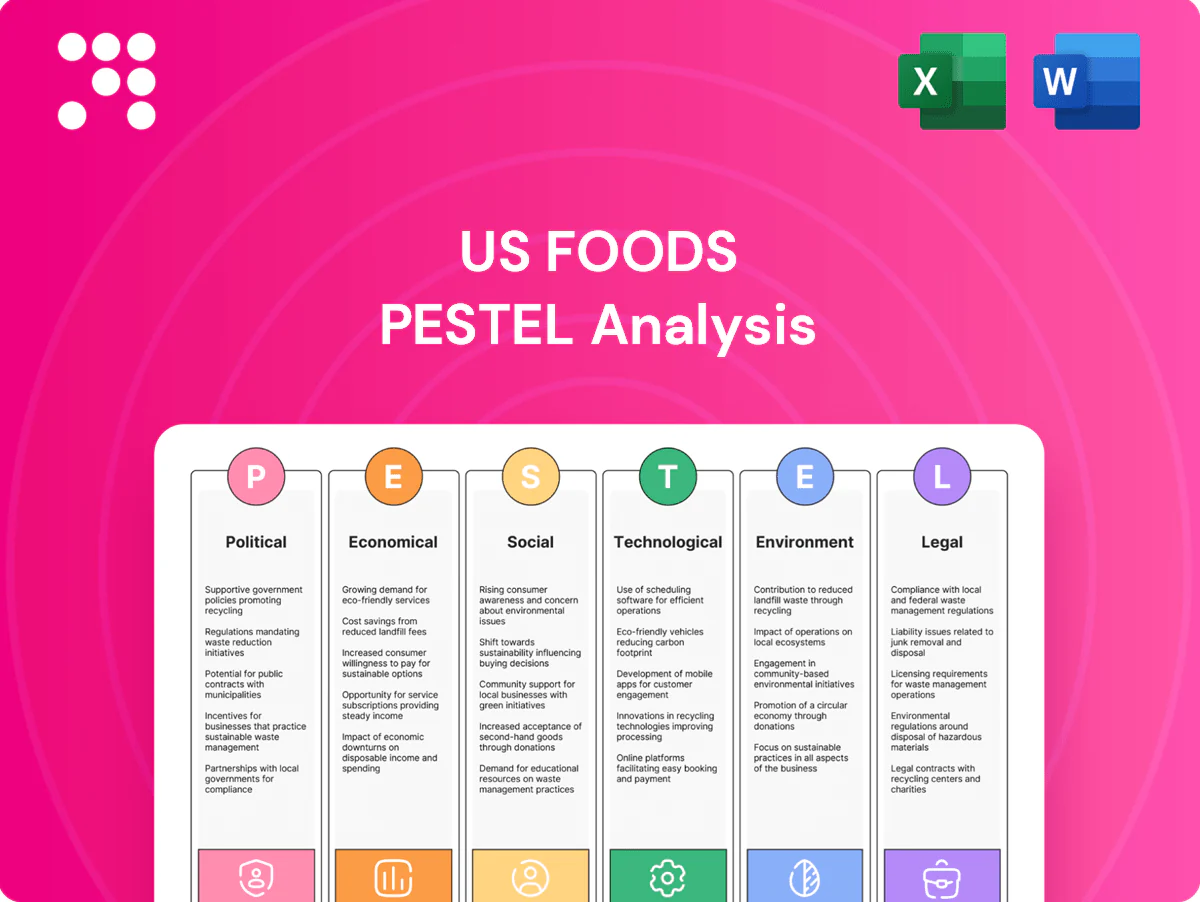
US Foods PESTLE Analysis

Skip the Research. Get the Strategy.
Unlock how political shifts, economic trends, social behavior, tech advances, legal changes, and environmental pressures shape US Foods with our concise PESTLE overview. Ideal for investors and strategists, it highlights risks and opportunities. Purchase the full analysis to get the complete, actionable report instantly.
Political factors

USDA/FDA food policy oversight
Shifts in USDA/FDA food safety and nutrition policy—rooted in FSMA (2011) and the FDA Food Traceability Rule covering 59 food categories—drive changes to product specs, inspection regimes, and compliance workflows. Updates to FDA traceability and USDA inspection protocols require new systems, documentation, and supplier alignment for US Foods private brands and sourcing. Greater policy stability reduces operational friction and costly product rework.
Trade tariffs and import dependencies
Tariffs on commodities, seafood, steel and packaging inputs—including the US 25% Section 232 steel tariffs—raise landed costs and force US Foods to adjust pricing strategies. Geopolitical tensions, exemplified by Red Sea disruptions since 2023, have tightened specialty-import flows restaurants rely on and increased freight/insurance costs. US Foods therefore needs hedging, diversified sourcing and contract flexibility. Rapid tariff shifts can compress margins before customer price resets occur.

Infrastructure and transportation funding
Federal/state investment via the IIJA ($1.2T total, including about $110B for roads/bridges and $17B for ports) boosts delivery reliability and fuel efficiency for US Foods; improved logistics cut lead times and lower spoilage (USDA estimates ~30–40% of the food supply is lost/wasted). Incentives for low-emission fleets (IRA/IIJA grants and tax credits) can reduce lifecycle operating costs, while public-works delays perpetuate bottlenecks and higher transport expenses.

Labor and immigration policies
Public health and school nutrition programs
Federal and state funding for K-12 and healthcare feeding programs underpins demand for US Foods, with the National School Lunch Program serving about 30 million children daily and SNAP covering roughly 41 million participants (2023), driving steady volume in education and healthcare verticals. Menu standards and reimbursement rate changes shift product mix and margins; policy expansions (eg program waivers) support resilience across economic cycles, while cuts or regulatory shifts can trigger abrupt volume declines.
- 30M daily NSLP participants (2023)
- 41M SNAP participants (2023)
- Reimbursement/policy shifts affect margins
- Expansions = steady demand; cuts = sudden volume drops
Tariffs, compliance and labor caps lift food logistics costs despite $1.2T
FDA/USDA traceability and inspection updates (FSMA framework) raise compliance costs and require supplier system changes. Tariffs (eg Section 232 steel 25%) and Red Sea disruptions since 2023 increase landed and logistics costs. IIJA/IRA infrastructure and fleet incentives (IIJA ~$1.2T) improve delivery reliability; labor limits (H-2B cap 66,000; ≈27 states E-Verify; ≈8M job openings) constrain staffing; NSLP ~30M/day, SNAP ~41M (2023) support steady demand.
| Metric | Value |
|---|---|
| Section 232 steel tariff | 25% |
| IIJA total | $1.2T |
| H-2B cap | 66,000 |
| E-Verify states | ≈27 |
| US job openings (2024) | ≈8M |
| NSLP participants (2023) | ≈30M/day |
| SNAP participants (2023) | ≈41M |
What is included in the product
 Detailed Word Document
Explores how external macro-environmental factors uniquely affect US Foods across Political, Economic, Social, Technological, Environmental and Legal dimensions; data‑backed trends and forward‑looking insights support executives, consultants and investors in identifying threats, opportunities and scenarios for strategic planning.

 Customizable Excel Spreadsheet
Clean, summarized US Foods PESTLE for quick meetings—visually segmented by category, editable for local context, and drop‑in ready for PowerPoints or team alignment.
Economic factors

Food inflation and commodity volatility
Price swings in proteins, dairy, grains and produce drive US Foods cost of goods—beef and pork futures moved roughly 20-30% in 2024 while milk and corn exhibited double-digit volatility, directly raising input costs.
Inflation in 2024–H1 2025 allowed partial price pass-through, but higher retail prices risk volume elasticity as consumers trade down; brief deflationary periods compress gross profit dollars near term.
Active category management and expanded private-label penetration (higher-margin SKUs) have been used to protect margin and stabilize basket price sensitivity.
Restaurant traffic and macro cycles
Consumer spending, employment (US unemployment ~3.7% in 2024) and real wages (real average hourly earnings down ~0.6% YoY in 2024) directly drive operator order frequency; US foodservice sales reached roughly $1.0 trillion in 2024, but downturns push mix toward value SKUs and away from premium items. Independent restaurants are notably more sensitive to demand shocks, while US Foods’ diversified end-markets help buffer regional and segment volatility.

Fuel, freight, and logistics costs
U.S. diesel averaged about $3.92/gal in June 2025 (EIA), directly shaping carrier rates and US Foods fuel-surcharge mechanics. Network optimization — routing, backhauls and distribution center placement — reduces exposure to short-term price spikes and cuts per-delivery costs. High cold-chain intensity makes refrigerated transport more energy sensitive, raising operating leverage on fuel. When fuel stabilizes, customer pricing becomes less volatile and margin forecasting improves.

Interest rates and capital access
Higher policy rates (Fed funds ~5.25% in mid‑2025) raise borrowing costs for fleet, real estate and automation, increasing annual debt service and compressing ROI. Tighter credit reduces operators' ability to open new locations and lowers average order sizes, with small‑business loan originations down roughly 10% YoY in 2024. Rate declines quickly unlock capex and M&A; firms with balance sheet flexibility can invest counter‑cyclically.
- Higher rates: Fed ~5.25% (mid‑2025)
- Credit impact: small‑business originations ≈‑10% YoY (2024)
- Opportunities: rate cuts → capex, M&A
- Defense: balance‑sheet flexibility enables counter‑cyclical investment
Industry consolidation and scale effects
Distributor and supplier consolidation has increased US Foods purchasing leverage and service density, supporting its FY2024 revenue of roughly $33.3 billion and a ~300,000 customer base; scale enables faster private-brand rollout and larger tech investments in logistics and e-commerce. Competitive responses in major metros could compress margins, while M&A integration risk requires preserving service quality and network uptime.
Tariffs, compliance and labor caps lift food logistics costs despite $1.2T
Input-cost volatility (beef/pork +20–30% in 2024; milk/corn double‑digit swings) raised COGS and pressured margins.
Demand elasticities: unemployment ~3.7% (2024), real wages down ~0.6% YoY (2024); foodservice sales ≈$1.0T (2024).
Fuel and logistics: diesel ≈$3.92/gal (Jun 2025) heighten refrigerated transport costs and surcharge pass‑through.
Finance and scale: Fed funds ≈5.25% (mid‑2025); US Foods FY2024 revenue ~$33.3B; ~300,000 customers.
| Metric | Value |
|---|---|
| Beef/Pork 2024 | +20–30% |
| Foodservice 2024 | $1.0T |
| Diesel Jun 2025 | $3.92/gal |
| Fed funds mid‑2025 | ~5.25% |
| US Foods FY2024 | $33.3B; 300k customers |
Same Document Delivered
US Foods PESTLE Analysis
The preview shown here is the exact document you’ll receive after purchase—fully formatted and ready to use. This US Foods PESTLE Analysis examines political, economic, social, technological, legal, and environmental factors affecting the company and its supply chain. It highlights key risks, opportunities, and strategic implications in a concise, actionable format ready for immediate download.

Original: $10.00
-65%$10.00
$3.50Product Information
Product Information
Shipping & Returns
Shipping & Returns
Description
Skip the Research. Get the Strategy.
Unlock how political shifts, economic trends, social behavior, tech advances, legal changes, and environmental pressures shape US Foods with our concise PESTLE overview. Ideal for investors and strategists, it highlights risks and opportunities. Purchase the full analysis to get the complete, actionable report instantly.
Political factors
USDA/FDA food policy oversight
Shifts in USDA/FDA food safety and nutrition policy—rooted in FSMA (2011) and the FDA Food Traceability Rule covering 59 food categories—drive changes to product specs, inspection regimes, and compliance workflows. Updates to FDA traceability and USDA inspection protocols require new systems, documentation, and supplier alignment for US Foods private brands and sourcing. Greater policy stability reduces operational friction and costly product rework.
Trade tariffs and import dependencies
Tariffs on commodities, seafood, steel and packaging inputs—including the US 25% Section 232 steel tariffs—raise landed costs and force US Foods to adjust pricing strategies. Geopolitical tensions, exemplified by Red Sea disruptions since 2023, have tightened specialty-import flows restaurants rely on and increased freight/insurance costs. US Foods therefore needs hedging, diversified sourcing and contract flexibility. Rapid tariff shifts can compress margins before customer price resets occur.
Infrastructure and transportation funding
Federal/state investment via the IIJA ($1.2T total, including about $110B for roads/bridges and $17B for ports) boosts delivery reliability and fuel efficiency for US Foods; improved logistics cut lead times and lower spoilage (USDA estimates ~30–40% of the food supply is lost/wasted). Incentives for low-emission fleets (IRA/IIJA grants and tax credits) can reduce lifecycle operating costs, while public-works delays perpetuate bottlenecks and higher transport expenses.
Labor and immigration policies
Public health and school nutrition programs
Federal and state funding for K-12 and healthcare feeding programs underpins demand for US Foods, with the National School Lunch Program serving about 30 million children daily and SNAP covering roughly 41 million participants (2023), driving steady volume in education and healthcare verticals. Menu standards and reimbursement rate changes shift product mix and margins; policy expansions (eg program waivers) support resilience across economic cycles, while cuts or regulatory shifts can trigger abrupt volume declines.
- 30M daily NSLP participants (2023)
- 41M SNAP participants (2023)
- Reimbursement/policy shifts affect margins
- Expansions = steady demand; cuts = sudden volume drops
Tariffs, compliance and labor caps lift food logistics costs despite $1.2T
FDA/USDA traceability and inspection updates (FSMA framework) raise compliance costs and require supplier system changes. Tariffs (eg Section 232 steel 25%) and Red Sea disruptions since 2023 increase landed and logistics costs. IIJA/IRA infrastructure and fleet incentives (IIJA ~$1.2T) improve delivery reliability; labor limits (H-2B cap 66,000; ≈27 states E-Verify; ≈8M job openings) constrain staffing; NSLP ~30M/day, SNAP ~41M (2023) support steady demand.
| Metric | Value |
|---|---|
| Section 232 steel tariff | 25% |
| IIJA total | $1.2T |
| H-2B cap | 66,000 |
| E-Verify states | ≈27 |
| US job openings (2024) | ≈8M |
| NSLP participants (2023) | ≈30M/day |
| SNAP participants (2023) | ≈41M |
What is included in the product
Detailed Word Document
Explores how external macro-environmental factors uniquely affect US Foods across Political, Economic, Social, Technological, Environmental and Legal dimensions; data‑backed trends and forward‑looking insights support executives, consultants and investors in identifying threats, opportunities and scenarios for strategic planning.
Customizable Excel Spreadsheet
Clean, summarized US Foods PESTLE for quick meetings—visually segmented by category, editable for local context, and drop‑in ready for PowerPoints or team alignment.
Economic factors
Food inflation and commodity volatility
Price swings in proteins, dairy, grains and produce drive US Foods cost of goods—beef and pork futures moved roughly 20-30% in 2024 while milk and corn exhibited double-digit volatility, directly raising input costs.
Inflation in 2024–H1 2025 allowed partial price pass-through, but higher retail prices risk volume elasticity as consumers trade down; brief deflationary periods compress gross profit dollars near term.
Active category management and expanded private-label penetration (higher-margin SKUs) have been used to protect margin and stabilize basket price sensitivity.
Restaurant traffic and macro cycles
Consumer spending, employment (US unemployment ~3.7% in 2024) and real wages (real average hourly earnings down ~0.6% YoY in 2024) directly drive operator order frequency; US foodservice sales reached roughly $1.0 trillion in 2024, but downturns push mix toward value SKUs and away from premium items. Independent restaurants are notably more sensitive to demand shocks, while US Foods’ diversified end-markets help buffer regional and segment volatility.
Fuel, freight, and logistics costs
U.S. diesel averaged about $3.92/gal in June 2025 (EIA), directly shaping carrier rates and US Foods fuel-surcharge mechanics. Network optimization — routing, backhauls and distribution center placement — reduces exposure to short-term price spikes and cuts per-delivery costs. High cold-chain intensity makes refrigerated transport more energy sensitive, raising operating leverage on fuel. When fuel stabilizes, customer pricing becomes less volatile and margin forecasting improves.
Interest rates and capital access
Higher policy rates (Fed funds ~5.25% in mid‑2025) raise borrowing costs for fleet, real estate and automation, increasing annual debt service and compressing ROI. Tighter credit reduces operators' ability to open new locations and lowers average order sizes, with small‑business loan originations down roughly 10% YoY in 2024. Rate declines quickly unlock capex and M&A; firms with balance sheet flexibility can invest counter‑cyclically.
- Higher rates: Fed ~5.25% (mid‑2025)
- Credit impact: small‑business originations ≈‑10% YoY (2024)
- Opportunities: rate cuts → capex, M&A
- Defense: balance‑sheet flexibility enables counter‑cyclical investment
Industry consolidation and scale effects
Distributor and supplier consolidation has increased US Foods purchasing leverage and service density, supporting its FY2024 revenue of roughly $33.3 billion and a ~300,000 customer base; scale enables faster private-brand rollout and larger tech investments in logistics and e-commerce. Competitive responses in major metros could compress margins, while M&A integration risk requires preserving service quality and network uptime.
Tariffs, compliance and labor caps lift food logistics costs despite $1.2T
Input-cost volatility (beef/pork +20–30% in 2024; milk/corn double‑digit swings) raised COGS and pressured margins.
Demand elasticities: unemployment ~3.7% (2024), real wages down ~0.6% YoY (2024); foodservice sales ≈$1.0T (2024).
Fuel and logistics: diesel ≈$3.92/gal (Jun 2025) heighten refrigerated transport costs and surcharge pass‑through.
Finance and scale: Fed funds ≈5.25% (mid‑2025); US Foods FY2024 revenue ~$33.3B; ~300,000 customers.
| Metric | Value |
|---|---|
| Beef/Pork 2024 | +20–30% |
| Foodservice 2024 | $1.0T |
| Diesel Jun 2025 | $3.92/gal |
| Fed funds mid‑2025 | ~5.25% |
| US Foods FY2024 | $33.3B; 300k customers |
Same Document Delivered
US Foods PESTLE Analysis
The preview shown here is the exact document you’ll receive after purchase—fully formatted and ready to use. This US Foods PESTLE Analysis examines political, economic, social, technological, legal, and environmental factors affecting the company and its supply chain. It highlights key risks, opportunities, and strategic implications in a concise, actionable format ready for immediate download.











