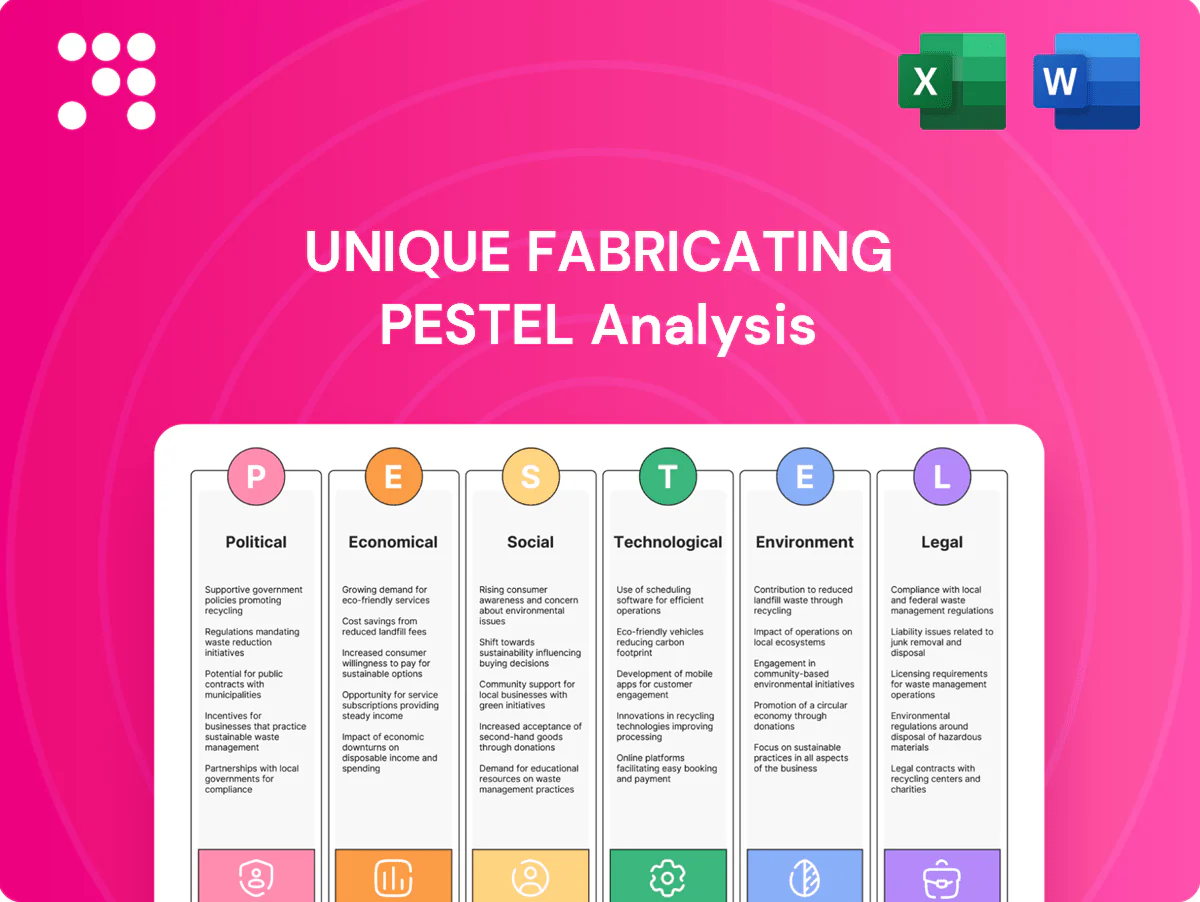
Unique Fabricating PESTLE Analysis

Make Smarter Strategic Decisions with a Complete PESTEL View
Gain decisive insight with our targeted PESTLE Analysis of Unique Fabricating—three to five external forces mapped to real strategic implications for operations, compliance, and growth. Ideal for investors, consultants, and planners, this concise briefing shows where risks and opportunities lie. Purchase the full analysis to access actionable, editable intelligence you can use immediately.
Political factors

Auto industrial policy shifts
Government incentives and mandates—eg. US Inflation Reduction Act funding ~$369 billion and EV tax credits up to $7,500, plus the EU 2035 new‑car zero‑emission mandate—push OEMs toward EV-optimized NVH and thermal designs, reallocating volumes across platforms and suppliers. Unique Fabricating must align materials and capabilities with funded tech; policy reversals or delays can cause rapid demand whiplash.
Trade tariffs and localization
Tariff moves raise input-cost risk: US steel tariffs of 25% and aluminum at 10% since 2018 show how policy can sharply shift sourcing economics for polymers, rubber and components. Build America, Buy America expansions (2021 onward) and local-content rules push tooling and capacity closer to projects and OEMs. Proximity to North American OEMs preserves sales access but requires hedges against cross-border frictions and FX. Diversifying suppliers across NA, EU and APAC reduces exposure to sudden policy shifts.

Infrastructure and logistics investment
Public investment in transport corridors under the $1.2 trillion Infrastructure Investment and Jobs Act can ease freight bottlenecks and cut lead times, while regulatory checks at borders still risk delaying time-sensitive parts. Unique Fabricating should map announced corridor upgrades to plant-network plans and logistics routes. Federal grants, including energy funding from the $369 billion Inflation Reduction Act, can subsidize automation and energy upgrades at facilities.

Healthcare procurement rules
Healthcare procurement rules shape Unique Fabricating sales: the global medical device market was about $612 billion in 2024, and public procurement and reimbursement policies drive institutional demand and pricing; country-specific approvals often add 6–18 months to sales cycles, while alignment with recognized standards (eg ISO, CE, FDA) accelerates adoption; political pressure for supply resilience favors domestic or nearshore suppliers.
- Procurement impact: public/reimbursement-driven demand
- Sales delay: 6–18 months for country approvals
- Standards: ISO/CE/FDA accelerate uptake
- Resilience: policy preference for domestic/nearshore sourcing
Geopolitical supply risk
Incentives and tariffs push EV reshoring, raising material-cost volatility and buffer needs
Government incentives (IRA $369B, EV tax credits up to $7,500; EU 2035 zero‑emission mandate) and infrastructure spending ($1.2T) steer OEMs to EV/medical supply chains, raising demand volatility if policies shift. Tariffs (US steel 25%, Al 10%) and Buy America rules increase nearshoring and input-cost risk. Geopolitical shocks drove 20–35% polymer price swings 2022–24; 60–90 day multi‑region buffers recommended.
| Factor | Metric | Implication | Action |
|---|---|---|---|
| Incentives | IRA $369B, $7,500 EV credit | Demand shift to EV/energy tech | Align materials/capabilities |
| Tariffs | Steel 25%, Al 10% | Higher input costs | Supplier diversification |
| Supply risk | 20–35% price swings | Margin pressure | 60–90d inventory |
What is included in the product
 Detailed Word Document
Explores how macro-environmental factors uniquely affect Unique Fabricating across Political, Economic, Social, Technological, Environmental and Legal dimensions, with data-driven examples and current trends. Designed for executives, consultants and entrepreneurs to identify threats and opportunities, support scenario planning, and be inserted directly into plans or investor materials.

 Customizable Excel Spreadsheet
Condensed PESTLE summary tailored to Unique Fabricating for quick reference in meetings, visually segmented by category, editable for regional or business-line notes, and easily dropped into presentations to align teams and streamline external risk and market-positioning discussions.
Economic factors

Automotive demand cyclicality
Automotive build rates swing with consumer credit, interest rates and employment—U.S. household debt was about $17.2 trillion in Q4 2024 (Federal Reserve), and global light‑vehicle volumes ran near 80 million units in 2024, directly driving order volumes. Platform mix shifts change parts-per-vehicle and content intensity, while flexible capacity helps absorb peaks and troughs. Diversification into appliances and medical reduces revenue volatility across cycles.
Raw material price volatility
Petrochemical-based foams and rubber track inputs closely track oil and gas dynamics; Brent crude averaged roughly $88/barrel in 2024, amplifying feedstock cost swings that in some months moved 20% or more and compressed margins absent indexed pricing. Should-costing and formula pricing with OEMs stabilizes profitability, while strategic stocks and multi-year contracts damp spikes.

Labor availability and cost
Tight skilled-trades markets push wages and overtime higher; 2024 manufacturing average hourly earnings rose about 4% year-over-year, pressuring margins. Targeted training and automation reduce throughput constraints and labor hours. Multi-skill crews boost uptime and faster changeovers. Regional wage differentials guide plant footprint and nearshoring decisions.

Exchange rates and cross-border sales
Exchange rate moves affect both imported resin/rubber costs and export competitiveness, so matching currency of sales and inputs provides natural hedges that reduce FX exposure.
Include pricing clauses with periodic resets to protect margins and adopt simple treasury hedges (for large resin and rubber buys) such as forwards or rolling swaps to cap risk.
- FX-sensitive inputs: match sourcing currency
- Pricing clauses: periodic resets
- Treasury: simple forwards/rolls for big resin/rubber buys
Customer consolidation
OEM and Tier-1 consolidation raises buyer pricing power: top five OEMs accounted for ~40% of global light-vehicle production in 2024, tightening negotiating leverage. Winning core platform awards secures 5–7 year volumes and predictable cashflow. Supplier quality and OTD metrics can reallocate share; many Tier-1s report >50% revenue from their top three customers, so suppliers must broaden platform and sector exposure to mitigate concentration risk.
- BuyerPower: OEMs ~40% market share (top5, 2024)
- PlatformCycle: 5–7 year awards
- ShareShift: quality/OTD drive wins
- Concentration: top3 customers often >50% revenue
Incentives and tariffs push EV reshoring, raising material-cost volatility and buffer needs
Automotive volumes (~80M light vehicles in 2024) and U.S. household debt ~$17.2T drive order swings; platform mix alters content per vehicle. Brent averaged $88/bbl in 2024, feeding resin/rubber cost volatility. Manufacturing wages rose ~4% YoY in 2024; automation eases pressure. OEM top5 ≈40% production, increasing buyer power.
| Metric | 2024 |
|---|---|
| Global LV volumes | ~80M units |
| Brent crude | $88/bbl avg |
| US household debt | $17.2T |
| Manufacturing wage YoY | +4% |
| Top5 OEM share | ~40% |
Preview Before You Purchase
Unique Fabricating PESTLE Analysis
The preview shown here is the exact PESTLE analysis for Unique Fabricating you’ll receive after purchase—fully formatted and ready to use. It covers Political, Economic, Social, Technological, Legal and Environmental factors tailored to the company. The layout and content are professionally structured with actionable insights. After payment you’ll instantly download this same final file.

Product Information
Product Information
Shipping & Returns
Shipping & Returns
Description
Make Smarter Strategic Decisions with a Complete PESTEL View
Gain decisive insight with our targeted PESTLE Analysis of Unique Fabricating—three to five external forces mapped to real strategic implications for operations, compliance, and growth. Ideal for investors, consultants, and planners, this concise briefing shows where risks and opportunities lie. Purchase the full analysis to access actionable, editable intelligence you can use immediately.
Political factors
Auto industrial policy shifts
Government incentives and mandates—eg. US Inflation Reduction Act funding ~$369 billion and EV tax credits up to $7,500, plus the EU 2035 new‑car zero‑emission mandate—push OEMs toward EV-optimized NVH and thermal designs, reallocating volumes across platforms and suppliers. Unique Fabricating must align materials and capabilities with funded tech; policy reversals or delays can cause rapid demand whiplash.
Trade tariffs and localization
Tariff moves raise input-cost risk: US steel tariffs of 25% and aluminum at 10% since 2018 show how policy can sharply shift sourcing economics for polymers, rubber and components. Build America, Buy America expansions (2021 onward) and local-content rules push tooling and capacity closer to projects and OEMs. Proximity to North American OEMs preserves sales access but requires hedges against cross-border frictions and FX. Diversifying suppliers across NA, EU and APAC reduces exposure to sudden policy shifts.
Infrastructure and logistics investment
Public investment in transport corridors under the $1.2 trillion Infrastructure Investment and Jobs Act can ease freight bottlenecks and cut lead times, while regulatory checks at borders still risk delaying time-sensitive parts. Unique Fabricating should map announced corridor upgrades to plant-network plans and logistics routes. Federal grants, including energy funding from the $369 billion Inflation Reduction Act, can subsidize automation and energy upgrades at facilities.
Healthcare procurement rules
Healthcare procurement rules shape Unique Fabricating sales: the global medical device market was about $612 billion in 2024, and public procurement and reimbursement policies drive institutional demand and pricing; country-specific approvals often add 6–18 months to sales cycles, while alignment with recognized standards (eg ISO, CE, FDA) accelerates adoption; political pressure for supply resilience favors domestic or nearshore suppliers.
- Procurement impact: public/reimbursement-driven demand
- Sales delay: 6–18 months for country approvals
- Standards: ISO/CE/FDA accelerate uptake
- Resilience: policy preference for domestic/nearshore sourcing
Geopolitical supply risk
Incentives and tariffs push EV reshoring, raising material-cost volatility and buffer needs
Government incentives (IRA $369B, EV tax credits up to $7,500; EU 2035 zero‑emission mandate) and infrastructure spending ($1.2T) steer OEMs to EV/medical supply chains, raising demand volatility if policies shift. Tariffs (US steel 25%, Al 10%) and Buy America rules increase nearshoring and input-cost risk. Geopolitical shocks drove 20–35% polymer price swings 2022–24; 60–90 day multi‑region buffers recommended.
| Factor | Metric | Implication | Action |
|---|---|---|---|
| Incentives | IRA $369B, $7,500 EV credit | Demand shift to EV/energy tech | Align materials/capabilities |
| Tariffs | Steel 25%, Al 10% | Higher input costs | Supplier diversification |
| Supply risk | 20–35% price swings | Margin pressure | 60–90d inventory |
What is included in the product
Detailed Word Document
Explores how macro-environmental factors uniquely affect Unique Fabricating across Political, Economic, Social, Technological, Environmental and Legal dimensions, with data-driven examples and current trends. Designed for executives, consultants and entrepreneurs to identify threats and opportunities, support scenario planning, and be inserted directly into plans or investor materials.
Customizable Excel Spreadsheet
Condensed PESTLE summary tailored to Unique Fabricating for quick reference in meetings, visually segmented by category, editable for regional or business-line notes, and easily dropped into presentations to align teams and streamline external risk and market-positioning discussions.
Economic factors
Automotive demand cyclicality
Automotive build rates swing with consumer credit, interest rates and employment—U.S. household debt was about $17.2 trillion in Q4 2024 (Federal Reserve), and global light‑vehicle volumes ran near 80 million units in 2024, directly driving order volumes. Platform mix shifts change parts-per-vehicle and content intensity, while flexible capacity helps absorb peaks and troughs. Diversification into appliances and medical reduces revenue volatility across cycles.
Raw material price volatility
Petrochemical-based foams and rubber track inputs closely track oil and gas dynamics; Brent crude averaged roughly $88/barrel in 2024, amplifying feedstock cost swings that in some months moved 20% or more and compressed margins absent indexed pricing. Should-costing and formula pricing with OEMs stabilizes profitability, while strategic stocks and multi-year contracts damp spikes.
Labor availability and cost
Tight skilled-trades markets push wages and overtime higher; 2024 manufacturing average hourly earnings rose about 4% year-over-year, pressuring margins. Targeted training and automation reduce throughput constraints and labor hours. Multi-skill crews boost uptime and faster changeovers. Regional wage differentials guide plant footprint and nearshoring decisions.
Exchange rates and cross-border sales
Exchange rate moves affect both imported resin/rubber costs and export competitiveness, so matching currency of sales and inputs provides natural hedges that reduce FX exposure.
Include pricing clauses with periodic resets to protect margins and adopt simple treasury hedges (for large resin and rubber buys) such as forwards or rolling swaps to cap risk.
- FX-sensitive inputs: match sourcing currency
- Pricing clauses: periodic resets
- Treasury: simple forwards/rolls for big resin/rubber buys
Customer consolidation
OEM and Tier-1 consolidation raises buyer pricing power: top five OEMs accounted for ~40% of global light-vehicle production in 2024, tightening negotiating leverage. Winning core platform awards secures 5–7 year volumes and predictable cashflow. Supplier quality and OTD metrics can reallocate share; many Tier-1s report >50% revenue from their top three customers, so suppliers must broaden platform and sector exposure to mitigate concentration risk.
- BuyerPower: OEMs ~40% market share (top5, 2024)
- PlatformCycle: 5–7 year awards
- ShareShift: quality/OTD drive wins
- Concentration: top3 customers often >50% revenue
Incentives and tariffs push EV reshoring, raising material-cost volatility and buffer needs
Automotive volumes (~80M light vehicles in 2024) and U.S. household debt ~$17.2T drive order swings; platform mix alters content per vehicle. Brent averaged $88/bbl in 2024, feeding resin/rubber cost volatility. Manufacturing wages rose ~4% YoY in 2024; automation eases pressure. OEM top5 ≈40% production, increasing buyer power.
| Metric | 2024 |
|---|---|
| Global LV volumes | ~80M units |
| Brent crude | $88/bbl avg |
| US household debt | $17.2T |
| Manufacturing wage YoY | +4% |
| Top5 OEM share | ~40% |
Preview Before You Purchase
Unique Fabricating PESTLE Analysis
The preview shown here is the exact PESTLE analysis for Unique Fabricating you’ll receive after purchase—fully formatted and ready to use. It covers Political, Economic, Social, Technological, Legal and Environmental factors tailored to the company. The layout and content are professionally structured with actionable insights. After payment you’ll instantly download this same final file.











