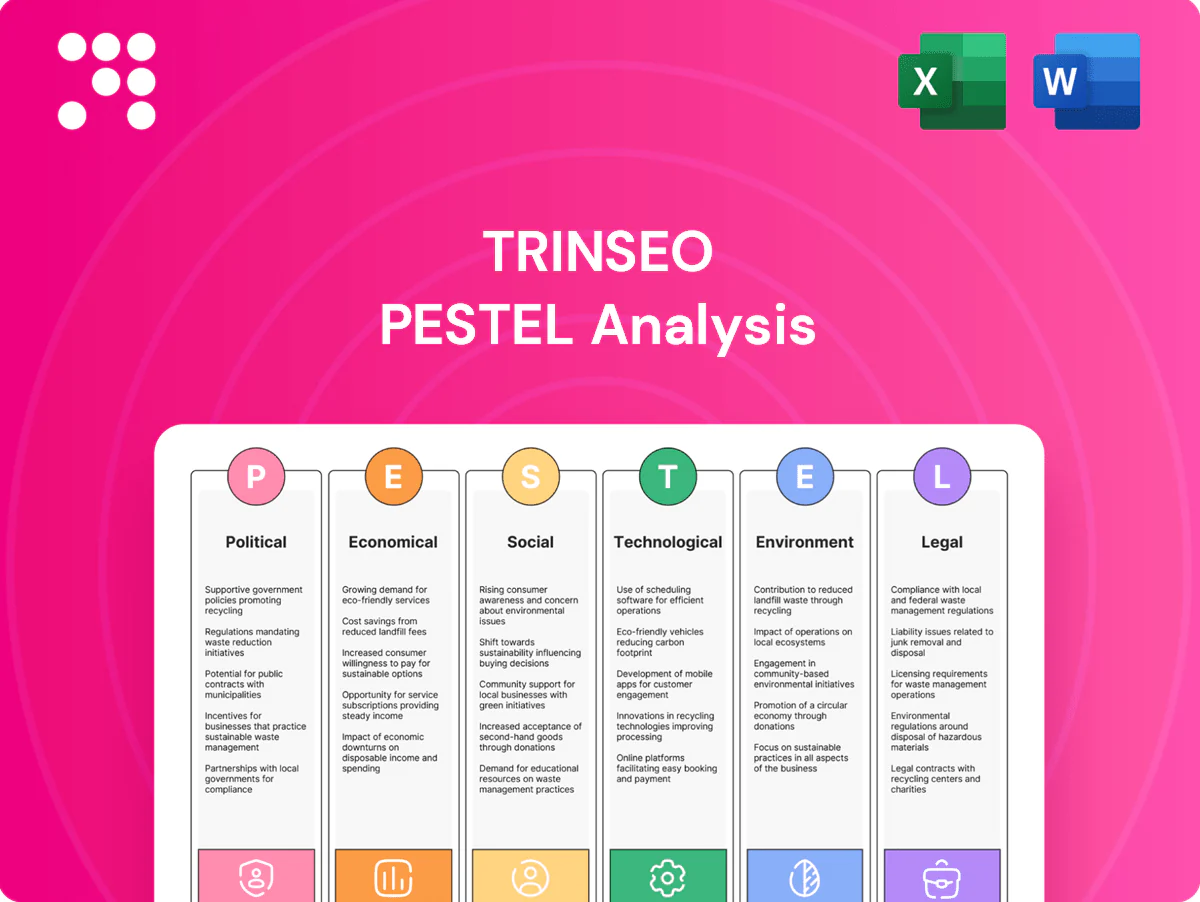
Trinseo PESTLE Analysis

Make Smarter Strategic Decisions with a Complete PESTEL View
Unlock strategic clarity with our focused PESTLE Analysis of Trinseo—highlighting regulatory pressures, macroeconomic trends, technological shifts, and sustainability risks shaping its outlook. Ideal for investors and strategists, this concise briefing points to key opportunities and threats. Purchase the full report for the complete, actionable breakdown.
Political factors

Trade policy volatility
Trinseo (NYSE:TSE) global footprint exposes it to tariffs, quotas and shifting trade agreements across the US, EU and Asia, including tariffs up to 25% on many China-origin goods that can spike input costs. Such policy moves can compress margins on exports and alter cost pass-through for specialty polymers. Diversifying production and sourcing reduces exposure to tariff shocks. Active government affairs and monitoring help anticipate regime changes and reduce disruption.
Industrial policy & subsidies
Government incentives such as the US Inflation Reduction Act’s roughly $369 billion in clean energy and manufacturing support and the EU’s €723.8 billion NextGenerationEU fund strongly influence Trinseo site selection and capex timing. Competing for grants and tax credits can materially lower project risk and cost of capital. Policy support is accelerating bio-based and recycling investments, aligned with EU plastic packaging recycling targets of 50% by 2025. Monitoring eligibility criteria is critical to capture these benefits.

Geopolitical tensions
Geopolitical tensions and sanctions create regional conflicts and chokepoints that disrupt feedstock flows and logistics; container spot rates surged over 300% in 2020–21 and still remain volatile, inflating transport risk. Customers in autos and construction may delay orders amid uncertainty, pressuring volumes and working capital. Scenario planning and inventory buffers preserve service levels, while insurance and alternative routes cut exposure and recovery time.

Energy security policy
- Policy shifts → price/availability volatility
- Renewable incentives lower long-term power costs
- Hedging and PPAs align with trajectories
Localization & procurement rules
Localization and procurement rules shape where Trinseo locates specialty-material production—its North America, Europe and Asia manufacturing footprint lets the company meet domestic sourcing requirements and access infrastructure and medical contracts tied to the US $1.2 trillion Bipartisan Infrastructure Law.
- Local content mandates: secure public contracts
- Regionalization: lowers geopolitical exposure
- Network redesign: trade-off cost vs compliance
Tariff risk up to 25%, container costs +300%, energy gaps
Trinseo faces tariff risk (up to 25% on China-origin goods) and supply shocks from geopolitics; container rates jumped >300% in 2020–21 and remain volatile. Energy costs vary: EU industrial €0.18/kWh (2024) vs US ~$0.075/kWh, TTF ~€35/MWh, affecting feedstock and margins. Major incentives (US IRA $369B; NextGenerationEU €723.8B) and US $1.2T infrastructure law shift capex toward decarbonization and localization.
| Factor | 2024/25 Data |
|---|---|
| Tariffs | up to 25% |
| Container volatility | +300% peak (2020–21) |
| EU industrial power | €0.18/kWh (2024) |
| US industrial power | $0.075/kWh (2024) |
| TTF gas | ~€35/MWh |
| Incentives | IRA $369B; NextGenerationEU €723.8B; US infra $1.2T |
What is included in the product
 Detailed Word Document
Explores how Political, Economic, Social, Technological, Environmental and Legal forces specifically impact Trinseo, with data-backed trends and forward-looking insights to identify risks and opportunities for executives and investors; delivered in clean, report-ready format to support strategy, scenario planning and funding pitches.

 Customizable Excel Spreadsheet
Visually segmented Trinseo PESTLE summary allowing quick interpretation at a glance and easy insertion into presentations or planning sessions to align teams and streamline strategic discussions.
Economic factors

End-market cyclicality
End-market cyclicality—driven largely by automotive and construction demand—creates pronounced volume swings; US light-vehicle sales were about 14.9m units in 2024 and US housing starts roughly 1.45m, highlighting exposure to cycles. Slowdowns compress utilization and margins while upcycles reward capacity readiness; diversification into medical and consumer goods and flexible cost structures smooth volatility.
Feedstock & energy costs
Styrene, butadiene and latex precursors track petro and energy markets, with Brent crude around 82 USD/bbl in June 2025, so feedstock swings directly affect raw-material costs. Sudden price spikes can compress spreads when product pricing lags, pressuring margins. Formula pricing and active hedging programs help stabilize profitability and cash flow. Diversifying suppliers and feedstock sources improves operational resilience and reduces single-supplier risk.

FX and interest rates
Multi-currency revenues and costs create translation and transaction risk for Trinseo, with FX volatility able to swing reported results and margins. Benchmark interest rates remained near multi-year highs (around 5%) into 2024–25, increasing financing costs and pressuring customer capex plans. Trinseo relies on natural hedges, uses derivatives to cover residual gaps, and maintains liquidity buffers to cushion rate shocks.

Global growth dispersion
Regional GDP divergences are shifting Trinseo's sales mix and plant loads as emerging markets are forecast to grow about 4.8% in 2025 versus advanced economies at ~1.6% (IMF Apr 2025), driving faster demand in construction and consumer goods; redirecting capacity to higher-growth regions can lift ROIC, while demand sensing and near‑real‑time analytics optimize inventory placement and reduce stockouts.
- Regional GDP gap: EM 4.8% vs advanced 1.6% (IMF Apr 2025)
- Sales mix impact: higher EM share raises plant utilization
- ROIC upside: allocate capacity to faster-growing regions
- Inventory: demand sensing improves placement, lowers working capital
Customer consolidation
Customer consolidation gives large OEMs and converters disproportionate pricing power and enforce strict service levels; strategic partnerships secure volumes but compress margins, while differentiated sustainable grades help defend pricing and margins; tailored formulation and technical support raise switching costs and protect revenue streams.
- Pricing power: large buyers set terms
- Margins: long-term contracts lock volumes, press margins
- Differentiation: sustainable grades defend price
- Switching costs: tailored solutions increase loyalty
Tariff risk up to 25%, container costs +300%, energy gaps
End-market cyclicality (US light‑vehicle 14.9m 2024; US housing starts 1.45m) and feedstock volatility (Brent ~82 USD/bbl Jun 2025) drive volume swings and margin pressure; rates near 5% raise financing costs and capex sensitivity. EM growth 4.8% vs advanced 1.6% (IMF Apr 2025) shifts mix to faster markets; FX and customer consolidation amplify translation and pricing risks.
| Metric | Value |
|---|---|
| US LV sales 2024 | 14.9m |
| US housing starts | 1.45m |
| Brent (Jun 2025) | ~82 USD/bbl |
| Global growth (IMF Apr 2025) | EM 4.8% / Adv 1.6% |
| Benchmark rates | ~5% |
Same Document Delivered
Trinseo PESTLE Analysis
The preview shown here is the exact document you’ll receive after purchase—fully formatted and ready to use. This Trinseo PESTLE Analysis delivers the same comprehensive content, structure, and professional layout visible in the preview. No placeholders or teasers—download the exact file immediately after payment.

Product Information
Product Information
Shipping & Returns
Shipping & Returns
Description
Make Smarter Strategic Decisions with a Complete PESTEL View
Unlock strategic clarity with our focused PESTLE Analysis of Trinseo—highlighting regulatory pressures, macroeconomic trends, technological shifts, and sustainability risks shaping its outlook. Ideal for investors and strategists, this concise briefing points to key opportunities and threats. Purchase the full report for the complete, actionable breakdown.
Political factors
Trade policy volatility
Trinseo (NYSE:TSE) global footprint exposes it to tariffs, quotas and shifting trade agreements across the US, EU and Asia, including tariffs up to 25% on many China-origin goods that can spike input costs. Such policy moves can compress margins on exports and alter cost pass-through for specialty polymers. Diversifying production and sourcing reduces exposure to tariff shocks. Active government affairs and monitoring help anticipate regime changes and reduce disruption.
Industrial policy & subsidies
Government incentives such as the US Inflation Reduction Act’s roughly $369 billion in clean energy and manufacturing support and the EU’s €723.8 billion NextGenerationEU fund strongly influence Trinseo site selection and capex timing. Competing for grants and tax credits can materially lower project risk and cost of capital. Policy support is accelerating bio-based and recycling investments, aligned with EU plastic packaging recycling targets of 50% by 2025. Monitoring eligibility criteria is critical to capture these benefits.
Geopolitical tensions
Geopolitical tensions and sanctions create regional conflicts and chokepoints that disrupt feedstock flows and logistics; container spot rates surged over 300% in 2020–21 and still remain volatile, inflating transport risk. Customers in autos and construction may delay orders amid uncertainty, pressuring volumes and working capital. Scenario planning and inventory buffers preserve service levels, while insurance and alternative routes cut exposure and recovery time.
Energy security policy
- Policy shifts → price/availability volatility
- Renewable incentives lower long-term power costs
- Hedging and PPAs align with trajectories
Localization & procurement rules
Localization and procurement rules shape where Trinseo locates specialty-material production—its North America, Europe and Asia manufacturing footprint lets the company meet domestic sourcing requirements and access infrastructure and medical contracts tied to the US $1.2 trillion Bipartisan Infrastructure Law.
- Local content mandates: secure public contracts
- Regionalization: lowers geopolitical exposure
- Network redesign: trade-off cost vs compliance
Tariff risk up to 25%, container costs +300%, energy gaps
Trinseo faces tariff risk (up to 25% on China-origin goods) and supply shocks from geopolitics; container rates jumped >300% in 2020–21 and remain volatile. Energy costs vary: EU industrial €0.18/kWh (2024) vs US ~$0.075/kWh, TTF ~€35/MWh, affecting feedstock and margins. Major incentives (US IRA $369B; NextGenerationEU €723.8B) and US $1.2T infrastructure law shift capex toward decarbonization and localization.
| Factor | 2024/25 Data |
|---|---|
| Tariffs | up to 25% |
| Container volatility | +300% peak (2020–21) |
| EU industrial power | €0.18/kWh (2024) |
| US industrial power | $0.075/kWh (2024) |
| TTF gas | ~€35/MWh |
| Incentives | IRA $369B; NextGenerationEU €723.8B; US infra $1.2T |
What is included in the product
Detailed Word Document
Explores how Political, Economic, Social, Technological, Environmental and Legal forces specifically impact Trinseo, with data-backed trends and forward-looking insights to identify risks and opportunities for executives and investors; delivered in clean, report-ready format to support strategy, scenario planning and funding pitches.
Customizable Excel Spreadsheet
Visually segmented Trinseo PESTLE summary allowing quick interpretation at a glance and easy insertion into presentations or planning sessions to align teams and streamline strategic discussions.
Economic factors
End-market cyclicality
End-market cyclicality—driven largely by automotive and construction demand—creates pronounced volume swings; US light-vehicle sales were about 14.9m units in 2024 and US housing starts roughly 1.45m, highlighting exposure to cycles. Slowdowns compress utilization and margins while upcycles reward capacity readiness; diversification into medical and consumer goods and flexible cost structures smooth volatility.
Feedstock & energy costs
Styrene, butadiene and latex precursors track petro and energy markets, with Brent crude around 82 USD/bbl in June 2025, so feedstock swings directly affect raw-material costs. Sudden price spikes can compress spreads when product pricing lags, pressuring margins. Formula pricing and active hedging programs help stabilize profitability and cash flow. Diversifying suppliers and feedstock sources improves operational resilience and reduces single-supplier risk.
FX and interest rates
Multi-currency revenues and costs create translation and transaction risk for Trinseo, with FX volatility able to swing reported results and margins. Benchmark interest rates remained near multi-year highs (around 5%) into 2024–25, increasing financing costs and pressuring customer capex plans. Trinseo relies on natural hedges, uses derivatives to cover residual gaps, and maintains liquidity buffers to cushion rate shocks.
Global growth dispersion
Regional GDP divergences are shifting Trinseo's sales mix and plant loads as emerging markets are forecast to grow about 4.8% in 2025 versus advanced economies at ~1.6% (IMF Apr 2025), driving faster demand in construction and consumer goods; redirecting capacity to higher-growth regions can lift ROIC, while demand sensing and near‑real‑time analytics optimize inventory placement and reduce stockouts.
- Regional GDP gap: EM 4.8% vs advanced 1.6% (IMF Apr 2025)
- Sales mix impact: higher EM share raises plant utilization
- ROIC upside: allocate capacity to faster-growing regions
- Inventory: demand sensing improves placement, lowers working capital
Customer consolidation
Customer consolidation gives large OEMs and converters disproportionate pricing power and enforce strict service levels; strategic partnerships secure volumes but compress margins, while differentiated sustainable grades help defend pricing and margins; tailored formulation and technical support raise switching costs and protect revenue streams.
- Pricing power: large buyers set terms
- Margins: long-term contracts lock volumes, press margins
- Differentiation: sustainable grades defend price
- Switching costs: tailored solutions increase loyalty
Tariff risk up to 25%, container costs +300%, energy gaps
End-market cyclicality (US light‑vehicle 14.9m 2024; US housing starts 1.45m) and feedstock volatility (Brent ~82 USD/bbl Jun 2025) drive volume swings and margin pressure; rates near 5% raise financing costs and capex sensitivity. EM growth 4.8% vs advanced 1.6% (IMF Apr 2025) shifts mix to faster markets; FX and customer consolidation amplify translation and pricing risks.
| Metric | Value |
|---|---|
| US LV sales 2024 | 14.9m |
| US housing starts | 1.45m |
| Brent (Jun 2025) | ~82 USD/bbl |
| Global growth (IMF Apr 2025) | EM 4.8% / Adv 1.6% |
| Benchmark rates | ~5% |
Same Document Delivered
Trinseo PESTLE Analysis
The preview shown here is the exact document you’ll receive after purchase—fully formatted and ready to use. This Trinseo PESTLE Analysis delivers the same comprehensive content, structure, and professional layout visible in the preview. No placeholders or teasers—download the exact file immediately after payment.











