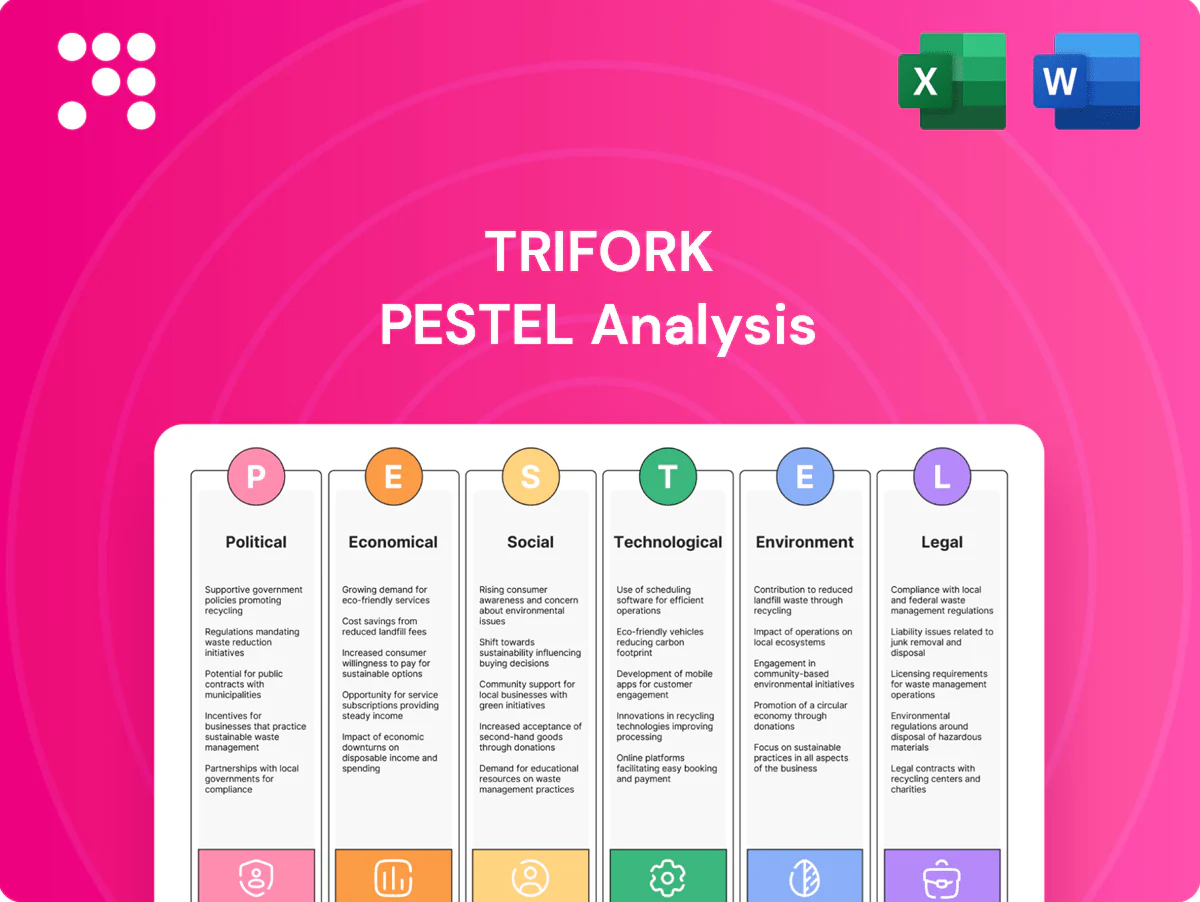
Trifork PESTLE Analysis

Make Smarter Strategic Decisions with a Complete PESTEL View
Unlock how political, economic, social, technological, legal and environmental forces are shaping Trifork’s trajectory with our concise PESTLE overview—perfect for investors and strategists. Dive deeper into risks and opportunities with the full, fully editable analysis. Purchase now for instant, actionable intelligence.
Political factors

Public-sector digital priorities
Governments drive funding for e-government, health IT and digital justice; EU Digital Europe Programme (€7.5bn for 2021–2027) and national recovery plans channel multi-year procurement. Trifork’s public-client exposure links its pipeline to policy cycles and budgets, making revenues sensitive to electoral shifts that can reallocate spending and alter project scopes. Proactive alignment with national and EU digital strategies can secure framework agreements lasting 3–5 years.
Geopolitical supply chain risk
Geopolitical supply-chain risk threatens cloud hardware, specialized talent pools and vendor dependencies—top-3 cloud providers hold roughly 65-70% of market share, concentrating exposure. Export controls since 2022 have sharply limited advanced GPU and encryption component flows to some regions, while Taiwan and South Korea supply >70% of advanced foundry capacity. Trifork must diversify suppliers and regions and run scenario planning to protect 99.9% SLA commitments.

EU funding and initiatives
EU programs such as Horizon Europe (budget ~95.5bn EUR 2021–27) and Digital Europe (budget ~7.5bn EUR 2021–27) catalyze demand for innovation projects and platform adoption across member states. Participation can co-finance Trifork R&D and accelerate public-sector deployments, though consortium management and compliance increase overhead and project lead times. Targeted bids unlock cross-border public-sector engagements and procurement pathways.

Data sovereignty and localization
National mandates for data residency drive cloud architecture decisions, notably under GDPR across 27 EU states and strict regimes such as China and Russia. Trifork’s multi-cloud and sovereign-cloud patterns position it to win regulated tenders in healthcare and finance. Misalignment risks disqualification or costly rework during procurement. Clear data governance blueprints reduce political scrutiny and accelerate approvals.
- Data residency: GDPR covers 27 EU states
- Competitive edge: sovereign cloud for regulated tenders
- Risk: non-compliance can disqualify bids or force rework
- Mitigation: governance blueprints lower political scrutiny
Cybersecurity and critical infrastructure
States now classify healthcare, finance and public services as critical infrastructure, driving stricter national rules such as the EU NIS2 affecting about 42,000 entities and 24-hour incident reporting; higher threat levels boost demand for zero-trust, SOC and IR capabilities, creating an opportunity for Trifork to sell policy-aligned managed security services.
- Critical sectors: healthcare, finance, public services
- NIS2: ~42,000 entities, 24h reporting
- Demand: zero-trust, SOC, incident response
- Opportunity: Trifork managed security services
EU funding, GDPR and NIS2 escalate sovereign‑cloud demand amid concentrated cloud market
Governments fund e‑government via Digital Europe (€7.5bn) and Horizon Europe (€95.5bn), tying Trifork revenues to policy cycles and 3–5yr framework agreements. GDPR/data‑residency and NIS2 (~42,000 entities) boost sovereign‑cloud and compliance demand. Cloud market concentration (65–70%) and export controls raise supplier/geopolitical risk.
| Metric | Value |
|---|---|
| Digital Europe | €7.5bn (2021–27) |
| Horizon Europe | €95.5bn (2021–27) |
| Cloud concentration | 65–70% |
| NIS2 scope | ~42,000 entities |
What is included in the product
 Detailed Word Document
Explores how external macro-environmental factors uniquely affect Trifork across six dimensions—Political, Economic, Social, Technological, Environmental, and Legal—each backed by current data and trends to highlight risks and opportunities. Designed for executives and investors, the analysis offers detailed sub-points, forward-looking insights, and clean formatting ready for reports, decks, or scenario planning.

 Customizable Excel Spreadsheet
A concise, visually segmented PESTLE summary that can be dropped into presentations, edited with region- or business-specific notes, and quickly shared across teams to streamline external risk assessment and market-position discussions.
Economic factors

IT spending cycles
Macro slowdowns often push back discretionary transformation programs, even as Gartner estimated global IT spending at about $4.7 trillion in 2024 and forecast growth into 2025, keeping resilience and productivity projects prioritized. Trifork’s blend of consulting, development and operations smooths revenue volatility by shifting clients from one-off projects to continuous delivery. Multi-year managed services drive recurring cash flow and reduced churn. Flexible pricing and outcome-based models improve win rates when budgets tighten.
Talent costs and inflation
Wage inflation for engineers (around 6–8% YoY in 2024–25) is pressuring Trifork margins, forcing tighter project pricing and utilization targets. Nearshore hubs and delivery pyramids can lower labour cost-to-value by roughly 25–40% versus onshore delivery, preserving competitiveness. Rate card updates must reflect these market moves—insufficient increases erode margins, excessive ones hit demand. Investment in automation and reusable accelerators (raising utilization 5–10%) preserves gross margin by a few percentage points.

Currency fluctuations
A global Trifork footprint exposes revenue and costs to FX swings across EUR, USD and SEK markets. The Danish krone's peg to the euro narrows EUR/DKK volatility, while local delivery and multi‑currency contracts provide natural hedges. Formal hedging policies stabilise cash flows for capex and M&A. Transparent FX reporting supports investor confidence on Nasdaq Copenhagen.

Cloud and AI ROI scrutiny
Clients now demand measurable ROI from cloud modernization and AI; FinOps Foundation (2024) reports roughly 30% average wasted cloud spend, making clear business cases and KPI baselines critical to approvals. Outcome-based, phased engagements and case-backed playbooks reduce adoption risk and, per vendor reports, can shorten sales cycles materially.
- ROI-first
- FinOps-driven
- Phased outcomes
- Playbook-backed
M&A and partnership dynamics
Industry consolidation reshapes Trifork competitive positioning and capability breadth, with European software deal activity remaining robust into 2024. Selective acquisitions can close gaps in AI, cybersecurity and regulated sectors; hyperscaler market shares (2024 est: AWS ~33%, Azure ~23%, GCP ~11%) and ISV alliances materially drive deal flow. Rigorous integration discipline is critical to preserve culture and delivery quality.
- Consolidation: impacts market share
- Acquisitions: target AI/cyber/regulation
- Hyperscalers: drive pipeline (AWS/Azure/GCP)
- Integration: protects culture & delivery
EU funding, GDPR and NIS2 escalate sovereign‑cloud demand amid concentrated cloud market
Macro IT spend ~$4.7T (2024) keeps resilience programs prioritized; wage inflation 6–8% (2024–25) pressures margins while nearshore can cut labour cost-to-value ~25–40%. FinOps finds ~30% cloud waste (2024) making ROI-driven, outcome-based deals essential; hyperscaler share (2024 est) AWS 33% / Azure 23% / GCP 11% shapes partnerships and pipeline.
| Metric | Value |
|---|---|
| Global IT spend (2024) | $4.7T |
| Engineer wage inflation (2024–25) | 6–8% |
| Cloud waste (FinOps 2024) | ~30% |
| Hyperscaler share (2024) | AWS33%/Azure23%/GCP11% |
Preview the Actual Deliverable
Trifork PESTLE Analysis
The Trifork PESTLE Analysis preview shown here is the exact document you’ll receive after purchase—fully formatted and professionally structured. It contains the complete political, economic, social, technological, legal, and environmental assessments as displayed. No placeholders or teasers—this is the final, ready-to-use file available for immediate download.

Product Information
Product Information
Shipping & Returns
Shipping & Returns
Description
Make Smarter Strategic Decisions with a Complete PESTEL View
Unlock how political, economic, social, technological, legal and environmental forces are shaping Trifork’s trajectory with our concise PESTLE overview—perfect for investors and strategists. Dive deeper into risks and opportunities with the full, fully editable analysis. Purchase now for instant, actionable intelligence.
Political factors
Public-sector digital priorities
Governments drive funding for e-government, health IT and digital justice; EU Digital Europe Programme (€7.5bn for 2021–2027) and national recovery plans channel multi-year procurement. Trifork’s public-client exposure links its pipeline to policy cycles and budgets, making revenues sensitive to electoral shifts that can reallocate spending and alter project scopes. Proactive alignment with national and EU digital strategies can secure framework agreements lasting 3–5 years.
Geopolitical supply chain risk
Geopolitical supply-chain risk threatens cloud hardware, specialized talent pools and vendor dependencies—top-3 cloud providers hold roughly 65-70% of market share, concentrating exposure. Export controls since 2022 have sharply limited advanced GPU and encryption component flows to some regions, while Taiwan and South Korea supply >70% of advanced foundry capacity. Trifork must diversify suppliers and regions and run scenario planning to protect 99.9% SLA commitments.
EU funding and initiatives
EU programs such as Horizon Europe (budget ~95.5bn EUR 2021–27) and Digital Europe (budget ~7.5bn EUR 2021–27) catalyze demand for innovation projects and platform adoption across member states. Participation can co-finance Trifork R&D and accelerate public-sector deployments, though consortium management and compliance increase overhead and project lead times. Targeted bids unlock cross-border public-sector engagements and procurement pathways.
Data sovereignty and localization
National mandates for data residency drive cloud architecture decisions, notably under GDPR across 27 EU states and strict regimes such as China and Russia. Trifork’s multi-cloud and sovereign-cloud patterns position it to win regulated tenders in healthcare and finance. Misalignment risks disqualification or costly rework during procurement. Clear data governance blueprints reduce political scrutiny and accelerate approvals.
- Data residency: GDPR covers 27 EU states
- Competitive edge: sovereign cloud for regulated tenders
- Risk: non-compliance can disqualify bids or force rework
- Mitigation: governance blueprints lower political scrutiny
Cybersecurity and critical infrastructure
States now classify healthcare, finance and public services as critical infrastructure, driving stricter national rules such as the EU NIS2 affecting about 42,000 entities and 24-hour incident reporting; higher threat levels boost demand for zero-trust, SOC and IR capabilities, creating an opportunity for Trifork to sell policy-aligned managed security services.
- Critical sectors: healthcare, finance, public services
- NIS2: ~42,000 entities, 24h reporting
- Demand: zero-trust, SOC, incident response
- Opportunity: Trifork managed security services
EU funding, GDPR and NIS2 escalate sovereign‑cloud demand amid concentrated cloud market
Governments fund e‑government via Digital Europe (€7.5bn) and Horizon Europe (€95.5bn), tying Trifork revenues to policy cycles and 3–5yr framework agreements. GDPR/data‑residency and NIS2 (~42,000 entities) boost sovereign‑cloud and compliance demand. Cloud market concentration (65–70%) and export controls raise supplier/geopolitical risk.
| Metric | Value |
|---|---|
| Digital Europe | €7.5bn (2021–27) |
| Horizon Europe | €95.5bn (2021–27) |
| Cloud concentration | 65–70% |
| NIS2 scope | ~42,000 entities |
What is included in the product
Detailed Word Document
Explores how external macro-environmental factors uniquely affect Trifork across six dimensions—Political, Economic, Social, Technological, Environmental, and Legal—each backed by current data and trends to highlight risks and opportunities. Designed for executives and investors, the analysis offers detailed sub-points, forward-looking insights, and clean formatting ready for reports, decks, or scenario planning.
Customizable Excel Spreadsheet
A concise, visually segmented PESTLE summary that can be dropped into presentations, edited with region- or business-specific notes, and quickly shared across teams to streamline external risk assessment and market-position discussions.
Economic factors
IT spending cycles
Macro slowdowns often push back discretionary transformation programs, even as Gartner estimated global IT spending at about $4.7 trillion in 2024 and forecast growth into 2025, keeping resilience and productivity projects prioritized. Trifork’s blend of consulting, development and operations smooths revenue volatility by shifting clients from one-off projects to continuous delivery. Multi-year managed services drive recurring cash flow and reduced churn. Flexible pricing and outcome-based models improve win rates when budgets tighten.
Talent costs and inflation
Wage inflation for engineers (around 6–8% YoY in 2024–25) is pressuring Trifork margins, forcing tighter project pricing and utilization targets. Nearshore hubs and delivery pyramids can lower labour cost-to-value by roughly 25–40% versus onshore delivery, preserving competitiveness. Rate card updates must reflect these market moves—insufficient increases erode margins, excessive ones hit demand. Investment in automation and reusable accelerators (raising utilization 5–10%) preserves gross margin by a few percentage points.
Currency fluctuations
A global Trifork footprint exposes revenue and costs to FX swings across EUR, USD and SEK markets. The Danish krone's peg to the euro narrows EUR/DKK volatility, while local delivery and multi‑currency contracts provide natural hedges. Formal hedging policies stabilise cash flows for capex and M&A. Transparent FX reporting supports investor confidence on Nasdaq Copenhagen.
Cloud and AI ROI scrutiny
Clients now demand measurable ROI from cloud modernization and AI; FinOps Foundation (2024) reports roughly 30% average wasted cloud spend, making clear business cases and KPI baselines critical to approvals. Outcome-based, phased engagements and case-backed playbooks reduce adoption risk and, per vendor reports, can shorten sales cycles materially.
- ROI-first
- FinOps-driven
- Phased outcomes
- Playbook-backed
M&A and partnership dynamics
Industry consolidation reshapes Trifork competitive positioning and capability breadth, with European software deal activity remaining robust into 2024. Selective acquisitions can close gaps in AI, cybersecurity and regulated sectors; hyperscaler market shares (2024 est: AWS ~33%, Azure ~23%, GCP ~11%) and ISV alliances materially drive deal flow. Rigorous integration discipline is critical to preserve culture and delivery quality.
- Consolidation: impacts market share
- Acquisitions: target AI/cyber/regulation
- Hyperscalers: drive pipeline (AWS/Azure/GCP)
- Integration: protects culture & delivery
EU funding, GDPR and NIS2 escalate sovereign‑cloud demand amid concentrated cloud market
Macro IT spend ~$4.7T (2024) keeps resilience programs prioritized; wage inflation 6–8% (2024–25) pressures margins while nearshore can cut labour cost-to-value ~25–40%. FinOps finds ~30% cloud waste (2024) making ROI-driven, outcome-based deals essential; hyperscaler share (2024 est) AWS 33% / Azure 23% / GCP 11% shapes partnerships and pipeline.
| Metric | Value |
|---|---|
| Global IT spend (2024) | $4.7T |
| Engineer wage inflation (2024–25) | 6–8% |
| Cloud waste (FinOps 2024) | ~30% |
| Hyperscaler share (2024) | AWS33%/Azure23%/GCP11% |
Preview the Actual Deliverable
Trifork PESTLE Analysis
The Trifork PESTLE Analysis preview shown here is the exact document you’ll receive after purchase—fully formatted and professionally structured. It contains the complete political, economic, social, technological, legal, and environmental assessments as displayed. No placeholders or teasers—this is the final, ready-to-use file available for immediate download.











