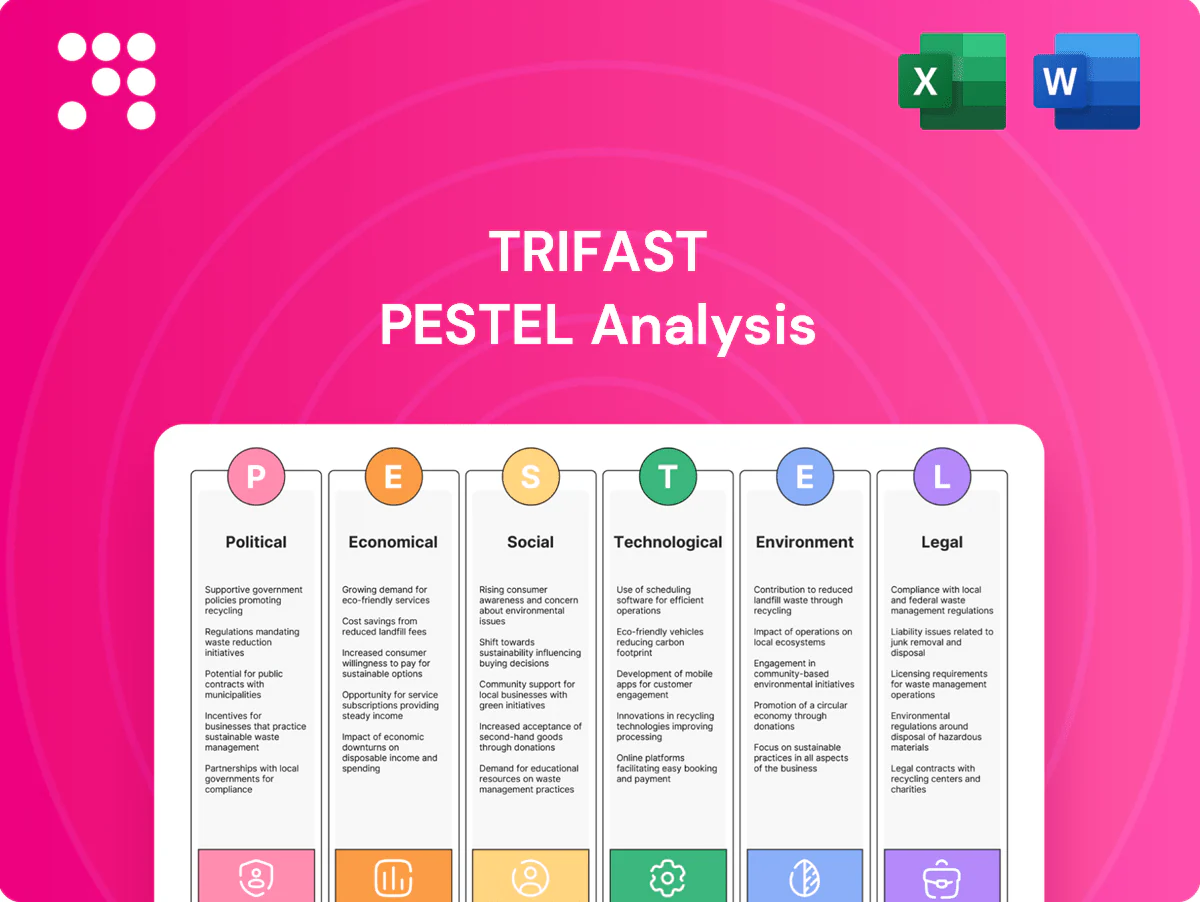
Trifast PESTLE Analysis

Make Smarter Strategic Decisions with a Complete PESTEL View
Gain a strategic advantage with our PESTLE Analysis of Trifast—concise, expert-led insight into the political, economic, social, technological, legal, and environmental forces shaping its future. Ideal for investors, consultants, and executives, this report translates external risks and opportunities into actionable strategy. Purchase the full version to download the complete, editable analysis and make smarter decisions now.
Political factors

Trade policies and tariffs
Fasteners face tariff exposure across the US, EU, UK and Asia, driving landed-cost swings that can exceed 10% for significant shipments and altering pricing competitively; US anti-dumping cases have seen duties as high as 374.8% on certain Chinese fasteners. Changes in anti-dumping duties can rapidly shift sourcing economics, prompting agile supplier rebalancing and contract repricing. Active monitoring and industry association lobbying (e.g., British Metalworking Tools Association inputs) can pre-empt adverse classifications.
Geopolitical supply risks
Regional tensions and sanctions threaten steel and plating-chemical flows and key logistics lanes, raising input-cost volatility seen in 2023–24 when steel spreads swung by over 20%. Multi-region manufacturing and dual-sourcing cut single-point exposure, with industry buffer-stock norms of 30–90 days. Scenario planning for rerouting and 60-day buffer stocks preserves service levels. Clear customer communication frameworks sustain confidence during disruptions.

Industrial policy and incentives
Government incentives such as the US Inflation Reduction Act (circa $369bn) and the CHIPS and Science Act (~$52bn) create capex co‑funding opportunities for advanced manufacturing and EV supply chains. Locating plants in incentive zones—for example the UK’s eight freeports—can materially improve ROIC. Compliance with local content rules secures access to strategic programs and aligning with national reshoring agendas strengthens OEM partnerships.

Public procurement and standards
State-backed infrastructure and defence programs demand strict sourcing and traceability, affecting Trifast’s supply-chain controls; public procurement represents about 12% of global GDP (World Bank). UK defence spending is around 2.2% of GDP (≈£50bn in 2024), so political cycles drive project timing and volumes. Certification alignment raises tender eligibility while transparent ESG reporting can be a decisive differentiator in award decisions.
- Traceability mandatory for defence tenders
- Public procurement ≈12% of global GDP (World Bank)
- UK defence spend ≈2.2% GDP (~£50bn, 2024)
- Certification and ESG increase tender success
Labor and immigration policies
Labor and immigration policies determine access to skilled machinists and engineers for Trifast; visa and apprenticeship support directly affect ramp-up speed in growth regions and tight controls can delay capacity expansion. Proactive training pipelines and apprenticeships reduce exposure to policy swings, while cross-border talent mobility improves technical service responsiveness and uptime.
374.8% duties and > 20% steel swings force reshoring, 30-90 day stock buffers
Tariff and anti-dumping shifts (duties up to 374.8% on some Chinese fasteners) create >10% landed-cost swings, forcing rapid sourcing shifts and contract repricing. Regional sanctions and logistic risks drove 2023–24 steel spread volatility >20%, prompting 30–90 day buffer norms. Incentives (US IRA $369bn; CHIPS ~$52bn) and UK freeports aid reshoring; UK defence spend ≈£50bn (2.2% GDP, 2024) boosts certified-supply demand.
| Metric | Value |
|---|---|
| Max anti-dumping duty | 374.8% |
| Steel spread swing (2023–24) | >20% |
| Buffer stock norm | 30–90 days |
| US IRA | $369bn |
| CHIPS | ~$52bn |
| UK defence spend (2024) | ≈£50bn (2.2% GDP) |
| Public procurement | ≈12% global GDP |
What is included in the product
 Detailed Word Document
Explores how Political, Economic, Social, Technological, Environmental and Legal forces uniquely affect Trifast, with each category expanded into detailed, example-led subpoints tied to its industry and region. Backed by data and forward-looking insights, the analysis is formatted for executives, investors and advisors to identify risks, opportunities and strategic responses.

 Customizable Excel Spreadsheet
A clean, summarized Trifast PESTLE that’s visually segmented by category for quick interpretation, easily dropped into presentations or shared across teams to support planning and external risk discussions.
Economic factors

Industrial demand cycles
Automotive, electronics and appliances remain cyclical, driving order volatility for Trifast as global light-vehicle production and consumer electronics refreshes ebb and flow. Monitoring S&P Global manufacturing PMIs, which hovered around 50 in 2024–25, alongside OEM build schedules guides capacity and inventory decisions. Flexible shift patterns and modular tooling absorb peaks and troughs, while diversification across sectors smooths revenue.
Commodity and energy costs
Steel wire, plating inputs and energy remain primary drivers of Trifast’s COGS, with global steel and metal treatment costs and energy intensity directly affecting margins. Trifast offsets volatility through hedging and long-term supplier agreements that helped stabilize input cost pressures in recent periods. Energy-efficiency projects have materially lowered cost-to-serve, while surcharge mechanisms and indexed pass-throughs enable partial sharing of short-term commodity swings with customers; wholesale gas/power fell c.70% from 2022 peaks by 2024.

FX volatility
Multi-currency revenues and inputs expose Trifast earnings to FX swings across its European and Asian markets, creating translation and transaction risk. Natural hedging from local sourcing and manufacturing dampens P&L volatility by aligning costs and sales currencies. Conservative derivative policies are used to protect cash flows on large contracts, while indexed price lists and contract indexation clauses maintain revenue predictability.

Interest rates and credit
Higher global policy rates (Bank of England 5.25% and US Fed funds ~5.25–5.50% in 2024) raise Trifast’s working capital and capex funding costs, making cheap external liquidity scarce; tight inventory turns and vendor-managed inventory programs free cash and mitigate exposure. Robust banking covenants and diversified lenders reduce refinancing risk while ROIC-led capital allocation protects value across cycles.
- Higher rates: increases WACC and borrowing costs
- Inventory/VMI: frees cash, lowers WC
- Strong covenants: cuts refinancing risk
- ROIC focus: preserves shareholder value
Global supply chain logistics
Global freight volatility remains a key economic factor for Trifast: Drewry's World Container Index fell c.80% from 2021 peaks to 2024, while major-port average berthing delays eased to about 1–2 days in 2024, improving lead‑time reliability but keeping exposure to spikes. Dual‑sourcing and regional hubs shorten critical paths and lower single‑point risk; nearshoring trends (rising investment in EMEA/APAC regional facilities) balance cost and resilience. Advanced joint planning with customers can cut expedite spend materially, often by 20–30% through reduced rush shipments.
- Freight rate drop: Drewry WCI ≈ -80% from 2021 to 2024
- Port delays: major ports ~1–2 days avg in 2024 vs ~6 days 2021
- Expedite savings: advanced planning often reduces rush costs 20–30%
- Strategy: dual‑sourcing + regional hubs + nearshoring improves resilience
374.8% duties and > 20% steel swings force reshoring, 30-90 day stock buffers
Cyclical end‑markets drive order volatility; S&P Global manufacturing PMIs ~50 in 2024–25 guide capacity and inventory. Input cost swings (steel, plating, energy) impact margins; wholesale gas/power ~-70% from 2022 peaks by 2024 and hedging/long‑term contracts mitigate. Multi‑currency exposure managed via local sourcing and conservative FX hedges. Higher policy rates (BoE 5.25%, Fed ~5.25–5.50% in 2024) raise WACC and working‑capital costs.
| Metric | 2024/25 |
|---|---|
| S&P PMI | ~50 |
| Gas/Power vs 2022 | -70% |
| Drewry WCI vs 2021 | -80% |
| Port delays | 1–2 days |
| BoE/Fed | 5.25% / 5.25–5.50% |
Preview Before You Purchase
Trifast PESTLE Analysis
The Trifast PESTLE Analysis preview shown here is the exact document you’ll receive after purchase—fully formatted and ready to use. It covers political, economic, social, technological, legal and environmental factors for Trifast in the same structure and detail as the downloadable file.

Product Information
Product Information
Shipping & Returns
Shipping & Returns
Description
Make Smarter Strategic Decisions with a Complete PESTEL View
Gain a strategic advantage with our PESTLE Analysis of Trifast—concise, expert-led insight into the political, economic, social, technological, legal, and environmental forces shaping its future. Ideal for investors, consultants, and executives, this report translates external risks and opportunities into actionable strategy. Purchase the full version to download the complete, editable analysis and make smarter decisions now.
Political factors
Trade policies and tariffs
Fasteners face tariff exposure across the US, EU, UK and Asia, driving landed-cost swings that can exceed 10% for significant shipments and altering pricing competitively; US anti-dumping cases have seen duties as high as 374.8% on certain Chinese fasteners. Changes in anti-dumping duties can rapidly shift sourcing economics, prompting agile supplier rebalancing and contract repricing. Active monitoring and industry association lobbying (e.g., British Metalworking Tools Association inputs) can pre-empt adverse classifications.
Geopolitical supply risks
Regional tensions and sanctions threaten steel and plating-chemical flows and key logistics lanes, raising input-cost volatility seen in 2023–24 when steel spreads swung by over 20%. Multi-region manufacturing and dual-sourcing cut single-point exposure, with industry buffer-stock norms of 30–90 days. Scenario planning for rerouting and 60-day buffer stocks preserves service levels. Clear customer communication frameworks sustain confidence during disruptions.
Industrial policy and incentives
Government incentives such as the US Inflation Reduction Act (circa $369bn) and the CHIPS and Science Act (~$52bn) create capex co‑funding opportunities for advanced manufacturing and EV supply chains. Locating plants in incentive zones—for example the UK’s eight freeports—can materially improve ROIC. Compliance with local content rules secures access to strategic programs and aligning with national reshoring agendas strengthens OEM partnerships.
Public procurement and standards
State-backed infrastructure and defence programs demand strict sourcing and traceability, affecting Trifast’s supply-chain controls; public procurement represents about 12% of global GDP (World Bank). UK defence spending is around 2.2% of GDP (≈£50bn in 2024), so political cycles drive project timing and volumes. Certification alignment raises tender eligibility while transparent ESG reporting can be a decisive differentiator in award decisions.
- Traceability mandatory for defence tenders
- Public procurement ≈12% of global GDP (World Bank)
- UK defence spend ≈2.2% GDP (~£50bn, 2024)
- Certification and ESG increase tender success
Labor and immigration policies
Labor and immigration policies determine access to skilled machinists and engineers for Trifast; visa and apprenticeship support directly affect ramp-up speed in growth regions and tight controls can delay capacity expansion. Proactive training pipelines and apprenticeships reduce exposure to policy swings, while cross-border talent mobility improves technical service responsiveness and uptime.
374.8% duties and > 20% steel swings force reshoring, 30-90 day stock buffers
Tariff and anti-dumping shifts (duties up to 374.8% on some Chinese fasteners) create >10% landed-cost swings, forcing rapid sourcing shifts and contract repricing. Regional sanctions and logistic risks drove 2023–24 steel spread volatility >20%, prompting 30–90 day buffer norms. Incentives (US IRA $369bn; CHIPS ~$52bn) and UK freeports aid reshoring; UK defence spend ≈£50bn (2.2% GDP, 2024) boosts certified-supply demand.
| Metric | Value |
|---|---|
| Max anti-dumping duty | 374.8% |
| Steel spread swing (2023–24) | >20% |
| Buffer stock norm | 30–90 days |
| US IRA | $369bn |
| CHIPS | ~$52bn |
| UK defence spend (2024) | ≈£50bn (2.2% GDP) |
| Public procurement | ≈12% global GDP |
What is included in the product
Detailed Word Document
Explores how Political, Economic, Social, Technological, Environmental and Legal forces uniquely affect Trifast, with each category expanded into detailed, example-led subpoints tied to its industry and region. Backed by data and forward-looking insights, the analysis is formatted for executives, investors and advisors to identify risks, opportunities and strategic responses.
Customizable Excel Spreadsheet
A clean, summarized Trifast PESTLE that’s visually segmented by category for quick interpretation, easily dropped into presentations or shared across teams to support planning and external risk discussions.
Economic factors
Industrial demand cycles
Automotive, electronics and appliances remain cyclical, driving order volatility for Trifast as global light-vehicle production and consumer electronics refreshes ebb and flow. Monitoring S&P Global manufacturing PMIs, which hovered around 50 in 2024–25, alongside OEM build schedules guides capacity and inventory decisions. Flexible shift patterns and modular tooling absorb peaks and troughs, while diversification across sectors smooths revenue.
Commodity and energy costs
Steel wire, plating inputs and energy remain primary drivers of Trifast’s COGS, with global steel and metal treatment costs and energy intensity directly affecting margins. Trifast offsets volatility through hedging and long-term supplier agreements that helped stabilize input cost pressures in recent periods. Energy-efficiency projects have materially lowered cost-to-serve, while surcharge mechanisms and indexed pass-throughs enable partial sharing of short-term commodity swings with customers; wholesale gas/power fell c.70% from 2022 peaks by 2024.
FX volatility
Multi-currency revenues and inputs expose Trifast earnings to FX swings across its European and Asian markets, creating translation and transaction risk. Natural hedging from local sourcing and manufacturing dampens P&L volatility by aligning costs and sales currencies. Conservative derivative policies are used to protect cash flows on large contracts, while indexed price lists and contract indexation clauses maintain revenue predictability.
Interest rates and credit
Higher global policy rates (Bank of England 5.25% and US Fed funds ~5.25–5.50% in 2024) raise Trifast’s working capital and capex funding costs, making cheap external liquidity scarce; tight inventory turns and vendor-managed inventory programs free cash and mitigate exposure. Robust banking covenants and diversified lenders reduce refinancing risk while ROIC-led capital allocation protects value across cycles.
- Higher rates: increases WACC and borrowing costs
- Inventory/VMI: frees cash, lowers WC
- Strong covenants: cuts refinancing risk
- ROIC focus: preserves shareholder value
Global supply chain logistics
Global freight volatility remains a key economic factor for Trifast: Drewry's World Container Index fell c.80% from 2021 peaks to 2024, while major-port average berthing delays eased to about 1–2 days in 2024, improving lead‑time reliability but keeping exposure to spikes. Dual‑sourcing and regional hubs shorten critical paths and lower single‑point risk; nearshoring trends (rising investment in EMEA/APAC regional facilities) balance cost and resilience. Advanced joint planning with customers can cut expedite spend materially, often by 20–30% through reduced rush shipments.
- Freight rate drop: Drewry WCI ≈ -80% from 2021 to 2024
- Port delays: major ports ~1–2 days avg in 2024 vs ~6 days 2021
- Expedite savings: advanced planning often reduces rush costs 20–30%
- Strategy: dual‑sourcing + regional hubs + nearshoring improves resilience
374.8% duties and > 20% steel swings force reshoring, 30-90 day stock buffers
Cyclical end‑markets drive order volatility; S&P Global manufacturing PMIs ~50 in 2024–25 guide capacity and inventory. Input cost swings (steel, plating, energy) impact margins; wholesale gas/power ~-70% from 2022 peaks by 2024 and hedging/long‑term contracts mitigate. Multi‑currency exposure managed via local sourcing and conservative FX hedges. Higher policy rates (BoE 5.25%, Fed ~5.25–5.50% in 2024) raise WACC and working‑capital costs.
| Metric | 2024/25 |
|---|---|
| S&P PMI | ~50 |
| Gas/Power vs 2022 | -70% |
| Drewry WCI vs 2021 | -80% |
| Port delays | 1–2 days |
| BoE/Fed | 5.25% / 5.25–5.50% |
Preview Before You Purchase
Trifast PESTLE Analysis
The Trifast PESTLE Analysis preview shown here is the exact document you’ll receive after purchase—fully formatted and ready to use. It covers political, economic, social, technological, legal and environmental factors for Trifast in the same structure and detail as the downloadable file.











