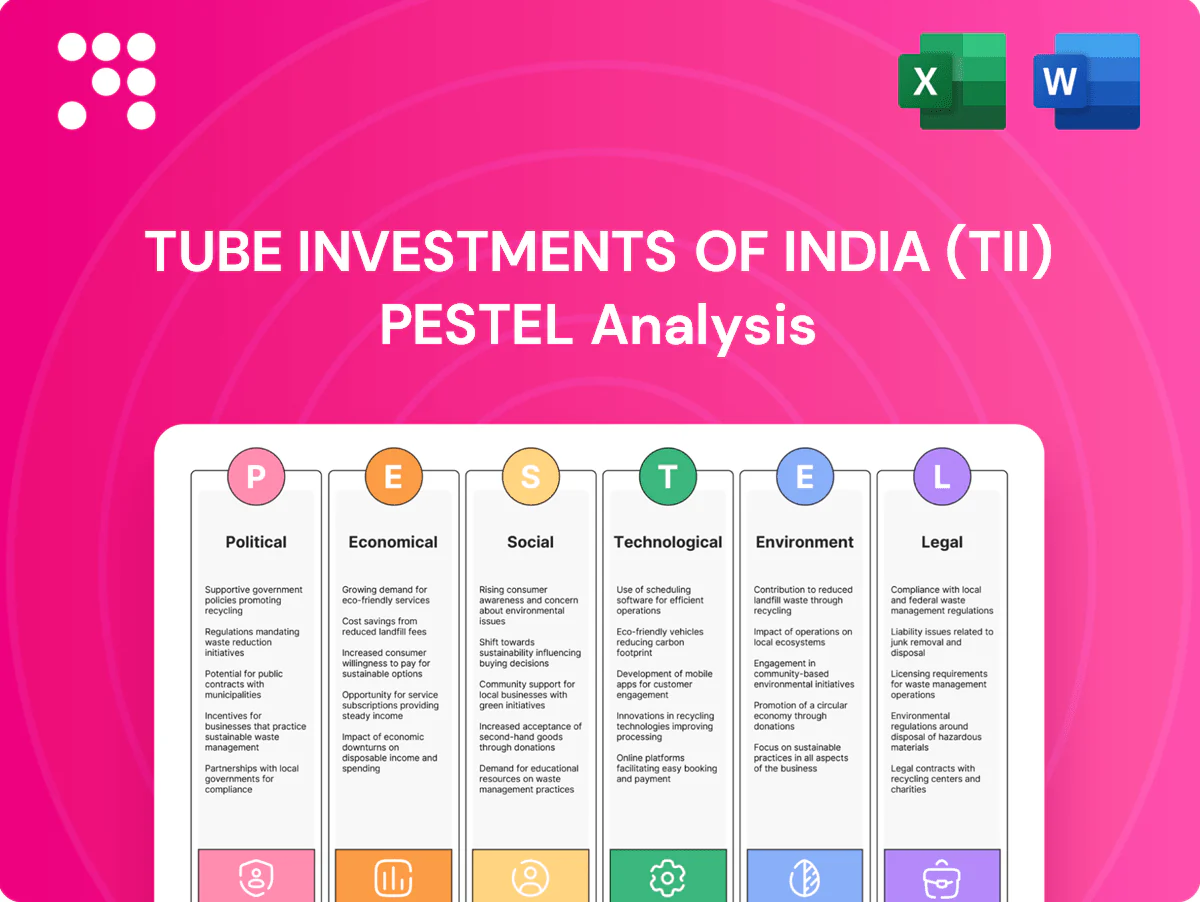
Tube Investments of India (TII) PESTLE Analysis

Your Shortcut to Market Insight Starts Here
Our PESTLE Analysis of Tube Investments of India (TII) pinpoints political, economic and regulatory risks, plus social and technological trends shaping demand. It highlights opportunities in EVs and green manufacturing while flagging supply-chain and compliance threats. Purchase the full, editable report for actionable insights and strategic recommendations you can use immediately.
Political factors

Make in India, PLI tailwinds
Make in India and the Rs 1.97 lakh crore PLI framework (across 14 sectors) can shorten TII’s capex payback by improving realizations and driving onshore sourcing for tubes, chains and metal-formed parts; typical PLI tenors run 5–6 years, improving near-term ROI. Alignment lets TII deepen penetration into auto and infrastructure OEM supply chains through higher localization and long-term contracts. Strict tracking of eligibility criteria, localization thresholds and audit compliance is critical to secure payments. Pipeline planning should assume policy continuity while stress-testing models for incentive withdrawal scenarios.
Infrastructure capex push
Sustained government capex—about ₹11 lakh crore in 2024–25 with road allocation ~₹2.6 lakh crore and rail capex ~₹2.4 lakh crore—fuels demand for steel tubes and metal-formed products for TII. Public procurement norms and vendor registrations (DGFP/GeM) determine margins and volumes, raising entry costs for suppliers. Project delays and election cycles can compress or defer orders, creating timing risk. TII should diversify across central and state projects to smooth volatility.

Trade policy, tariffs, exports
Import duties and active anti-dumping measures on steel products raise TII’s input costs and compress margins; India maintains tariffs and investigations across stainless and hot-rolled segments. FTAs such as the India–UAE CEPA (2022) can expand chains and tube exports while pressuring domestic prices. Export incentive schemes like RoDTEP and logistics reforms under PM Gati Shakti (₹100 lakh crore) lower landed costs. TII must hedge via sourcing optionality and trade-protection clauses in contracts.

Urban mobility, cycling programs
City-level cycling missions and last-mile plans are expanding demand for bicycles and allied components; public bike-share and protected lanes accelerate premium and commuter segments, while policy follow-through varies widely across states and municipalities. TII brands can pilot public–private partnerships, CSR-linked fleets and B2B supplies to municipalities and operators to capture fleet and retail growth.
- Partner on pilots
- CSR fleet tie-ins
- Target commuter upgrades
Political stability & regulatory predictability
Stable governance in India supports long-horizon manufacturing investments, while the 2017 GST rollout remains the last major nationwide indirect-tax reform affecting cash flows. Sudden shifts in GST slabs, state incentives or labor rules can materially alter project returns. Operating across 28 states and 8 union territories requires navigating differing compliances; active policy engagement helps anticipate changes and secure approvals.
- Stable governance: enables capex horizon
- GST reform (2017): key precedent for tax shocks
- 28 states + 8 UTs: compliance complexity
- Policy engagement: mitigates approval and cash-flow risk
PLI Rs1.97L cuts payback; ₹11L capex lifts demand
Make in India and the Rs 1.97 lakh crore PLI boost localization for tubes, chains and metal parts, shortening capex payback and improving near-term ROI. 2024–25 govt capex ~₹11 lakh crore (roads ~₹2.6L, rail ~₹2.4L) supports demand but project delays and elections create timing risk. Tariffs, anti-dumping and FTAs (India–UAE CEPA) shift margins; 28 states + 8 UTs add compliance complexity.
| Political factor | Key metric | Impact on TII |
|---|---|---|
| PLI | Rs 1.97 lakh crore | Shorter payback, higher localization |
| Govt capex | ₹11 lakh crore (2024–25) | Demand lift; timing risk |
| Trade measures | Tariffs/anti-dumping/CEPA | Input cost & export price volatility |
| Federal complexity | 28 states + 8 UTs | Compliance and approval risk |
What is included in the product
 Detailed Word Document
Explores how macro-environmental factors uniquely affect Tube Investments of India (TII) across Political, Economic, Social, Technological, Environmental, and Legal dimensions, with data-driven trends and sector-specific examples to highlight risks and opportunities. Designed for executives and investors to inform strategy, scenario planning, and funding decisions.

 Customizable Excel Spreadsheet
A concise, visually segmented PESTLE summary of Tube Investments of India that relieves meeting prep pain by providing an editable, shareable snapshot—drop-ready for slides or strategy folders and easy to annotate for local business lines.
Economic factors

Auto cycle sensitivity
Chains, tubes and formed products at TII closely track OEM and aftermarket cycles, with exposure to PV, CV and 2W demand swings that shift volumes and product mix; India 2W sales ~18m units (2023) and global EV sales reached ~14m units (2023), driving platform changes. Electrification creates new tubular platforms but can compress legacy part volumes, so TII should balance OEM exposure with diversified industrial and aftermarket customers to stabilize revenue.
Steel price volatility
Raw-material swings—spot HRC moved roughly 25% year-on-year in 2024—create acute margin risk across TIIs tubes and metal products, making index-linked contracts and tight inventory discipline essential to protect spreads. Active hedging and supplier diversification have reduced one-off shocks in recent quarters. Pricing agility and upgrading product mix to higher-value engineered tubes help defend gross margins.

Interest rates, capex, credit
Higher interest rates (RBI policy repo rate 6.50% as of July 2025) raise working capital and expansion costs for TII, compressing ROCE; OEM and infrastructure customers’ capex cycles (auto investment uptick in 2024–25) drive order volatility. Access to low‑cost debt and leasing supports modernization and automation, while strong cash conversion and working‑capital efficiency cushion downturns amid ~13% YoY bank credit growth (May 2025).

Rural and urban consumption
Bicycle volumes for TII track rural incomes, monsoon strength and government transfers; India’s rural population is about 64% (World Bank 2023) and IMD reported 2023 monsoon at ~96% of LPA, affecting demand and replacement cycles. Urban premium and fitness segments hinge on discretionary spending, while inflation pressures (CPI running around mid-single digits in 2024) can shift buyers from premium to value; TII’s wide price ladder cushions shocks.
- Rural dependence: monsoon, transfers
- Urban: discretionary + premium/fitness
- Inflation: trade-down risk
- Mitigation: broad portfolio across price points
Export demand and FX
Global industrial cycles and elevated but normalizing freight rates continue to shape TII export competitiveness; container rates moved down from 2021–22 peaks, easing costs for exporters.
INR movements (around 83 per USD in 2024) materially affect realizations and imported input costs; strict compliance with EU/US destination standards remains a gating factor for market access, so multi-region customers help smooth country-specific slowdowns.
- Export sensitivity: freight + demand
- FX impact: ~83 INR/USD (2024)
- Regulatory gate: destination standards
- Mitigation: diversify across regions
PLI Rs1.97L cuts payback; ₹11L capex lifts demand
TII faces demand cyclicality from PV/CV/2W (India 2W ~18m units 2023) and electrification (global EV ~14m units 2023) that shifts volumes; diversifying into industrial and aftermarket stabilizes revenue. Raw-material volatility (HRC ~+25% YoY 2024) and INR ~83/USD (2024) pressure margins, making index‑linked pricing, hedging and higher‑value mix vital. Higher rates (RBI repo 6.50% Jul 2025) raise working capital and capex costs, while rural dependence and mid‑single digit CPI (2024) affect bicycle demand.
| Metric | Value | Source/Year |
|---|---|---|
| India 2W sales | ~18m units | 2023 |
| Global EV sales | ~14m units | 2023 |
| HRC move | ~+25% YoY | 2024 |
| INR/USD | ~83 | 2024 |
| RBI repo | 6.50% | Jul 2025 |
| Rural pop | ~64% | World Bank 2023 |
| CPI | mid-single digits | 2024 |
Same Document Delivered
Tube Investments of India (TII) PESTLE Analysis
This Tube Investments of India (TII) PESTLE Analysis preview is the exact document you’ll receive after purchase, fully formatted and ready to use. The content, structure, and insights shown here are delivered exactly as displayed—no placeholders or edits. After checkout you’ll instantly download this final, professionally structured file.

Original: $10.00
-65%$10.00
$3.50Product Information
Product Information
Shipping & Returns
Shipping & Returns
Description
Your Shortcut to Market Insight Starts Here
Our PESTLE Analysis of Tube Investments of India (TII) pinpoints political, economic and regulatory risks, plus social and technological trends shaping demand. It highlights opportunities in EVs and green manufacturing while flagging supply-chain and compliance threats. Purchase the full, editable report for actionable insights and strategic recommendations you can use immediately.
Political factors
Make in India, PLI tailwinds
Make in India and the Rs 1.97 lakh crore PLI framework (across 14 sectors) can shorten TII’s capex payback by improving realizations and driving onshore sourcing for tubes, chains and metal-formed parts; typical PLI tenors run 5–6 years, improving near-term ROI. Alignment lets TII deepen penetration into auto and infrastructure OEM supply chains through higher localization and long-term contracts. Strict tracking of eligibility criteria, localization thresholds and audit compliance is critical to secure payments. Pipeline planning should assume policy continuity while stress-testing models for incentive withdrawal scenarios.
Infrastructure capex push
Sustained government capex—about ₹11 lakh crore in 2024–25 with road allocation ~₹2.6 lakh crore and rail capex ~₹2.4 lakh crore—fuels demand for steel tubes and metal-formed products for TII. Public procurement norms and vendor registrations (DGFP/GeM) determine margins and volumes, raising entry costs for suppliers. Project delays and election cycles can compress or defer orders, creating timing risk. TII should diversify across central and state projects to smooth volatility.
Trade policy, tariffs, exports
Import duties and active anti-dumping measures on steel products raise TII’s input costs and compress margins; India maintains tariffs and investigations across stainless and hot-rolled segments. FTAs such as the India–UAE CEPA (2022) can expand chains and tube exports while pressuring domestic prices. Export incentive schemes like RoDTEP and logistics reforms under PM Gati Shakti (₹100 lakh crore) lower landed costs. TII must hedge via sourcing optionality and trade-protection clauses in contracts.
Urban mobility, cycling programs
City-level cycling missions and last-mile plans are expanding demand for bicycles and allied components; public bike-share and protected lanes accelerate premium and commuter segments, while policy follow-through varies widely across states and municipalities. TII brands can pilot public–private partnerships, CSR-linked fleets and B2B supplies to municipalities and operators to capture fleet and retail growth.
- Partner on pilots
- CSR fleet tie-ins
- Target commuter upgrades
Political stability & regulatory predictability
Stable governance in India supports long-horizon manufacturing investments, while the 2017 GST rollout remains the last major nationwide indirect-tax reform affecting cash flows. Sudden shifts in GST slabs, state incentives or labor rules can materially alter project returns. Operating across 28 states and 8 union territories requires navigating differing compliances; active policy engagement helps anticipate changes and secure approvals.
- Stable governance: enables capex horizon
- GST reform (2017): key precedent for tax shocks
- 28 states + 8 UTs: compliance complexity
- Policy engagement: mitigates approval and cash-flow risk
PLI Rs1.97L cuts payback; ₹11L capex lifts demand
Make in India and the Rs 1.97 lakh crore PLI boost localization for tubes, chains and metal parts, shortening capex payback and improving near-term ROI. 2024–25 govt capex ~₹11 lakh crore (roads ~₹2.6L, rail ~₹2.4L) supports demand but project delays and elections create timing risk. Tariffs, anti-dumping and FTAs (India–UAE CEPA) shift margins; 28 states + 8 UTs add compliance complexity.
| Political factor | Key metric | Impact on TII |
|---|---|---|
| PLI | Rs 1.97 lakh crore | Shorter payback, higher localization |
| Govt capex | ₹11 lakh crore (2024–25) | Demand lift; timing risk |
| Trade measures | Tariffs/anti-dumping/CEPA | Input cost & export price volatility |
| Federal complexity | 28 states + 8 UTs | Compliance and approval risk |
What is included in the product
Detailed Word Document
Explores how macro-environmental factors uniquely affect Tube Investments of India (TII) across Political, Economic, Social, Technological, Environmental, and Legal dimensions, with data-driven trends and sector-specific examples to highlight risks and opportunities. Designed for executives and investors to inform strategy, scenario planning, and funding decisions.
Customizable Excel Spreadsheet
A concise, visually segmented PESTLE summary of Tube Investments of India that relieves meeting prep pain by providing an editable, shareable snapshot—drop-ready for slides or strategy folders and easy to annotate for local business lines.
Economic factors
Auto cycle sensitivity
Chains, tubes and formed products at TII closely track OEM and aftermarket cycles, with exposure to PV, CV and 2W demand swings that shift volumes and product mix; India 2W sales ~18m units (2023) and global EV sales reached ~14m units (2023), driving platform changes. Electrification creates new tubular platforms but can compress legacy part volumes, so TII should balance OEM exposure with diversified industrial and aftermarket customers to stabilize revenue.
Steel price volatility
Raw-material swings—spot HRC moved roughly 25% year-on-year in 2024—create acute margin risk across TIIs tubes and metal products, making index-linked contracts and tight inventory discipline essential to protect spreads. Active hedging and supplier diversification have reduced one-off shocks in recent quarters. Pricing agility and upgrading product mix to higher-value engineered tubes help defend gross margins.
Interest rates, capex, credit
Higher interest rates (RBI policy repo rate 6.50% as of July 2025) raise working capital and expansion costs for TII, compressing ROCE; OEM and infrastructure customers’ capex cycles (auto investment uptick in 2024–25) drive order volatility. Access to low‑cost debt and leasing supports modernization and automation, while strong cash conversion and working‑capital efficiency cushion downturns amid ~13% YoY bank credit growth (May 2025).
Rural and urban consumption
Bicycle volumes for TII track rural incomes, monsoon strength and government transfers; India’s rural population is about 64% (World Bank 2023) and IMD reported 2023 monsoon at ~96% of LPA, affecting demand and replacement cycles. Urban premium and fitness segments hinge on discretionary spending, while inflation pressures (CPI running around mid-single digits in 2024) can shift buyers from premium to value; TII’s wide price ladder cushions shocks.
- Rural dependence: monsoon, transfers
- Urban: discretionary + premium/fitness
- Inflation: trade-down risk
- Mitigation: broad portfolio across price points
Export demand and FX
Global industrial cycles and elevated but normalizing freight rates continue to shape TII export competitiveness; container rates moved down from 2021–22 peaks, easing costs for exporters.
INR movements (around 83 per USD in 2024) materially affect realizations and imported input costs; strict compliance with EU/US destination standards remains a gating factor for market access, so multi-region customers help smooth country-specific slowdowns.
- Export sensitivity: freight + demand
- FX impact: ~83 INR/USD (2024)
- Regulatory gate: destination standards
- Mitigation: diversify across regions
PLI Rs1.97L cuts payback; ₹11L capex lifts demand
TII faces demand cyclicality from PV/CV/2W (India 2W ~18m units 2023) and electrification (global EV ~14m units 2023) that shifts volumes; diversifying into industrial and aftermarket stabilizes revenue. Raw-material volatility (HRC ~+25% YoY 2024) and INR ~83/USD (2024) pressure margins, making index‑linked pricing, hedging and higher‑value mix vital. Higher rates (RBI repo 6.50% Jul 2025) raise working capital and capex costs, while rural dependence and mid‑single digit CPI (2024) affect bicycle demand.
| Metric | Value | Source/Year |
|---|---|---|
| India 2W sales | ~18m units | 2023 |
| Global EV sales | ~14m units | 2023 |
| HRC move | ~+25% YoY | 2024 |
| INR/USD | ~83 | 2024 |
| RBI repo | 6.50% | Jul 2025 |
| Rural pop | ~64% | World Bank 2023 |
| CPI | mid-single digits | 2024 |
Same Document Delivered
Tube Investments of India (TII) PESTLE Analysis
This Tube Investments of India (TII) PESTLE Analysis preview is the exact document you’ll receive after purchase, fully formatted and ready to use. The content, structure, and insights shown here are delivered exactly as displayed—no placeholders or edits. After checkout you’ll instantly download this final, professionally structured file.











