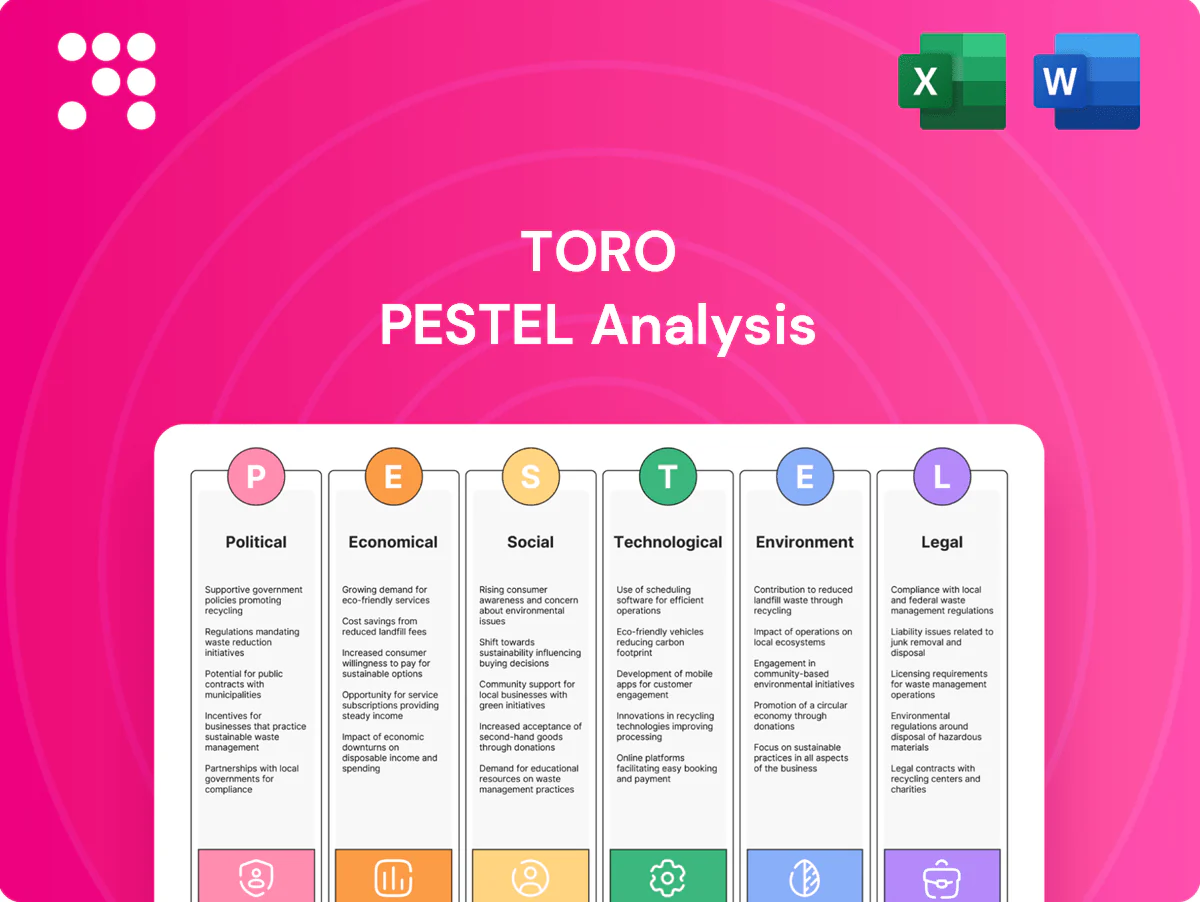
Toro PESTLE Analysis

Plan Smarter. Present Sharper. Compete Stronger.
Discover how political shifts, economic trends, social preferences, and regulatory pressures are shaping Toro's strategic path in our concise PESTLE overview. This analysis highlights risks and opportunities you can use in investment or strategy work. Purchase the full PESTLE to access the complete, actionable intelligence instantly.
Political factors

Trade policy shifts
Import tariffs such as US Section 232 steel (25%) and aluminum (10%) and past retaliatory duties (up to 25% in some China cases) can raise BOM and squeeze margins; tariffs have increased input costs for manufacturers by double-digit percentages in prior trade episodes. Policy stability dictates multi-year sourcing/localization choices, while federal incentives (IRA, CHIPS, state grants often totaling tens–hundreds of millions) steer plant siting and supplier selection.
Agriculture and water subsidies
EU farm support through the Common Agricultural Policy allocates €387 billion for 2021–2027, directing payments and eco‑schemes that accelerate precision‑ag adoption and micro‑irrigation investments.
Public rebates and state/local water conservation programs increasingly make smart irrigation cost‑effective for municipalities and homeowners, raising order flow outside peak seasons.
Shifts in farm support rules and grant funding cycles change growers’ capex timing, concentrating purchases around announcement and disbursement windows.

Municipal procurement priorities
City budgets and political agendas directly steer spending on parks, sports fields and snow fleets—U.S. state and local expenditures were about $3.9 trillion in 2023 (Census), constraining or enabling municipal capital outlays. Buy‑American and local‑content clauses in IIJA (roughly $550 billion new infrastructure) favor domestic production. Election cycles often freeze or accelerate equipment refresh programs, while growing ESG mandates and >100 municipalities' ZEV fleet targets to 2030 boost demand for low‑emission equipment.

Geopolitical supply chain risk
Trade tensions and US export controls tightened since Oct 2022 have constrained access to advanced semiconductors and high-end hydraulics, while battery supply chains face sanctions-driven rerouting; the CHIPS and Science Act (about 52 billion USD) accelerates nearshoring as a hedge. Sanctions and port bottlenecks have raised lead times and inventory buffers, increasing insurance and compliance costs under greater scrutiny.
- Export controls: tighter since Oct 2022
- CHIPS Act: ~52 billion USD
- Sanctions: longer lead times, higher inventories
- Costs: insurance/compliance up
Water use policy and restrictions
Drought declarations and landscaping ordinances cut irrigation volumes and shift product mix; over 40% of the contiguous US faced drought conditions mid-2025 per US Drought Monitor, accelerating xeriscape incentives that depress turf-equipment demand while boosting drip/microirrigation. Mandatory smart-controller rules create steady replacement cycles and compliance programs expand demand for verified-saving products.
- Policy impact: reduced irrigation volume
- Product mix: turf down, drip up
- Smart controllers: replacement cycles
- Compliance: market for verified-saving products
Tariffs, IRA/CHIPS and EU CAP push nearshoring and precision irrigation amid worsening droughts
Tariffs and trade controls raise BOM and force localization; CHIPS ~52bn and IRA ~369bn drive nearshoring. EU CAP €387bn (2021–27) boosts precision irrigation. US state/local spend ~$3.9tn (2023) and IIJA infrastructure favor domestic sourcing. Droughts hit >40% US mid‑2025, shifting demand to drip and smart controllers.
| Policy | Impact | Figure |
|---|---|---|
| Tariffs/controls | Higher BOM | Section 232: 25%/10% |
| IRA/CHIPS | Reshoring | IRA 369bn/CHIPS 52bn |
What is included in the product
 Detailed Word Document
Explores how external macro-environmental factors uniquely affect Toro across Political, Economic, Social, Technological, Environmental and Legal dimensions; each section is data-backed with detailed subpoints, forward-looking insights and actionable recommendations to help executives, consultants and entrepreneurs identify threats, opportunities and support scenario planning.

 Customizable Excel Spreadsheet
A concise, visually segmented PESTLE summary for Toro that’s easily dropped into presentations, shared across teams, and annotated with region-specific notes to streamline strategic planning and risk discussions.
Economic factors

Construction and housing cycles
New housing and commercial builds—US housing starts roughly 1.4M annualized in 2024 per US Census—directly drive demand for Toro’s landscaping and irrigation installs; slowdowns cut contractor backlogs and retail sell-through, while renovation spending (roughly $480B–$500B annually) can partly offset new-build weakness; regional variability mandates flexible, channel-specific planning.
Input and logistics costs
Input cost swings in steel, aluminum, plastics and battery materials materially pressure Toro’s gross margins, while lithium and battery pack prices fell roughly 50–60% from 2022–24, easing EV-related component costs. Freight volatility—Baltic and container rates—plus U.S. diesel averaging about $4/gal in 2024, drive both Toro’s logistics spend and customers’ TCO calculations. Pricing power and targeted surcharges must respect demand elasticity to protect margins. Long-term supplier contracts and hedging programs are used to stabilize these variances.

Interest rates and financing
Higher interest rates raise dealer floorplan costs and customer financing expenses, with the US federal funds rate near 5.25% in mid‑2025 increasing carrying costs; this slows purchase velocity. Extended payback periods for fleets delay upgrades to new Toro technologies as total cost of ownership stretches. Promotional financing during peak seasons (0%–3% APR offers commonly used in equipment promos) can drive conversions. Rate cuts historically release pent‑up capex.

Foreign exchange exposure
USD strength (trade‑weighted index up about 5% in 2024) pressures Toro export pricing and reduces translated revenues, squeezing margins on overseas sales which account for roughly 30% of company revenue. Currency swings also influence global sourcing and component procurement decisions, while local production and cost bases provide natural hedges that blunt volatility. Formal hedging programs reduce but do not eliminate FX risk.
- USD TWI ~+5% (2024)
- International sales ~30%
- Local production = natural hedge
- Hedging limits residual FX risk
Weather-linked demand variability
Snowfall variability drives annual swings in snow-equipment unit volumes, while prolonged droughts suppress turf equipment demand but increase sales of efficient irrigation systems; seasonality forces Toro to maintain agile inventory and tight dealer alignment to shift supply into peak windows. Insurance and multi-year service contracts help smooth revenue between peaks by locking in recurring aftermarket income.
- Weather-driven unit volatility
- Shift: turf down, irrigation up
- Inventory agility & dealer sync
- Service/insurance = recurring revenue
Tariffs, IRA/CHIPS and EU CAP push nearshoring and precision irrigation amid worsening droughts
US housing starts ~1.4M (2024) and renovation spend ~$480B–$500B underpin Toro demand; input swings in steel/plastics and battery pack costs down ~50–60% (2022–24) affect margins. Fed funds ~5.25% (mid‑2025) and diesel ~$4/gal (2024) raise dealer/cust financing; USD TWI +5% (2024) pressures exports (~30% revenue).
| Metric | Value |
|---|---|
| Housing starts (2024) | ~1.4M |
| Renovation spend | $480B–$500B |
| Intl sales | ~30% |
| Fed funds | ~5.25% |
| USD TWI (2024) | +5% |
Same Document Delivered
Toro PESTLE Analysis
The preview shown is the exact Toro PESTLE Analysis document you’ll receive after purchase—fully formatted and ready to use. What you see here is the real, final file with no placeholders or surprises. After payment you’ll be able to download this same professionally structured report immediately.

Original: $10.00
-65%$10.00
$3.50Product Information
Product Information
Shipping & Returns
Shipping & Returns
Description
Plan Smarter. Present Sharper. Compete Stronger.
Discover how political shifts, economic trends, social preferences, and regulatory pressures are shaping Toro's strategic path in our concise PESTLE overview. This analysis highlights risks and opportunities you can use in investment or strategy work. Purchase the full PESTLE to access the complete, actionable intelligence instantly.
Political factors
Trade policy shifts
Import tariffs such as US Section 232 steel (25%) and aluminum (10%) and past retaliatory duties (up to 25% in some China cases) can raise BOM and squeeze margins; tariffs have increased input costs for manufacturers by double-digit percentages in prior trade episodes. Policy stability dictates multi-year sourcing/localization choices, while federal incentives (IRA, CHIPS, state grants often totaling tens–hundreds of millions) steer plant siting and supplier selection.
Agriculture and water subsidies
EU farm support through the Common Agricultural Policy allocates €387 billion for 2021–2027, directing payments and eco‑schemes that accelerate precision‑ag adoption and micro‑irrigation investments.
Public rebates and state/local water conservation programs increasingly make smart irrigation cost‑effective for municipalities and homeowners, raising order flow outside peak seasons.
Shifts in farm support rules and grant funding cycles change growers’ capex timing, concentrating purchases around announcement and disbursement windows.
Municipal procurement priorities
City budgets and political agendas directly steer spending on parks, sports fields and snow fleets—U.S. state and local expenditures were about $3.9 trillion in 2023 (Census), constraining or enabling municipal capital outlays. Buy‑American and local‑content clauses in IIJA (roughly $550 billion new infrastructure) favor domestic production. Election cycles often freeze or accelerate equipment refresh programs, while growing ESG mandates and >100 municipalities' ZEV fleet targets to 2030 boost demand for low‑emission equipment.
Geopolitical supply chain risk
Trade tensions and US export controls tightened since Oct 2022 have constrained access to advanced semiconductors and high-end hydraulics, while battery supply chains face sanctions-driven rerouting; the CHIPS and Science Act (about 52 billion USD) accelerates nearshoring as a hedge. Sanctions and port bottlenecks have raised lead times and inventory buffers, increasing insurance and compliance costs under greater scrutiny.
- Export controls: tighter since Oct 2022
- CHIPS Act: ~52 billion USD
- Sanctions: longer lead times, higher inventories
- Costs: insurance/compliance up
Water use policy and restrictions
Drought declarations and landscaping ordinances cut irrigation volumes and shift product mix; over 40% of the contiguous US faced drought conditions mid-2025 per US Drought Monitor, accelerating xeriscape incentives that depress turf-equipment demand while boosting drip/microirrigation. Mandatory smart-controller rules create steady replacement cycles and compliance programs expand demand for verified-saving products.
- Policy impact: reduced irrigation volume
- Product mix: turf down, drip up
- Smart controllers: replacement cycles
- Compliance: market for verified-saving products
Tariffs, IRA/CHIPS and EU CAP push nearshoring and precision irrigation amid worsening droughts
Tariffs and trade controls raise BOM and force localization; CHIPS ~52bn and IRA ~369bn drive nearshoring. EU CAP €387bn (2021–27) boosts precision irrigation. US state/local spend ~$3.9tn (2023) and IIJA infrastructure favor domestic sourcing. Droughts hit >40% US mid‑2025, shifting demand to drip and smart controllers.
| Policy | Impact | Figure |
|---|---|---|
| Tariffs/controls | Higher BOM | Section 232: 25%/10% |
| IRA/CHIPS | Reshoring | IRA 369bn/CHIPS 52bn |
What is included in the product
Detailed Word Document
Explores how external macro-environmental factors uniquely affect Toro across Political, Economic, Social, Technological, Environmental and Legal dimensions; each section is data-backed with detailed subpoints, forward-looking insights and actionable recommendations to help executives, consultants and entrepreneurs identify threats, opportunities and support scenario planning.
Customizable Excel Spreadsheet
A concise, visually segmented PESTLE summary for Toro that’s easily dropped into presentations, shared across teams, and annotated with region-specific notes to streamline strategic planning and risk discussions.
Economic factors
Construction and housing cycles
New housing and commercial builds—US housing starts roughly 1.4M annualized in 2024 per US Census—directly drive demand for Toro’s landscaping and irrigation installs; slowdowns cut contractor backlogs and retail sell-through, while renovation spending (roughly $480B–$500B annually) can partly offset new-build weakness; regional variability mandates flexible, channel-specific planning.
Input and logistics costs
Input cost swings in steel, aluminum, plastics and battery materials materially pressure Toro’s gross margins, while lithium and battery pack prices fell roughly 50–60% from 2022–24, easing EV-related component costs. Freight volatility—Baltic and container rates—plus U.S. diesel averaging about $4/gal in 2024, drive both Toro’s logistics spend and customers’ TCO calculations. Pricing power and targeted surcharges must respect demand elasticity to protect margins. Long-term supplier contracts and hedging programs are used to stabilize these variances.
Interest rates and financing
Higher interest rates raise dealer floorplan costs and customer financing expenses, with the US federal funds rate near 5.25% in mid‑2025 increasing carrying costs; this slows purchase velocity. Extended payback periods for fleets delay upgrades to new Toro technologies as total cost of ownership stretches. Promotional financing during peak seasons (0%–3% APR offers commonly used in equipment promos) can drive conversions. Rate cuts historically release pent‑up capex.
Foreign exchange exposure
USD strength (trade‑weighted index up about 5% in 2024) pressures Toro export pricing and reduces translated revenues, squeezing margins on overseas sales which account for roughly 30% of company revenue. Currency swings also influence global sourcing and component procurement decisions, while local production and cost bases provide natural hedges that blunt volatility. Formal hedging programs reduce but do not eliminate FX risk.
- USD TWI ~+5% (2024)
- International sales ~30%
- Local production = natural hedge
- Hedging limits residual FX risk
Weather-linked demand variability
Snowfall variability drives annual swings in snow-equipment unit volumes, while prolonged droughts suppress turf equipment demand but increase sales of efficient irrigation systems; seasonality forces Toro to maintain agile inventory and tight dealer alignment to shift supply into peak windows. Insurance and multi-year service contracts help smooth revenue between peaks by locking in recurring aftermarket income.
- Weather-driven unit volatility
- Shift: turf down, irrigation up
- Inventory agility & dealer sync
- Service/insurance = recurring revenue
Tariffs, IRA/CHIPS and EU CAP push nearshoring and precision irrigation amid worsening droughts
US housing starts ~1.4M (2024) and renovation spend ~$480B–$500B underpin Toro demand; input swings in steel/plastics and battery pack costs down ~50–60% (2022–24) affect margins. Fed funds ~5.25% (mid‑2025) and diesel ~$4/gal (2024) raise dealer/cust financing; USD TWI +5% (2024) pressures exports (~30% revenue).
| Metric | Value |
|---|---|
| Housing starts (2024) | ~1.4M |
| Renovation spend | $480B–$500B |
| Intl sales | ~30% |
| Fed funds | ~5.25% |
| USD TWI (2024) | +5% |
Same Document Delivered
Toro PESTLE Analysis
The preview shown is the exact Toro PESTLE Analysis document you’ll receive after purchase—fully formatted and ready to use. What you see here is the real, final file with no placeholders or surprises. After payment you’ll be able to download this same professionally structured report immediately.











