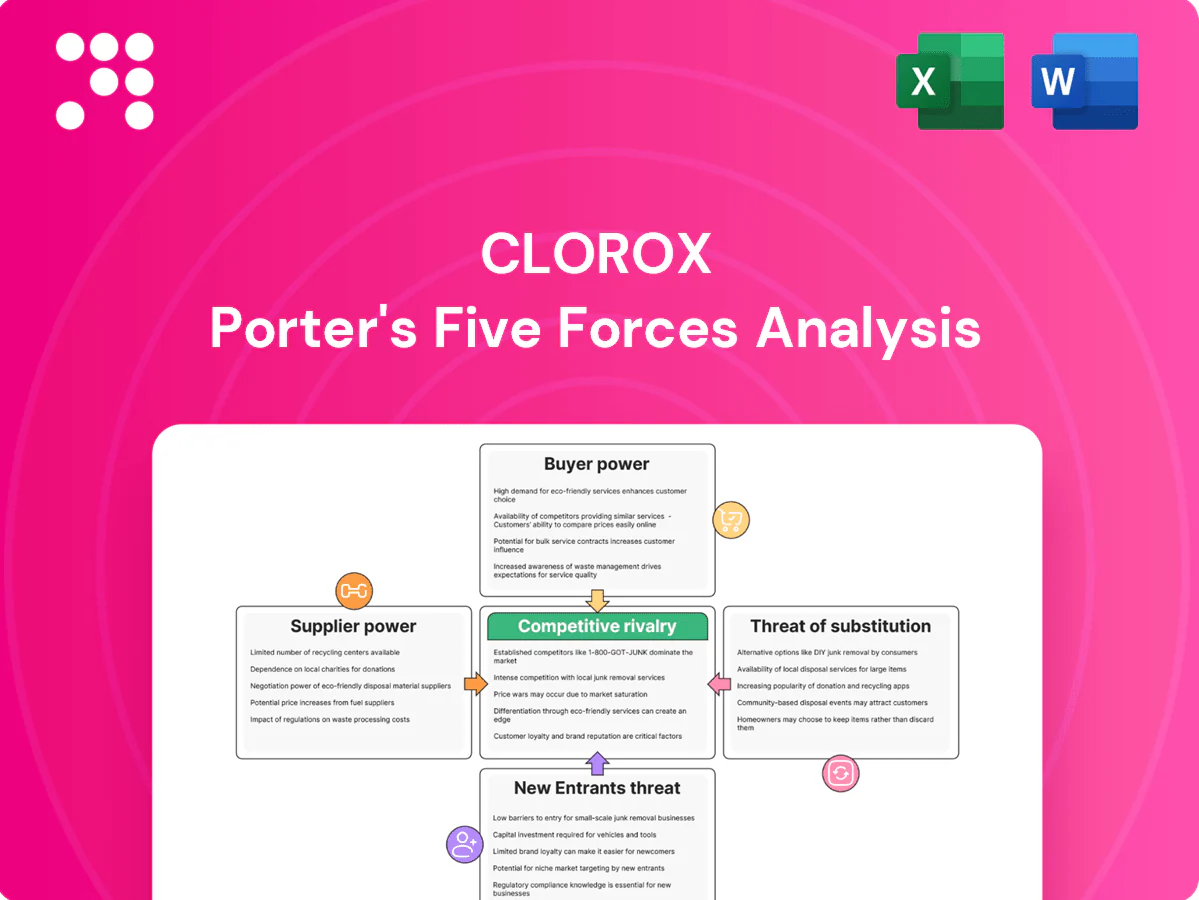
Clorox Porter's Five Forces Analysis

Elevate Your Analysis with the Complete Porter's Five Forces Analysis
Clorox faces moderate buyer power, steady supplier influence, and a low threat of new entrants due to scale and brand strength, while substitutes and rivalry shape margin pressure; this snapshot highlights key competitive levers and strategic risks. Unlock the full Porter's Five Forces Analysis for force-by-force ratings, visuals, and actionable insights tailored to Clorox.
Suppliers Bargaining Power

Concentrated chemical inputs
Clorox relies on key commodities like sodium hypochlorite, surfactants, fragrances and resins sourced from a limited base of large chemical producers, creating concentrated supplier power. Supplier concentration tightens during shortages, lifting input prices; long-term contracts and hedging mitigate spikes but cannot eliminate structural scarcity. Clorox can pass costs to retailers, but transmission is lagged and constrained by retail competition.
Packaging and resin volatility
Plastic resins, cardboard and bottles are cost-heavy inputs—resin spot prices swung more than 30% during 2022–24, tying packaging cost cycles to oil and logistics and increasing supplier leverage when disruptions occur; Clorox has noted packaging as a key commodity exposure. Multi-sourcing and lightweighting can cut resin dependence but require months to implement, while sustainability specs have reduced the pool of qualified suppliers.

Contract manufacturers and co-packers
Selective outsourcing gives Clorox operational flexibility but can elevate co-packer leverage when specialized lines are capacity constrained (peak utilization often >80%), and switching co-packers requires lengthy qualification, QA and regulatory re-approvals; Clorox reported roughly $6.65 billion in net sales in fiscal 2024, so volume commitments and dual-sourcing are used to regain bargaining power, while proprietary formulations protect IP but operationally bind supplier choices.

Regulatory-grade disinfectant inputs
EPA-registered disinfectants require compliant active ingredients and validated suppliers, and in 2024 EPA List N included about 530 approved products, concentrating demand on a limited set of validated actives and manufacturers. Fewer approved sources raise switching costs and supplier bargaining power, while required compliance documentation and periodic audits add procurement friction. During health crises allocation policies favor large-scale buyers but availability still tightens.
- Fewer approved actives increases supplier leverage
- Compliance audits add onboarding time and cost
- 2024 EPA List N ~530 products concentrates supply
- Allocation policies prioritize scale buyers during surges
Logistics and energy dependencies
Logistics and energy suppliers—freight carriers, ports, and utilities—directly affect Clorox’s delivered cost and service; tight US trucking markets and fuel spikes through 2022–24 sustained supplier leverage. Network optimization mitigates but cannot remove port/carrier constraints; onshoring and inventory buffers in 2024 reduce, not eliminate, exposure. US diesel avg 2024: $3.72/gal (EIA).
- Freight & ports: shape lead times and costs
- Trucking tightness: preserves supplier power
- Fuel volatility: raises input cost sensitivity
- Onshoring/inventory: buffer, not cure
Supplier concentration and co-packer bottlenecks amplify leverage amid >30% resin swings
Concentrated chemical and packaging suppliers, EPA-approved actives and specialized co-packers raise supplier bargaining power for Clorox, especially during shortages; resin spot swings >30% (2022–24) and co-packer peak utilization >80% amplify leverage. Clorox FY2024 net sales: $6.65B; US diesel avg 2024: $3.72/gal; EPA List N ~530 products.
| Metric | 2024/Range |
|---|---|
| FY2024 Sales | $6.65B |
| Resin price swing | >30% (2022–24) |
| EPA List N | ~530 products |
| Diesel avg | $3.72/gal |
What is included in the product
 Detailed Word Document
Provides a Clorox-specific Porter’s Five Forces assessment, revealing competitive intensity, buyer and supplier power, threat of new entrants and substitutes, and regulatory/distribution dynamics, highlighting disruptive threats and strategic levers to protect market share and profitability.

 Customizable Excel Spreadsheet
A concise one-sheet Porter's Five Forces for Clorox highlighting supplier and buyer power, competitive rivalry, substitutes, and entry threats—perfect for quick strategic decisions and ready to drop into investor decks or boardroom slides.
Customers Bargaining Power

Retailer concentration
Mass merchants, club stores and e-commerce platforms (Amazon holds about 38% of US e-commerce) control shelf access and terms, forcing Clorox to agree to price concessions, promotions and slotting arrangements; e-commerce penetration reached roughly 15% of US retail sales in 2024. Large accounts can demand markdowns and promotional funding; losing a top retailer can materially cut volumes and revenue. Joint business planning aligns some incentives but leaves significant retailer leverage intact.
Low switching costs
Low switching costs let consumers move freely among national brands and private labels—private-label share in U.S. food and household categories was about 18% in 2024—so functional parity across many SKUs raises price sensitivity. Brand equity cushions churn, but promotions commonly trigger substitution, with promotional periods accounting for as much as 30–40% of category purchases. Loyalty is strongest where disinfecting efficacy is claimed, yet efficacy-based preferences remain contestable by rivals and generics.

Private label pressure
Retailers expanded store brands in commoditized cleaners and wipes, with private-label penetration rising to about 20% in these categories by 2024 (NielsenIQ/IRI), tightening Clorox gross margins. Comparable performance at lower price points forces promotional and price defense. Branded differentiation via efficacy, scent, and sustainability works but raises marketing and R&D costs. Economic downturns amplify trade-down to private-label options.

Omnichannel transparency
Omnichannel transparency strengthens buyer bargaining: pervasive online reviews and price-comparison tools raise buyer information power, pressuring Clorox to match prices and prove value; marketplace and retail media growth diverted promotional spend to platforms (platform ad revenue up ~20% in 2024) while direct-to-consumer channels give first-party data but cannot fully offset marketplace fees of ~15–30%; growing assortment complexity increases return rates and customer service costs (e‑commerce return rates ~18% vs 8% in-store in 2024).
- Online reviews: higher buyer info
- Retail media: promotional spend shifted ~20% (2024)
- Marketplace fees: ~15–30%
- DTC: valuable data but limited margin recovery
- Assortment complexity: e‑commerce returns ~18% (2024)
Professional and institutional buyers
Professional and institutional buyers force Clorox into contract negotiations focused on efficacy, certifications, and total cost-in-use; FY2024 net sales were about $7.3 billion, highlighting exposure to large B2B accounts. Volume rebates, structured bid cycles and tenders—especially in healthcare and large facilities—compress pricing and margins, while performance credentials both raise switching costs and attract competitive undercuts.
- Contracts: efficacy, certifications, cost-in-use
- Pricing pressure: volume rebates, bid cycles
- Margins: tenders compress in healthcare/large facilities
- Switching: credentials limit but invite undercuts
Channel power (Amazon 38%) & e‑commerce (15%) compress margins
Large retailers (Amazon ~38% of US e‑commerce) and e‑commerce (≈15% of retail sales in 2024) dictate pricing, promotions and slotting, forcing concessions; private‑label share (~18–20% in household categories) and promotions (30–40% of category purchases) raise buyer price sensitivity; FY2024 net sales ~$7.3B expose Clorox to account risk; marketplace fees (~15–30%) and e‑commerce returns (~18% vs 8% in‑store) compress margins.
| Metric | 2024 |
|---|---|
| Amazon e‑commerce share | ~38% |
| e‑commerce retail share | ~15% |
| Private‑label household | 18–20% |
| Promotional spend impact | 30–40% |
| Net sales (FY2024) | $7.3B |
| Marketplace fees | 15–30% |
| e‑commerce returns | ~18% vs 8% |
What You See Is What You Get
Clorox Porter's Five Forces Analysis
This preview shows the exact Porter’s Five Forces analysis for The Clorox Company you'll receive after purchase. It covers supplier power, buyer power, threat of new entrants, substitutes, and competitive rivalry with concise, actionable insights. No placeholders or samples—instant download, professionally formatted and ready to use.

Original: $10.00
-65%$10.00
$3.50Product Information
Product Information
Shipping & Returns
Shipping & Returns
Description
Elevate Your Analysis with the Complete Porter's Five Forces Analysis
Clorox faces moderate buyer power, steady supplier influence, and a low threat of new entrants due to scale and brand strength, while substitutes and rivalry shape margin pressure; this snapshot highlights key competitive levers and strategic risks. Unlock the full Porter's Five Forces Analysis for force-by-force ratings, visuals, and actionable insights tailored to Clorox.
Suppliers Bargaining Power
Concentrated chemical inputs
Clorox relies on key commodities like sodium hypochlorite, surfactants, fragrances and resins sourced from a limited base of large chemical producers, creating concentrated supplier power. Supplier concentration tightens during shortages, lifting input prices; long-term contracts and hedging mitigate spikes but cannot eliminate structural scarcity. Clorox can pass costs to retailers, but transmission is lagged and constrained by retail competition.
Packaging and resin volatility
Plastic resins, cardboard and bottles are cost-heavy inputs—resin spot prices swung more than 30% during 2022–24, tying packaging cost cycles to oil and logistics and increasing supplier leverage when disruptions occur; Clorox has noted packaging as a key commodity exposure. Multi-sourcing and lightweighting can cut resin dependence but require months to implement, while sustainability specs have reduced the pool of qualified suppliers.
Contract manufacturers and co-packers
Selective outsourcing gives Clorox operational flexibility but can elevate co-packer leverage when specialized lines are capacity constrained (peak utilization often >80%), and switching co-packers requires lengthy qualification, QA and regulatory re-approvals; Clorox reported roughly $6.65 billion in net sales in fiscal 2024, so volume commitments and dual-sourcing are used to regain bargaining power, while proprietary formulations protect IP but operationally bind supplier choices.
Regulatory-grade disinfectant inputs
EPA-registered disinfectants require compliant active ingredients and validated suppliers, and in 2024 EPA List N included about 530 approved products, concentrating demand on a limited set of validated actives and manufacturers. Fewer approved sources raise switching costs and supplier bargaining power, while required compliance documentation and periodic audits add procurement friction. During health crises allocation policies favor large-scale buyers but availability still tightens.
- Fewer approved actives increases supplier leverage
- Compliance audits add onboarding time and cost
- 2024 EPA List N ~530 products concentrates supply
- Allocation policies prioritize scale buyers during surges
Logistics and energy dependencies
Logistics and energy suppliers—freight carriers, ports, and utilities—directly affect Clorox’s delivered cost and service; tight US trucking markets and fuel spikes through 2022–24 sustained supplier leverage. Network optimization mitigates but cannot remove port/carrier constraints; onshoring and inventory buffers in 2024 reduce, not eliminate, exposure. US diesel avg 2024: $3.72/gal (EIA).
- Freight & ports: shape lead times and costs
- Trucking tightness: preserves supplier power
- Fuel volatility: raises input cost sensitivity
- Onshoring/inventory: buffer, not cure
Supplier concentration and co-packer bottlenecks amplify leverage amid >30% resin swings
Concentrated chemical and packaging suppliers, EPA-approved actives and specialized co-packers raise supplier bargaining power for Clorox, especially during shortages; resin spot swings >30% (2022–24) and co-packer peak utilization >80% amplify leverage. Clorox FY2024 net sales: $6.65B; US diesel avg 2024: $3.72/gal; EPA List N ~530 products.
| Metric | 2024/Range |
|---|---|
| FY2024 Sales | $6.65B |
| Resin price swing | >30% (2022–24) |
| EPA List N | ~530 products |
| Diesel avg | $3.72/gal |
What is included in the product
Detailed Word Document
Provides a Clorox-specific Porter’s Five Forces assessment, revealing competitive intensity, buyer and supplier power, threat of new entrants and substitutes, and regulatory/distribution dynamics, highlighting disruptive threats and strategic levers to protect market share and profitability.
Customizable Excel Spreadsheet
A concise one-sheet Porter's Five Forces for Clorox highlighting supplier and buyer power, competitive rivalry, substitutes, and entry threats—perfect for quick strategic decisions and ready to drop into investor decks or boardroom slides.
Customers Bargaining Power
Retailer concentration
Mass merchants, club stores and e-commerce platforms (Amazon holds about 38% of US e-commerce) control shelf access and terms, forcing Clorox to agree to price concessions, promotions and slotting arrangements; e-commerce penetration reached roughly 15% of US retail sales in 2024. Large accounts can demand markdowns and promotional funding; losing a top retailer can materially cut volumes and revenue. Joint business planning aligns some incentives but leaves significant retailer leverage intact.
Low switching costs
Low switching costs let consumers move freely among national brands and private labels—private-label share in U.S. food and household categories was about 18% in 2024—so functional parity across many SKUs raises price sensitivity. Brand equity cushions churn, but promotions commonly trigger substitution, with promotional periods accounting for as much as 30–40% of category purchases. Loyalty is strongest where disinfecting efficacy is claimed, yet efficacy-based preferences remain contestable by rivals and generics.
Private label pressure
Retailers expanded store brands in commoditized cleaners and wipes, with private-label penetration rising to about 20% in these categories by 2024 (NielsenIQ/IRI), tightening Clorox gross margins. Comparable performance at lower price points forces promotional and price defense. Branded differentiation via efficacy, scent, and sustainability works but raises marketing and R&D costs. Economic downturns amplify trade-down to private-label options.
Omnichannel transparency
Omnichannel transparency strengthens buyer bargaining: pervasive online reviews and price-comparison tools raise buyer information power, pressuring Clorox to match prices and prove value; marketplace and retail media growth diverted promotional spend to platforms (platform ad revenue up ~20% in 2024) while direct-to-consumer channels give first-party data but cannot fully offset marketplace fees of ~15–30%; growing assortment complexity increases return rates and customer service costs (e‑commerce return rates ~18% vs 8% in-store in 2024).
- Online reviews: higher buyer info
- Retail media: promotional spend shifted ~20% (2024)
- Marketplace fees: ~15–30%
- DTC: valuable data but limited margin recovery
- Assortment complexity: e‑commerce returns ~18% (2024)
Professional and institutional buyers
Professional and institutional buyers force Clorox into contract negotiations focused on efficacy, certifications, and total cost-in-use; FY2024 net sales were about $7.3 billion, highlighting exposure to large B2B accounts. Volume rebates, structured bid cycles and tenders—especially in healthcare and large facilities—compress pricing and margins, while performance credentials both raise switching costs and attract competitive undercuts.
- Contracts: efficacy, certifications, cost-in-use
- Pricing pressure: volume rebates, bid cycles
- Margins: tenders compress in healthcare/large facilities
- Switching: credentials limit but invite undercuts
Channel power (Amazon 38%) & e‑commerce (15%) compress margins
Large retailers (Amazon ~38% of US e‑commerce) and e‑commerce (≈15% of retail sales in 2024) dictate pricing, promotions and slotting, forcing concessions; private‑label share (~18–20% in household categories) and promotions (30–40% of category purchases) raise buyer price sensitivity; FY2024 net sales ~$7.3B expose Clorox to account risk; marketplace fees (~15–30%) and e‑commerce returns (~18% vs 8% in‑store) compress margins.
| Metric | 2024 |
|---|---|
| Amazon e‑commerce share | ~38% |
| e‑commerce retail share | ~15% |
| Private‑label household | 18–20% |
| Promotional spend impact | 30–40% |
| Net sales (FY2024) | $7.3B |
| Marketplace fees | 15–30% |
| e‑commerce returns | ~18% vs 8% |
What You See Is What You Get
Clorox Porter's Five Forces Analysis
This preview shows the exact Porter’s Five Forces analysis for The Clorox Company you'll receive after purchase. It covers supplier power, buyer power, threat of new entrants, substitutes, and competitive rivalry with concise, actionable insights. No placeholders or samples—instant download, professionally formatted and ready to use.