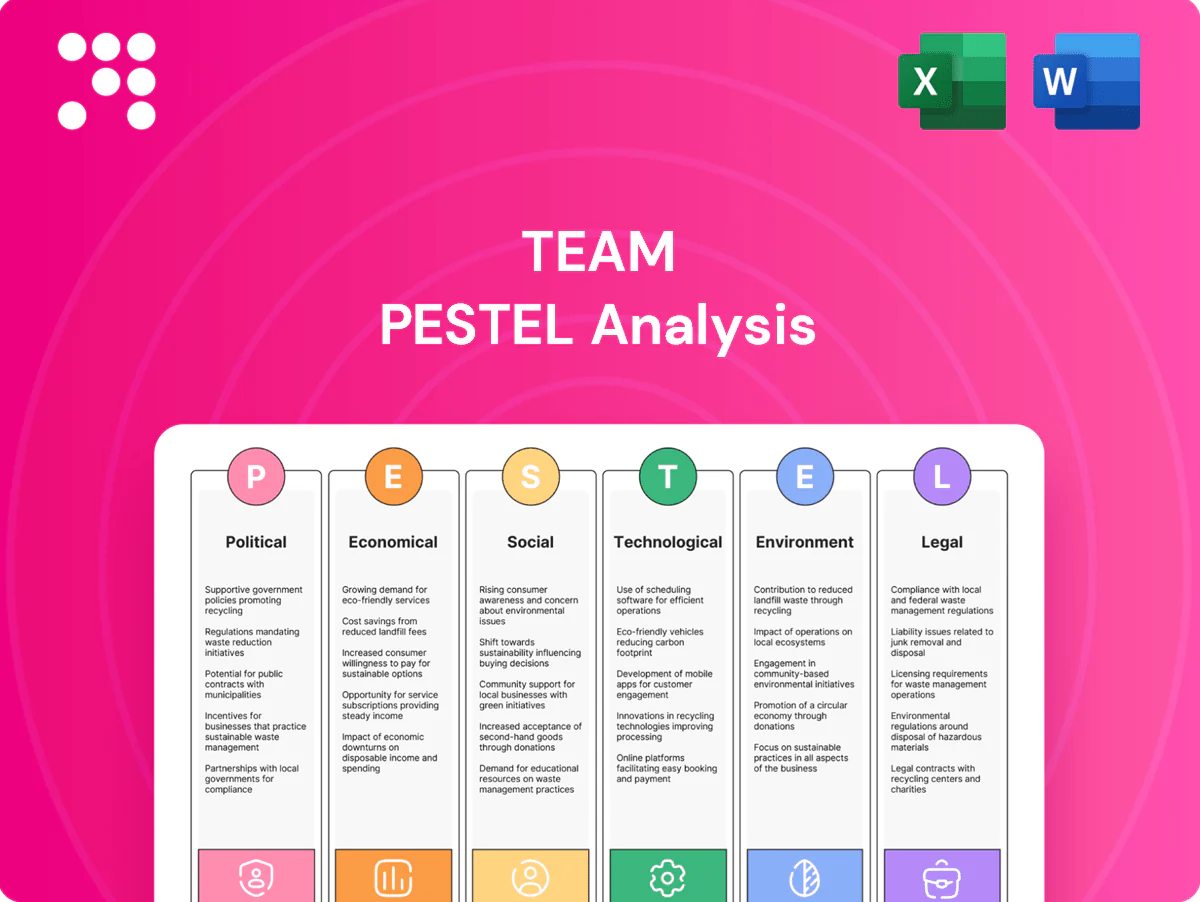
Team PESTLE Analysis

Your Shortcut to Market Insight Starts Here
Gain a strategic advantage with our PESTLE Analysis of Team. Discover how political, economic, social, technological, legal, and environmental forces shape its future and reveal key risks and opportunities. Purchase the full report for the complete, editable breakdown and actionable insights ready for immediate use.
Political factors

Energy policy direction
Shifts in national energy strategies reshape refinery, petrochemical, power and pipeline maintenance budgets as governments accelerate clean energy; for example the US Inflation Reduction Act channels roughly 369 billion USD toward clean energy deployment, redirecting private capital. Pro-renewable policy packages such as the EU Fit for 55 (55% emissions cut by 2030) increase life-extension work on fossil assets even as investment shifts. TEAM can market services that enable safer, lower-emission operations and leverage policy stability to secure multiyear inspection and mechanical contracts.
Infrastructure funding
The 2021 Bipartisan Infrastructure Law (~1.2 trillion) and subsequent energy packages have driven increased public spending on pipeline integrity and power reliability, with federal programs targeting an estimated 50–100 billion for grid modernization through 2030. Grants and tax credits typically require stringent inspection, reporting and documented remediation, creating recurring compliance assessments. TEAM benefits when assessments are compliance-triggered, but approval-to-spend lags of 6–24 months can create hidden backlog visibility.

Trade and tariffs
Tariffs on specialty metals and equipment (US Section 301 duties up to 25%) raise input costs for mechanical and heat-treat work and cross-border restrictions can delay parts and tools, increasing procurement risk; global applied tariffs average about 2.9% (WTO). TEAM’s supply-chain strategy and increased local sourcing reduce exposure and lead-time volatility, but clients often defer projects when import costs spike sharply.

Geopolitical risk and sanctions
Sanctions and regional conflicts disrupt oil and gas flows—e.g., post‑2022 shifts removed an estimated 2–3 million barrels/day from usual trade lanes—altering utilization and maintenance cycles; high volatility (Brent ranged roughly $70–120/bbl 2022–24) triggers urgent integrity projects but delays noncritical upgrades. TEAM’s diversified end‑markets cushion exposure and compliance programs must screen counterparties and projects.
- Impact: 2–3M b/d supply shifts
- Price range: Brent ~$70–120/bbl (2022–24)
- Operational: urgent integrity vs delayed upgrades
- Mitigation: diversification + enhanced screening
Regulatory enforcement intensity
Changes in administration priorities shift OSHA, EPA and PHMSA focus, with OSHA inspections up roughly 15% from 2020–2023 and EPA civil enforcement actions returning about $1.3 billion in FY2023, driving tighter oversight, more frequent inspections and heavier documentation requirements.
TEAM’s compliance-ready methodologies become a market differentiator under intensified enforcement, while periods of lax oversight can compress near-term demand but amplify long-term regulatory and liability risk.
- Regulatory shift: enforcement intensity ↑ (OSHA ~15% rise 2020–2023)
- Financial impact: EPA enforcement ~$1.3B FY2023
- Opportunity: TEAM compliance methods = differentiation
- Risk: lax enforcement → short-term demand drop, higher long-term exposure
Policy and infrastructure drives private capex to low-carbon projects and recurring compliance work
Shifts in energy policy (US IRA ~$369B, EU Fit for 55) redirect private capex toward low‑carbon projects while sustaining life‑extension work on fossil assets; TEAM can sell low‑emission maintenance and multiyear inspection contracts. Infrastructure spending (BIL ~$1.2T; grid modernization $50–100B to 2030) and tighter enforcement (OSHA inspections +15% 2020–23; EPA ~$1.3B FY2023) drive recurring compliance work. Tariffs (Section 301 up to 25%; global avg 2.9%) and sanctions (2–3M b/d shifts) raise procurement and demand volatility; local sourcing and screening mitigate risk.
| Metric | Value |
|---|---|
| US IRA | $369B |
| BIL | $1.2T |
| Grid spend to 2030 | $50–100B |
| OSHA inspections Δ | +15% (2020–23) |
| EPA enforcement FY2023 | $1.3B |
| Brent 2024 avg | ~$86/bbl |
What is included in the product
 Detailed Word Document
Explores how Political, Economic, Social, Technological, Environmental and Legal forces uniquely affect the Team, with each category expanded into detailed, data-backed subpoints and region‑/industry‑specific examples; designed to help executives, consultants and entrepreneurs identify threats, opportunities and forward-looking scenarios for strategy, funding and operational planning.

 Customizable Excel Spreadsheet
Condenses team PESTLE findings into a clear, visually segmented summary that’s easily shareable and editable for local context, enabling quick alignment in meetings and seamless drop‑in use for presentations or planning sessions.
Economic factors

Commodity price cycles
Commodity price cycles matter because upstream and midstream cash flows track Brent, which averaged about $86/barrel in 2024, directly shaping maintenance and turnaround budgets; midstream receipts fell in low-price months, deferring work. Refiners boosted spending when US 3-2-1 crack spreads averaged near $18/barrel in 2024 to protect throughput. TEAM’s services are partly nondiscretionary but timing-sensitive, and diversification into power and chemicals smooths revenue volatility.
Industrial capex and OPEX
Shift from growth capex to asset-life extension is boosting demand for inspection and heat-treat services, with industry surveys in 2024 reporting over 60% of capital projects refocused on life-extension and brownfield works. OPEX prioritization now favors reliability services with rapid ROI, as operators target 10–20% outage-cost reductions. TEAM can sell outage reduction and risk-mitigation value; tightening budgets compress pricing and scope.

Inflation and labor costs
Wage inflation for certified technicians and NDT specialists is squeezing margins as pay rises have outpaced headline inflation; US CPI was 3.4% in 2023. Consumables and equipment costs climb with CPI and episodic supply shocks, pushing input inflation higher. Index-linked pricing and productivity tools (automation, remote inspection) help preserve profitability. Clients pushing fixed bids creates a risk-sharing tension on contracts.

Interest rates and credit
Higher rates (Fed funds 5.25–5.50% as of Jul 2025, 10y Treasury ~4.2%) push client hurdle rates higher and can delay large turnarounds; rate declines typically unlock deferred projects. TEAM’s financing cost and bank spreads (~250bp corporate spread) directly limit capacity to scale and invest in tech. Strong backlog visibility supports working capital and reduces short-term liquidity strain.
- Fed funds 5.25–5.50% (Jul 2025)
- 10y Treasury ~4.2%
- Corporate spread ~250bp
- Backlog = key WC buffer
Customer consolidation
Customer consolidation via mergers of refiners, utilities and midstream firms creates larger buyers with significant procurement leverage, often driving supplier price concessions in the 5–12% range and favoring standardized vendor lists if TEAM is prequalified.
Multi-site contracts provide scale but impose tighter SLAs (often <24–48h response) and hinge on deep relationships plus performance data transparency.
- Procurement leverage: 5–12% supplier discounts
- SLAs: typical response <24–48h
- Win factors: standardized vendor lists, performance metrics
Policy and infrastructure drives private capex to low-carbon projects and recurring compliance work
Brent ~ $86/bbl (2024) and US 3-2-1 crack ~ $18/bbl tightened midstream/refinery cashflows, boosting life-extension demand; operators favor OPEX with 10–20% outage cost targets. Wage and input inflation squeeze margins; automation and index-linked pricing mitigate. Rates (Fed 5.25–5.50% Jul 2025; 10y ~4.2%; corp spread ~250bp) raise client hurdles and capex timing; backlog and multi-site scale are key buffers.
| Metric | Value |
|---|---|
| Brent (2024) | $86/bbl |
| 3-2-1 crack (2024) | $18/bbl |
| Fed funds (Jul 2025) | 5.25–5.50% |
| 10y Treasury | ~4.2% |
| Corporate spread | ~250bp |
| Procurement discounts | 5–12% |
Preview Before You Purchase
Team PESTLE Analysis
The preview shown here is the exact Team PESTLE Analysis document you’ll receive after purchase—fully formatted and ready to use. This real file contains the same layout, content, and structure visible now. No placeholders or teasers—download the finished document instantly after checkout.

Product Information
Product Information
Shipping & Returns
Shipping & Returns
Description
Your Shortcut to Market Insight Starts Here
Gain a strategic advantage with our PESTLE Analysis of Team. Discover how political, economic, social, technological, legal, and environmental forces shape its future and reveal key risks and opportunities. Purchase the full report for the complete, editable breakdown and actionable insights ready for immediate use.
Political factors
Energy policy direction
Shifts in national energy strategies reshape refinery, petrochemical, power and pipeline maintenance budgets as governments accelerate clean energy; for example the US Inflation Reduction Act channels roughly 369 billion USD toward clean energy deployment, redirecting private capital. Pro-renewable policy packages such as the EU Fit for 55 (55% emissions cut by 2030) increase life-extension work on fossil assets even as investment shifts. TEAM can market services that enable safer, lower-emission operations and leverage policy stability to secure multiyear inspection and mechanical contracts.
Infrastructure funding
The 2021 Bipartisan Infrastructure Law (~1.2 trillion) and subsequent energy packages have driven increased public spending on pipeline integrity and power reliability, with federal programs targeting an estimated 50–100 billion for grid modernization through 2030. Grants and tax credits typically require stringent inspection, reporting and documented remediation, creating recurring compliance assessments. TEAM benefits when assessments are compliance-triggered, but approval-to-spend lags of 6–24 months can create hidden backlog visibility.
Trade and tariffs
Tariffs on specialty metals and equipment (US Section 301 duties up to 25%) raise input costs for mechanical and heat-treat work and cross-border restrictions can delay parts and tools, increasing procurement risk; global applied tariffs average about 2.9% (WTO). TEAM’s supply-chain strategy and increased local sourcing reduce exposure and lead-time volatility, but clients often defer projects when import costs spike sharply.
Geopolitical risk and sanctions
Sanctions and regional conflicts disrupt oil and gas flows—e.g., post‑2022 shifts removed an estimated 2–3 million barrels/day from usual trade lanes—altering utilization and maintenance cycles; high volatility (Brent ranged roughly $70–120/bbl 2022–24) triggers urgent integrity projects but delays noncritical upgrades. TEAM’s diversified end‑markets cushion exposure and compliance programs must screen counterparties and projects.
- Impact: 2–3M b/d supply shifts
- Price range: Brent ~$70–120/bbl (2022–24)
- Operational: urgent integrity vs delayed upgrades
- Mitigation: diversification + enhanced screening
Regulatory enforcement intensity
Changes in administration priorities shift OSHA, EPA and PHMSA focus, with OSHA inspections up roughly 15% from 2020–2023 and EPA civil enforcement actions returning about $1.3 billion in FY2023, driving tighter oversight, more frequent inspections and heavier documentation requirements.
TEAM’s compliance-ready methodologies become a market differentiator under intensified enforcement, while periods of lax oversight can compress near-term demand but amplify long-term regulatory and liability risk.
- Regulatory shift: enforcement intensity ↑ (OSHA ~15% rise 2020–2023)
- Financial impact: EPA enforcement ~$1.3B FY2023
- Opportunity: TEAM compliance methods = differentiation
- Risk: lax enforcement → short-term demand drop, higher long-term exposure
Policy and infrastructure drives private capex to low-carbon projects and recurring compliance work
Shifts in energy policy (US IRA ~$369B, EU Fit for 55) redirect private capex toward low‑carbon projects while sustaining life‑extension work on fossil assets; TEAM can sell low‑emission maintenance and multiyear inspection contracts. Infrastructure spending (BIL ~$1.2T; grid modernization $50–100B to 2030) and tighter enforcement (OSHA inspections +15% 2020–23; EPA ~$1.3B FY2023) drive recurring compliance work. Tariffs (Section 301 up to 25%; global avg 2.9%) and sanctions (2–3M b/d shifts) raise procurement and demand volatility; local sourcing and screening mitigate risk.
| Metric | Value |
|---|---|
| US IRA | $369B |
| BIL | $1.2T |
| Grid spend to 2030 | $50–100B |
| OSHA inspections Δ | +15% (2020–23) |
| EPA enforcement FY2023 | $1.3B |
| Brent 2024 avg | ~$86/bbl |
What is included in the product
Detailed Word Document
Explores how Political, Economic, Social, Technological, Environmental and Legal forces uniquely affect the Team, with each category expanded into detailed, data-backed subpoints and region‑/industry‑specific examples; designed to help executives, consultants and entrepreneurs identify threats, opportunities and forward-looking scenarios for strategy, funding and operational planning.
Customizable Excel Spreadsheet
Condenses team PESTLE findings into a clear, visually segmented summary that’s easily shareable and editable for local context, enabling quick alignment in meetings and seamless drop‑in use for presentations or planning sessions.
Economic factors
Commodity price cycles
Commodity price cycles matter because upstream and midstream cash flows track Brent, which averaged about $86/barrel in 2024, directly shaping maintenance and turnaround budgets; midstream receipts fell in low-price months, deferring work. Refiners boosted spending when US 3-2-1 crack spreads averaged near $18/barrel in 2024 to protect throughput. TEAM’s services are partly nondiscretionary but timing-sensitive, and diversification into power and chemicals smooths revenue volatility.
Industrial capex and OPEX
Shift from growth capex to asset-life extension is boosting demand for inspection and heat-treat services, with industry surveys in 2024 reporting over 60% of capital projects refocused on life-extension and brownfield works. OPEX prioritization now favors reliability services with rapid ROI, as operators target 10–20% outage-cost reductions. TEAM can sell outage reduction and risk-mitigation value; tightening budgets compress pricing and scope.
Inflation and labor costs
Wage inflation for certified technicians and NDT specialists is squeezing margins as pay rises have outpaced headline inflation; US CPI was 3.4% in 2023. Consumables and equipment costs climb with CPI and episodic supply shocks, pushing input inflation higher. Index-linked pricing and productivity tools (automation, remote inspection) help preserve profitability. Clients pushing fixed bids creates a risk-sharing tension on contracts.
Interest rates and credit
Higher rates (Fed funds 5.25–5.50% as of Jul 2025, 10y Treasury ~4.2%) push client hurdle rates higher and can delay large turnarounds; rate declines typically unlock deferred projects. TEAM’s financing cost and bank spreads (~250bp corporate spread) directly limit capacity to scale and invest in tech. Strong backlog visibility supports working capital and reduces short-term liquidity strain.
- Fed funds 5.25–5.50% (Jul 2025)
- 10y Treasury ~4.2%
- Corporate spread ~250bp
- Backlog = key WC buffer
Customer consolidation
Customer consolidation via mergers of refiners, utilities and midstream firms creates larger buyers with significant procurement leverage, often driving supplier price concessions in the 5–12% range and favoring standardized vendor lists if TEAM is prequalified.
Multi-site contracts provide scale but impose tighter SLAs (often <24–48h response) and hinge on deep relationships plus performance data transparency.
- Procurement leverage: 5–12% supplier discounts
- SLAs: typical response <24–48h
- Win factors: standardized vendor lists, performance metrics
Policy and infrastructure drives private capex to low-carbon projects and recurring compliance work
Brent ~ $86/bbl (2024) and US 3-2-1 crack ~ $18/bbl tightened midstream/refinery cashflows, boosting life-extension demand; operators favor OPEX with 10–20% outage cost targets. Wage and input inflation squeeze margins; automation and index-linked pricing mitigate. Rates (Fed 5.25–5.50% Jul 2025; 10y ~4.2%; corp spread ~250bp) raise client hurdles and capex timing; backlog and multi-site scale are key buffers.
| Metric | Value |
|---|---|
| Brent (2024) | $86/bbl |
| 3-2-1 crack (2024) | $18/bbl |
| Fed funds (Jul 2025) | 5.25–5.50% |
| 10y Treasury | ~4.2% |
| Corporate spread | ~250bp |
| Procurement discounts | 5–12% |
Preview Before You Purchase
Team PESTLE Analysis
The preview shown here is the exact Team PESTLE Analysis document you’ll receive after purchase—fully formatted and ready to use. This real file contains the same layout, content, and structure visible now. No placeholders or teasers—download the finished document instantly after checkout.











