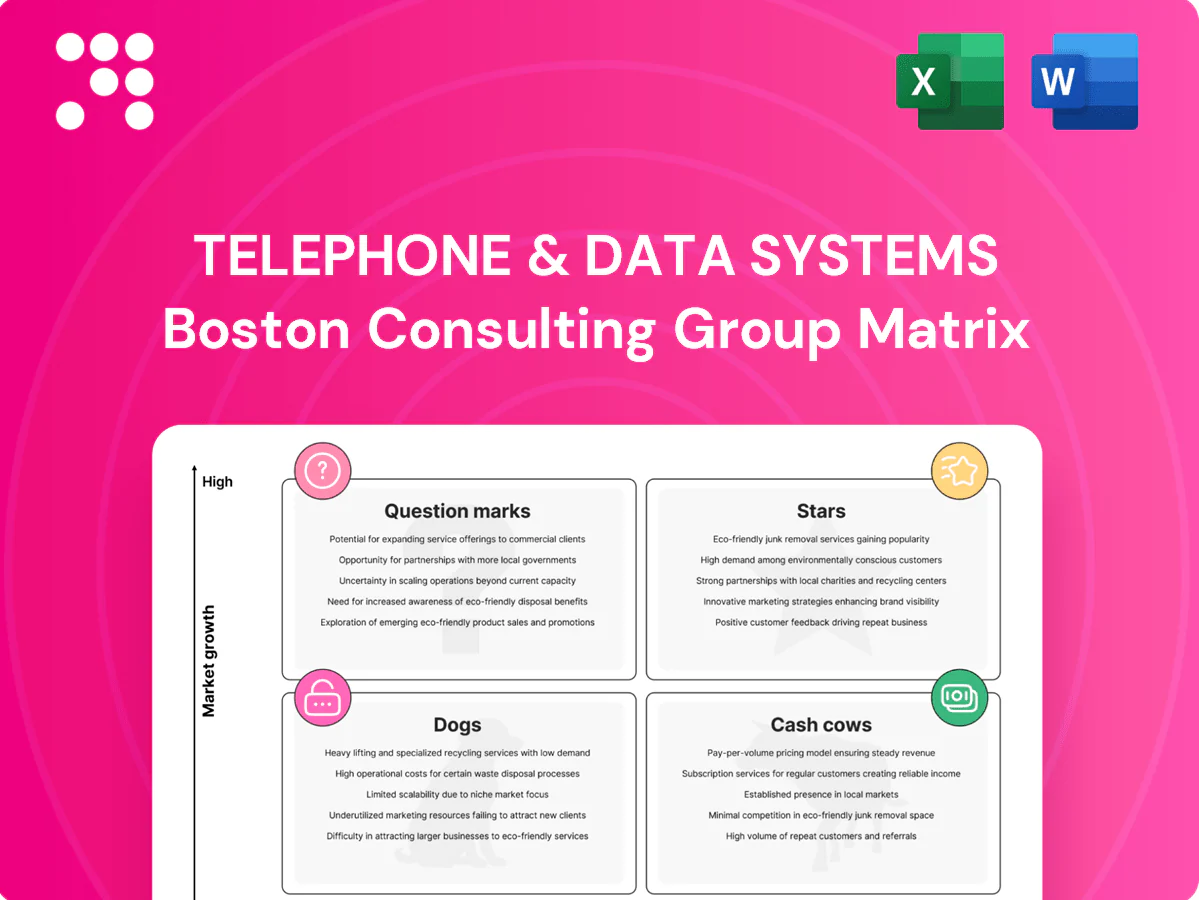
Telephone & Data Systems Boston Consulting Group Matrix

Unlock Strategic Clarity
Curious how Telephone & Data Systems' products stack up—Stars, Cash Cows, Dogs or Question Marks? This snapshot teases positioning and market momentum, but the full BCG Matrix lays out quadrant placements, revenue impact, and clear strategic moves. Purchase the complete report for a ready-to-use Word and Excel package that helps you reallocate capital and prioritize growth with confidence.
Stars

U.S. Cellular 5G expansion in growth corridors
U.S. Cellular is expanding mid-band 5G in high-growth regional corridors where it already holds meaningful share, driving customer adds through materially improved coverage and speed; however, network densification and elevated capex plus promotional spend are pressuring near-term cash flow. Keep accelerating site builds and retail placement to lock in share gains. If momentum is sustained, these corridors can mature into dependable cash yield streams.
TDS Telecom fiber-to-the-home builds
Fiber is surging and TDS is gaining share where it lights up new neighborhoods, targeting roughly 1.2 million passings by 2026 and increasing 2024 capex to about $800M to accelerate builds; take rates for gig tiers often top 30% in greenfield areas with sticky bundles boosting ARPU, but per‑pass build costs remain steep at roughly $1,200–$2,500; prioritize markets with strong demand signals and fast permitting; if share holds as areas mature this can convert into a high‑margin cash machine.

Business fiber + Ethernet services
Enterprises are upgrading connectivity and TDS wins where it is on-net by offering competitive SLAs; on-net locations deliver strong revenue per site, often several thousand dollars monthly. Ongoing sales coverage and account care are required to sustain ARPU and prevent churn. Expanding footprints along existing routes lowers unit costs, so scale now while the business fiber/Ethernet market—growing roughly 8% CAGR into 2024—remains expansive.

Managed/hosted voice and UCaaS for SMBs
Managed/hosted voice and UCaaS for SMBs sits in the Stars quadrant: global UCaaS market ~35.8 billion USD in 2024 (MarketsandMarkets) with strong CAGR; bundling with broadband materially reduces churn and increases lifetime value, but requires consistent onboarding, support and channel incentives to scale. Cross-selling into TDS’s existing SMB base keeps CAC manageable; nail the experience and it converts into steady-margin recurring revenue.
- Market: UCaaS ~35.8B (2024)
- Retention: bundling cuts churn materially
- Go-to-market: invest onboarding/support/channel incentives
- Unit economics: cross-sell lowers CAC, drives recurring margins
Fixed wireless access in underserved areas
Where fiber isn’t feasible yet, FWA fills the gap and grabs share quickly, enabling deployments in weeks and meeting 2024 surge demand for rural broadband.
It drives quick installs and decent ARPU while requiring active spectrum and capacity management to avoid congestion as traffic scales in 2024.
Target pockets with weak cable competition to maximize win rates; invest while 2024 demand spikes, then focus on cost optimization and backhaul upgrades.
- Deployment speed: weeks
- Focus: weak cable markets
- Key risks: spectrum/capacity
- Strategy: invest during 2024 demand spike
Mid-band 5G, fiber & FWA lift ARPU but strain cash; 2024 capex ~$800M
Stars: Mid‑band 5G corridors and fiber builds driving share gains but pressuring near‑term cash with 2024 capex ~800M; UCaaS (~35.8B in 2024) and enterprise on‑net fiber show high ARPU/retention; FWA fills gaps with rapid installs but needs spectrum/backhaul upgrades.
| Metric | 2024 |
|---|---|
| Capex | ~$800M |
| Fiber target | 1.2M passings by 2026 |
| UCaaS market | $35.8B |
What is included in the product
 Detailed Word Document
BCG Matrix review of Telephone & Data Systems: identifies Stars, Cash Cows, Question Marks and Dogs with investment, hold, divest guidance.

 Customizable Excel Spreadsheet
One-page BCG Matrix placing TDS business units in quadrants to relieve portfolio pain points and speed executive decisions
Cash Cows

Incumbent wireline broadband in mature towns
Incumbent wireline broadband in mature towns delivers stable subscriber bases with high local share and predictable usage, supporting TDS’s 2024 wireline segment that contributed roughly $1.6B of revenue. Growth is low but margins remain healthy due to sunk infrastructure; modest upgrades and retention offers keep churn near single digits. These cash flows are being milked to fund fiber and 5G buildouts.
Core postpaid wireless base in legacy strongholds
Core postpaid base in legacy strongholds yields loyal customers with ARPU around $60 in 2024 and materially lower acquisition costs versus national entrants; market growth is modest (low-single digits) but service revenue is dependable, supporting stable free cash flow. Maintain network reliability and targeted perks over heavy promos to protect margins and use cash flow to underwrite selective expansion bets.

Wholesale backhaul and carrier services
Wholesale backhaul and carrier services deliver steady cash for TDS via multi-year contracts and low churn, producing solid contribution margins that fund capex elsewhere. Growth is slow as route expansion is limited, but utilization on existing routes remains high, enabling unit-cost leverage. Keep opex tight and pursue targeted capacity upsells to maximize margin and free cash flow. Efficient, quiet cash generator.

Tower and site leasing income
Tower and site leasing income delivers recurring rental streams with minimal incremental cost, offering steady, high-margin cash flow that is not a high-growth arena but highly predictable; U.S. tower count was roughly 170,000 and global towers about 1.2 million in 2024, supporting robust leasing demand. Maintaining high uptime and multi-tenant tenancy drives utilization, making site leasing a steady funder for new builds and network expansion.
- Recurring rentals: low incremental cost
- Predictability: stable cash cow
- Operations: uptime critical, multi-tenant upside
- Capital role: funds new builds
Video add-ons in stable footprints
Video add-ons sit in stable footprints: pay-TV penetration was about 60% in 2024, and attached customers show roughly 20% lower churn versus broadband-only, so bundles extend lifetime value even as linear demand stalls. Keep packaging simple, cap content spend and prioritize retention programs over aggressive acquisition to maintain cash-positive margins while the base holds.
- Retention focus
- Simple packaging
- Limit content cost exposure
- ~20% lower churn for bundled customers (2024)
- Cash positive while base stable
Stable wireline, towers and postpaid ARPU fund fiber & 5G — retention and tight opex
Stable wireline, postpaid core, wholesale backhaul and tower leases generate predictable, high-margin cash flow (wireline rev ~$1.6B; postpaid ARPU ~$60 in 2024) funding fiber and 5G builds while video bundles cut churn. Focus on retention, tight opex and selective upsells to maximize free cash flow.
| Metric | 2024 |
|---|---|
| Wireline rev | $1.6B |
| Postpaid ARPU | $60 |
| US towers | ~170,000 |
| Pay-TV pen. | 60% |
Full Transparency, Always
Telephone & Data Systems BCG Matrix
The file you're previewing is the exact Telephone & Data Systems BCG Matrix you'll receive after purchase—no watermarks, no demo text, just the finished, fully formatted report. It’s built for strategic clarity and immediate use: edit, print, or present straight away. Crafted by analysts for C-suite decision-making, the document arrives ready to plug into planning or investor decks. No surprises—what you see is what you get.

Product Information
Product Information
Shipping & Returns
Shipping & Returns
Description
Unlock Strategic Clarity
Curious how Telephone & Data Systems' products stack up—Stars, Cash Cows, Dogs or Question Marks? This snapshot teases positioning and market momentum, but the full BCG Matrix lays out quadrant placements, revenue impact, and clear strategic moves. Purchase the complete report for a ready-to-use Word and Excel package that helps you reallocate capital and prioritize growth with confidence.
Stars
U.S. Cellular 5G expansion in growth corridors
U.S. Cellular is expanding mid-band 5G in high-growth regional corridors where it already holds meaningful share, driving customer adds through materially improved coverage and speed; however, network densification and elevated capex plus promotional spend are pressuring near-term cash flow. Keep accelerating site builds and retail placement to lock in share gains. If momentum is sustained, these corridors can mature into dependable cash yield streams.
TDS Telecom fiber-to-the-home builds
Fiber is surging and TDS is gaining share where it lights up new neighborhoods, targeting roughly 1.2 million passings by 2026 and increasing 2024 capex to about $800M to accelerate builds; take rates for gig tiers often top 30% in greenfield areas with sticky bundles boosting ARPU, but per‑pass build costs remain steep at roughly $1,200–$2,500; prioritize markets with strong demand signals and fast permitting; if share holds as areas mature this can convert into a high‑margin cash machine.
Business fiber + Ethernet services
Enterprises are upgrading connectivity and TDS wins where it is on-net by offering competitive SLAs; on-net locations deliver strong revenue per site, often several thousand dollars monthly. Ongoing sales coverage and account care are required to sustain ARPU and prevent churn. Expanding footprints along existing routes lowers unit costs, so scale now while the business fiber/Ethernet market—growing roughly 8% CAGR into 2024—remains expansive.
Managed/hosted voice and UCaaS for SMBs
Managed/hosted voice and UCaaS for SMBs sits in the Stars quadrant: global UCaaS market ~35.8 billion USD in 2024 (MarketsandMarkets) with strong CAGR; bundling with broadband materially reduces churn and increases lifetime value, but requires consistent onboarding, support and channel incentives to scale. Cross-selling into TDS’s existing SMB base keeps CAC manageable; nail the experience and it converts into steady-margin recurring revenue.
- Market: UCaaS ~35.8B (2024)
- Retention: bundling cuts churn materially
- Go-to-market: invest onboarding/support/channel incentives
- Unit economics: cross-sell lowers CAC, drives recurring margins
Fixed wireless access in underserved areas
Where fiber isn’t feasible yet, FWA fills the gap and grabs share quickly, enabling deployments in weeks and meeting 2024 surge demand for rural broadband.
It drives quick installs and decent ARPU while requiring active spectrum and capacity management to avoid congestion as traffic scales in 2024.
Target pockets with weak cable competition to maximize win rates; invest while 2024 demand spikes, then focus on cost optimization and backhaul upgrades.
- Deployment speed: weeks
- Focus: weak cable markets
- Key risks: spectrum/capacity
- Strategy: invest during 2024 demand spike
Mid-band 5G, fiber & FWA lift ARPU but strain cash; 2024 capex ~$800M
Stars: Mid‑band 5G corridors and fiber builds driving share gains but pressuring near‑term cash with 2024 capex ~800M; UCaaS (~35.8B in 2024) and enterprise on‑net fiber show high ARPU/retention; FWA fills gaps with rapid installs but needs spectrum/backhaul upgrades.
| Metric | 2024 |
|---|---|
| Capex | ~$800M |
| Fiber target | 1.2M passings by 2026 |
| UCaaS market | $35.8B |
What is included in the product
Detailed Word Document
BCG Matrix review of Telephone & Data Systems: identifies Stars, Cash Cows, Question Marks and Dogs with investment, hold, divest guidance.
Customizable Excel Spreadsheet
One-page BCG Matrix placing TDS business units in quadrants to relieve portfolio pain points and speed executive decisions
Cash Cows
Incumbent wireline broadband in mature towns
Incumbent wireline broadband in mature towns delivers stable subscriber bases with high local share and predictable usage, supporting TDS’s 2024 wireline segment that contributed roughly $1.6B of revenue. Growth is low but margins remain healthy due to sunk infrastructure; modest upgrades and retention offers keep churn near single digits. These cash flows are being milked to fund fiber and 5G buildouts.
Core postpaid wireless base in legacy strongholds
Core postpaid base in legacy strongholds yields loyal customers with ARPU around $60 in 2024 and materially lower acquisition costs versus national entrants; market growth is modest (low-single digits) but service revenue is dependable, supporting stable free cash flow. Maintain network reliability and targeted perks over heavy promos to protect margins and use cash flow to underwrite selective expansion bets.
Wholesale backhaul and carrier services
Wholesale backhaul and carrier services deliver steady cash for TDS via multi-year contracts and low churn, producing solid contribution margins that fund capex elsewhere. Growth is slow as route expansion is limited, but utilization on existing routes remains high, enabling unit-cost leverage. Keep opex tight and pursue targeted capacity upsells to maximize margin and free cash flow. Efficient, quiet cash generator.
Tower and site leasing income
Tower and site leasing income delivers recurring rental streams with minimal incremental cost, offering steady, high-margin cash flow that is not a high-growth arena but highly predictable; U.S. tower count was roughly 170,000 and global towers about 1.2 million in 2024, supporting robust leasing demand. Maintaining high uptime and multi-tenant tenancy drives utilization, making site leasing a steady funder for new builds and network expansion.
- Recurring rentals: low incremental cost
- Predictability: stable cash cow
- Operations: uptime critical, multi-tenant upside
- Capital role: funds new builds
Video add-ons in stable footprints
Video add-ons sit in stable footprints: pay-TV penetration was about 60% in 2024, and attached customers show roughly 20% lower churn versus broadband-only, so bundles extend lifetime value even as linear demand stalls. Keep packaging simple, cap content spend and prioritize retention programs over aggressive acquisition to maintain cash-positive margins while the base holds.
- Retention focus
- Simple packaging
- Limit content cost exposure
- ~20% lower churn for bundled customers (2024)
- Cash positive while base stable
Stable wireline, towers and postpaid ARPU fund fiber & 5G — retention and tight opex
Stable wireline, postpaid core, wholesale backhaul and tower leases generate predictable, high-margin cash flow (wireline rev ~$1.6B; postpaid ARPU ~$60 in 2024) funding fiber and 5G builds while video bundles cut churn. Focus on retention, tight opex and selective upsells to maximize free cash flow.
| Metric | 2024 |
|---|---|
| Wireline rev | $1.6B |
| Postpaid ARPU | $60 |
| US towers | ~170,000 |
| Pay-TV pen. | 60% |
Full Transparency, Always
Telephone & Data Systems BCG Matrix
The file you're previewing is the exact Telephone & Data Systems BCG Matrix you'll receive after purchase—no watermarks, no demo text, just the finished, fully formatted report. It’s built for strategic clarity and immediate use: edit, print, or present straight away. Crafted by analysts for C-suite decision-making, the document arrives ready to plug into planning or investor decks. No surprises—what you see is what you get.