Stef Porter's Five Forces Analysis

Elevate Your Analysis with the Complete Porter's Five Forces Analysis
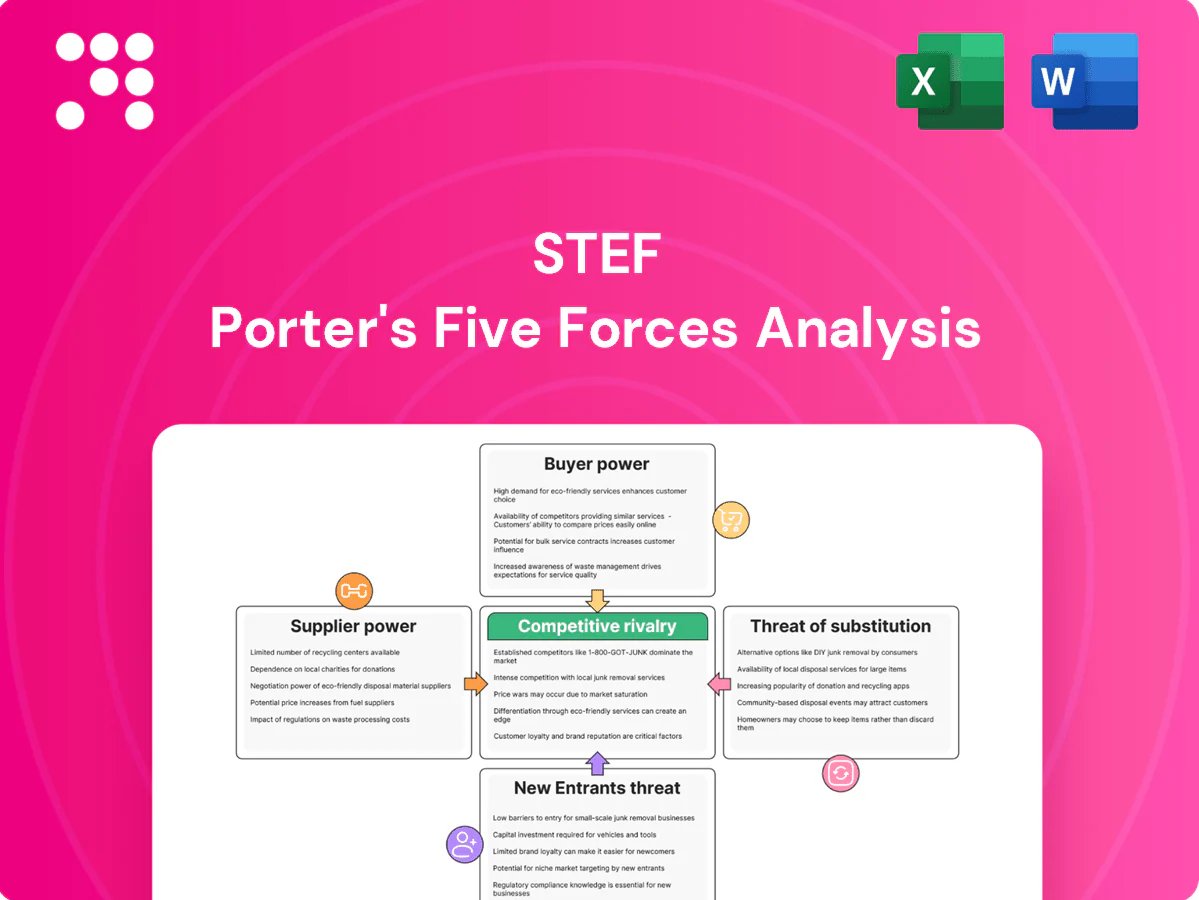
Stef's Porter's Five Forces snapshot highlights supplier leverage, buyer power, competitive rivalry, entry barriers, and substitute threats shaping its market position. This concise view surfaces key vulnerabilities and strategic levers for growth. Unlock the full Porter's Five Forces Analysis for force-by-force ratings, visuals, and actionable recommendations to inform investment or strategy.
Suppliers Bargaining Power

Fuel and energy dependence
Diesel (US average ~$3.80/gal in 2024) and industrial electricity (~12.5¢/kWh in 2024) are critical inputs for refrigerated fleets and cold stores, giving fuel and utility suppliers leverage through price volatility.
Hedging can reduce but not eliminate exposure; energy transitions to biofuels and EV charging introduce capital and switching costs that lock operators in.
Pass-through clauses ease pressure, but timing gaps between cost spikes and contract adjustments compress margins.
Specialized cold-chain equipment
Refrigerated truck bodies, trailers and HVAC units are supplied mainly by a few OEMs—Thermo King and Carrier Transicold together hold roughly 60–70% of the market—giving suppliers strong replacement and maintenance leverage. Lead times and parts shortages in 2024 averaged 12–20 weeks, constraining capacity and fleet uptime. Long asset lives (8–12 years) lock fleets into vendors, though preventive maintenance contracts can cut unplanned downtime by ~20–30% and partially rebalance terms.

Skilled labor and drivers
Qualified drivers and warehouse operatives with cold-chain experience are scarce in Europe, with the IRU estimating a shortfall of around 400,000 drivers, boosting supplier bargaining power.
Wage inflation (UK HGV pay rose ~10% in 2022–23) and EU hours-of-service limits (max 9h/day, 56h/week) raise operating costs and reduce flexibility.
Strong unions and divergent local labor laws add rigidity, though company training pipelines and retention programs are increasingly reducing dependence on external hires.

Real estate and cold-storage landlords
IT, telematics, and sensors
IT, telematics, and sensor vendors wield supplier power via proprietary TMS/WMS and telemetry ecosystems that raise integration and validation costs, creating measurable lock-in; cybersecurity and uptime demands amplify criticality, with industry SLAs commonly at 99.99% availability and the 2024 IBM Cost of a Data Breach report showing an average breach cost of $4.45M.
Energy, OEM scarcity and driver gap boost supplier power; telematics lock-in raises switching costs
Energy (diesel ~$3.80/gal; electricity ~12.5¢/kWh in 2024) and HVAC OEMs (Thermo King + Carrier Transicold ~60–70% share; 12–20 week lead times) give suppliers pricing and availability leverage.
Labor shortages (IRU ~400,000 driver gap) and wage inflation lift bargaining power; long asset lives (8–12y) and 10+yr leases increase lock-in.
IT/telematics lock-in, 99.99% SLA norms and $4.45M average breach cost (IBM 2024) raise switching costs.
| Item | 2024 Metric |
|---|---|
| Diesel | $3.80/gal |
| Electricity | 12.5¢/kWh |
| OEM share | 60–70% |
| Driver shortfall | ~400,000 |
| Data breach cost | $4.45M |
What is included in the product
 Detailed Word Document
Concise Five Forces review for Stef that uncovers competitive intensity, buyer and supplier power, threat of entry and substitutes, plus disruptive risks—delivered with strategic commentary and editable Word formatting for easy incorporation into investor decks, business plans, or internal strategy work.

 Customizable Excel Spreadsheet
Stef Porter’s Five Forces Analysis condenses complex competitive dynamics into a single, editable one-sheet with instant spider charts for rapid strategic decisions; customize pressure levels, swap in your own data, and drop directly into pitch decks or dashboards—no macros or finance expertise required.
Customers Bargaining Power

Concentrated food retailers and FMCG
Large European grocers procure via multi-year tenders—Carrefour reported €81.2bn revenue (2023) and Tesco £57.9bn (2023)—giving them strong leverage over 3PLs; providers routinely benchmark bids across competitors to compress margins. Volume commitments commonly unlock rate reductions in the 5–15% range, while losing a major retail account can slash network density and routed volumes by around 10–20%.
Switching costs and integration
Cold-chain processes, specialized IT interfaces and SOPs create moderate switching costs—market estimates in 2024 place the global cold-chain logistics market above $250B, reinforcing integration complexity.
Buyers often dual-source lanes (2024 surveys show roughly 45% practice dual-sourcing) to preserve leverage and limit disruption risk.
Performance SLAs with penalties (commonly 2–5% per missed KPI in contracts) sharpen buyer leverage, while high service-quality differentiation reduces pure price-based switching.

Price sensitivity vs service criticality
Perishables demand OTIF ~98–99% and strict cold-chain control, so buyers avoid low-cost, high-risk providers despite retail pressure. Retail gross margins ~1–3% in 2024 keep cost scrutiny intense. Offering traceability, cold-chain guarantees and VAS (warehousing, forecasting) lets suppliers defend pricing. Documented quality metrics reduce purely transactional bargaining.

Contract structures and duration
- Retendering frequency increases buyer leverage
- 2024 indexation practices lower disputes but not full cost exposure
- Gainshare + KPIs = incentive alignment
- Capacity guarantees and innovation roadmaps win longer terms
Demand seasonality and forecasting
Seasonal peaks (holidays, harvests) let buyers test carriers' capacity and extract surge pricing; 2024 peak-season demand spikes reached up to 30% in many logistics verticals, amplifying customer leverage. Inaccurate forecasts (typical errors ~15%) shift cost burdens to carriers and raise dispute rates. Collaborative planning and data-sharing reduce adversarial dynamics, while priority allocations and SLAs reward reliable partners.
- Seasonal surge: up to 30% (2024)
- Forecast error: ~15%
- Collaborative planning lowers disputes
- Priority allocations favor dependable shippers
Grocers force 5–15% cuts; cold-chain > $250B
Large grocers (Carrefour €81.2bn 2023; Tesco £57.9bn 2023) exert strong leverage, driving 5–15% volume discounts and multi-year tenders. Buyers dual-source (~45% 2024), use SLAs with 2–5% penalties and test capacity during 2024 peak spikes up to 30%; forecast errors ~15% raise disputes. Cold-chain market >$250B (2024) raises integration switching costs, so quality/traceability defend margins.
| Metric | Value |
|---|---|
| Carrefour revenue | €81.2bn (2023) |
| Tesco revenue | £57.9bn (2023) |
| Dual-sourcing | ~45% (2024) |
| Volume discounts | 5–15% |
| Peak spike | Up to 30% (2024) |
| Forecast error | ~15% |
| Cold-chain market | >$250B (2024) |
Full Version Awaits
Stef Porter's Five Forces Analysis
This preview shows Stef Porter's Five Forces Analysis exactly as delivered—no placeholders or samples. The document displayed is the final, professionally formatted file you'll receive immediately after purchase. It’s ready for download and use with complete, actionable insights. What you see is what you get.

Original: $10.00
-65%$10.00
$3.50Product Information
Product Information
Shipping & Returns
Shipping & Returns
Description
Elevate Your Analysis with the Complete Porter's Five Forces Analysis
Stef's Porter's Five Forces snapshot highlights supplier leverage, buyer power, competitive rivalry, entry barriers, and substitute threats shaping its market position. This concise view surfaces key vulnerabilities and strategic levers for growth. Unlock the full Porter's Five Forces Analysis for force-by-force ratings, visuals, and actionable recommendations to inform investment or strategy.
Suppliers Bargaining Power
Fuel and energy dependence
Diesel (US average ~$3.80/gal in 2024) and industrial electricity (~12.5¢/kWh in 2024) are critical inputs for refrigerated fleets and cold stores, giving fuel and utility suppliers leverage through price volatility.
Hedging can reduce but not eliminate exposure; energy transitions to biofuels and EV charging introduce capital and switching costs that lock operators in.
Pass-through clauses ease pressure, but timing gaps between cost spikes and contract adjustments compress margins.
Specialized cold-chain equipment
Refrigerated truck bodies, trailers and HVAC units are supplied mainly by a few OEMs—Thermo King and Carrier Transicold together hold roughly 60–70% of the market—giving suppliers strong replacement and maintenance leverage. Lead times and parts shortages in 2024 averaged 12–20 weeks, constraining capacity and fleet uptime. Long asset lives (8–12 years) lock fleets into vendors, though preventive maintenance contracts can cut unplanned downtime by ~20–30% and partially rebalance terms.
Skilled labor and drivers
Qualified drivers and warehouse operatives with cold-chain experience are scarce in Europe, with the IRU estimating a shortfall of around 400,000 drivers, boosting supplier bargaining power.
Wage inflation (UK HGV pay rose ~10% in 2022–23) and EU hours-of-service limits (max 9h/day, 56h/week) raise operating costs and reduce flexibility.
Strong unions and divergent local labor laws add rigidity, though company training pipelines and retention programs are increasingly reducing dependence on external hires.
Real estate and cold-storage landlords
IT, telematics, and sensors
IT, telematics, and sensor vendors wield supplier power via proprietary TMS/WMS and telemetry ecosystems that raise integration and validation costs, creating measurable lock-in; cybersecurity and uptime demands amplify criticality, with industry SLAs commonly at 99.99% availability and the 2024 IBM Cost of a Data Breach report showing an average breach cost of $4.45M.
Energy, OEM scarcity and driver gap boost supplier power; telematics lock-in raises switching costs
Energy (diesel ~$3.80/gal; electricity ~12.5¢/kWh in 2024) and HVAC OEMs (Thermo King + Carrier Transicold ~60–70% share; 12–20 week lead times) give suppliers pricing and availability leverage.
Labor shortages (IRU ~400,000 driver gap) and wage inflation lift bargaining power; long asset lives (8–12y) and 10+yr leases increase lock-in.
IT/telematics lock-in, 99.99% SLA norms and $4.45M average breach cost (IBM 2024) raise switching costs.
| Item | 2024 Metric |
|---|---|
| Diesel | $3.80/gal |
| Electricity | 12.5¢/kWh |
| OEM share | 60–70% |
| Driver shortfall | ~400,000 |
| Data breach cost | $4.45M |
What is included in the product
Detailed Word Document
Concise Five Forces review for Stef that uncovers competitive intensity, buyer and supplier power, threat of entry and substitutes, plus disruptive risks—delivered with strategic commentary and editable Word formatting for easy incorporation into investor decks, business plans, or internal strategy work.
Customizable Excel Spreadsheet
Stef Porter’s Five Forces Analysis condenses complex competitive dynamics into a single, editable one-sheet with instant spider charts for rapid strategic decisions; customize pressure levels, swap in your own data, and drop directly into pitch decks or dashboards—no macros or finance expertise required.
Customers Bargaining Power
Concentrated food retailers and FMCG
Large European grocers procure via multi-year tenders—Carrefour reported €81.2bn revenue (2023) and Tesco £57.9bn (2023)—giving them strong leverage over 3PLs; providers routinely benchmark bids across competitors to compress margins. Volume commitments commonly unlock rate reductions in the 5–15% range, while losing a major retail account can slash network density and routed volumes by around 10–20%.
Switching costs and integration
Cold-chain processes, specialized IT interfaces and SOPs create moderate switching costs—market estimates in 2024 place the global cold-chain logistics market above $250B, reinforcing integration complexity.
Buyers often dual-source lanes (2024 surveys show roughly 45% practice dual-sourcing) to preserve leverage and limit disruption risk.
Performance SLAs with penalties (commonly 2–5% per missed KPI in contracts) sharpen buyer leverage, while high service-quality differentiation reduces pure price-based switching.
Price sensitivity vs service criticality
Perishables demand OTIF ~98–99% and strict cold-chain control, so buyers avoid low-cost, high-risk providers despite retail pressure. Retail gross margins ~1–3% in 2024 keep cost scrutiny intense. Offering traceability, cold-chain guarantees and VAS (warehousing, forecasting) lets suppliers defend pricing. Documented quality metrics reduce purely transactional bargaining.
Contract structures and duration
- Retendering frequency increases buyer leverage
- 2024 indexation practices lower disputes but not full cost exposure
- Gainshare + KPIs = incentive alignment
- Capacity guarantees and innovation roadmaps win longer terms
Demand seasonality and forecasting
Seasonal peaks (holidays, harvests) let buyers test carriers' capacity and extract surge pricing; 2024 peak-season demand spikes reached up to 30% in many logistics verticals, amplifying customer leverage. Inaccurate forecasts (typical errors ~15%) shift cost burdens to carriers and raise dispute rates. Collaborative planning and data-sharing reduce adversarial dynamics, while priority allocations and SLAs reward reliable partners.
- Seasonal surge: up to 30% (2024)
- Forecast error: ~15%
- Collaborative planning lowers disputes
- Priority allocations favor dependable shippers
Grocers force 5–15% cuts; cold-chain > $250B
Large grocers (Carrefour €81.2bn 2023; Tesco £57.9bn 2023) exert strong leverage, driving 5–15% volume discounts and multi-year tenders. Buyers dual-source (~45% 2024), use SLAs with 2–5% penalties and test capacity during 2024 peak spikes up to 30%; forecast errors ~15% raise disputes. Cold-chain market >$250B (2024) raises integration switching costs, so quality/traceability defend margins.
| Metric | Value |
|---|---|
| Carrefour revenue | €81.2bn (2023) |
| Tesco revenue | £57.9bn (2023) |
| Dual-sourcing | ~45% (2024) |
| Volume discounts | 5–15% |
| Peak spike | Up to 30% (2024) |
| Forecast error | ~15% |
| Cold-chain market | >$250B (2024) |
Full Version Awaits
Stef Porter's Five Forces Analysis
This preview shows Stef Porter's Five Forces Analysis exactly as delivered—no placeholders or samples. The document displayed is the final, professionally formatted file you'll receive immediately after purchase. It’s ready for download and use with complete, actionable insights. What you see is what you get.