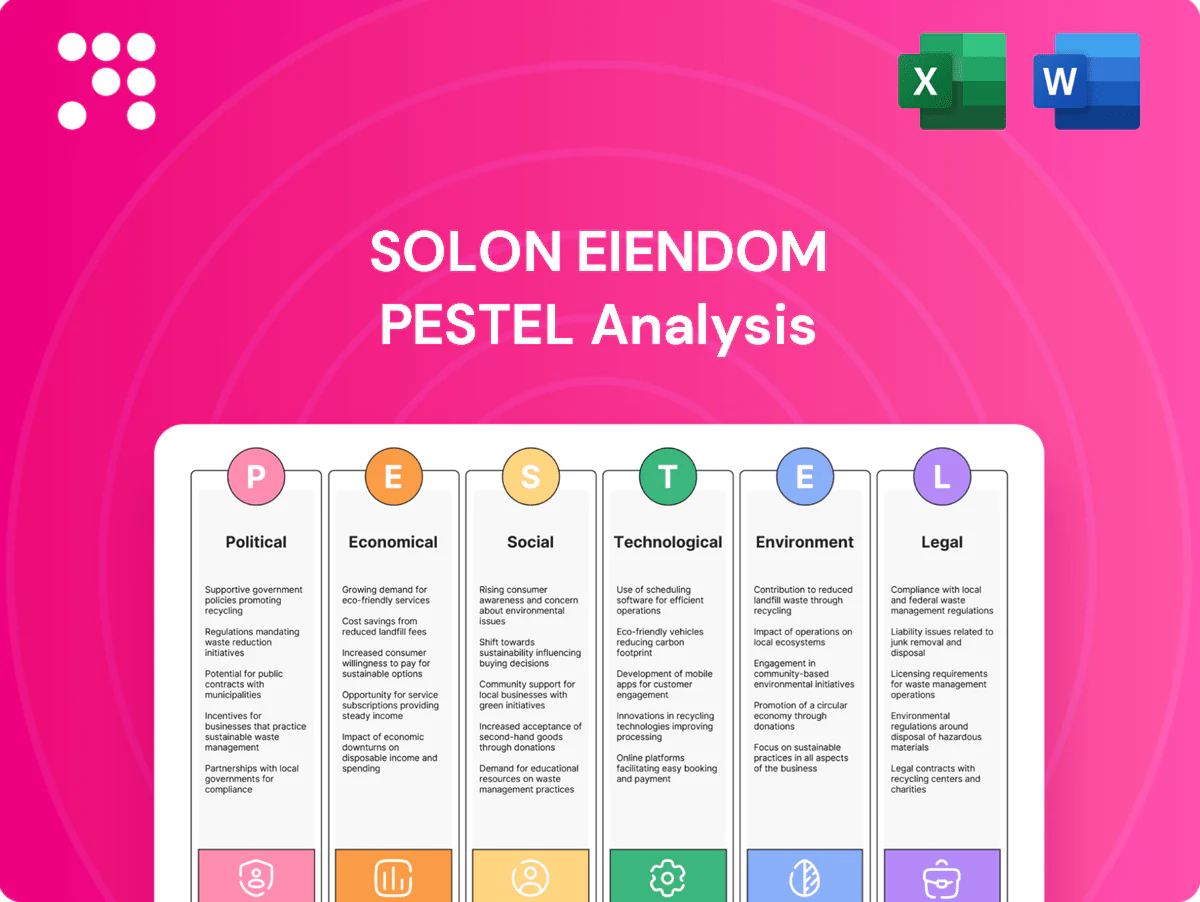
Solon Eiendom PESTLE Analysis

Plan Smarter. Present Sharper. Compete Stronger.
Discover how political shifts, economic cycles, social trends, and environmental regulations are reshaping Solon Eiendom’s outlook in our focused PESTLE snapshot. This concise analysis highlights key external risks and opportunities to inform smarter decisions. Purchase the full PESTLE for the complete, actionable intelligence you need to act confidently.
Political factors

Municipal planning priorities
Oslo-area municipalities control zoning, density and permitting timelines under the Planning and Building Act, directly shaping Solon Eiendom’s pipeline. Political shifts after municipal elections (last held 2023, next in 2027) can reprioritize green space, social housing quotas or transport-led densification. Close engagement with city councils de-risks approvals and aligns projects with Oslo’s climate-neutrality goal for 2030, while election cycles may pause or reverse policies.
National housing policy direction
Government initiatives to increase supply or cap prices directly affect Solon Eiendom margins and sales velocity; Norway recorded about 34,000 housing starts in 2023 and Norges Bank's policy rate was roughly 4.25% in mid-2024, tightening funding costs. Subsidies for first-time buyers and expanded cooperative models in 2024 shift demand to entry-level units. Policy debates on affordability are raising municipal mixed-income quotas, increasing developer obligations. Predictable frameworks enable land banking and phased releases.

Infrastructure spending and transit
Public investment in rail and bus corridors under Norway's National Transport Plan 2022–2033 raises attractiveness of the infill sites Solon targets, supporting higher demand near planned stations. Transit-oriented development has clear political favor, easing density approvals and accelerating permitting. However, project delays or budget cuts can undermine absorption assumptions. Close coordination with transport agencies is needed to align construction timetables with station openings.

Green incentives and climate targets
Norway’s 2030 target (50–55% GHG reduction) and net‑zero by 2050 drive strong political support for energy‑efficient housing; this raises policy certainty for Solon Eiendom and channels demand to low‑emission projects. Incentives for low‑emission construction can improve project IRRs: energy measures typically add 3–7% capex but cut operating costs and boost resale value. Enova allocated roughly NOK 3.5–4.0bn annually in 2023–24, which can lower upfront green‑tech capex. Tighter targets may raise compliance costs but expand market demand for sustainable homes.
- Policy: 2030 (50–55%) & 2050 net‑zero
- Enova: ~NOK 3.5–4.0bn/year (2023–24)
- Capex impact: +3–7% for energy measures
- Effect: higher compliance cost, stronger demand for green units
Property taxation and fees
- Document fee: 2.5% (Norway)
- Municipal rates vary; unpredictable hikes increase risk
- Predictable fees enable accurate pro forma modeling
- Sudden shifts can delay sales or require price increases
Municipal zoning risks, ~34,000 starts, rates and green policy shape approvals
Municipal control of zoning and 2023 elections (next 2027) drive approvals and density; policy shifts can pause projects. National policy affects margins: ~34,000 housing starts (2023), Norges Bank rate ~4.25% (mid‑2024). Green policy boosts demand—Enova ~NOK 3.5–4.0bn (2023–24); energy measures add ~3–7% capex. Document fee 2.5% and variable municipal levies materially affect pro formas.
| Metric | Value |
|---|---|
| Housing starts (2023) | ~34,000 |
| Norges Bank policy rate (mid‑2024) | ~4.25% |
| Enova budget (2023–24) | NOK 3.5–4.0bn/yr |
| Energy capex impact | +3–7% |
| Document fee | 2.5% |
| Next municipal elections | 2027 |
What is included in the product
 Detailed Word Document
Provides a concise PESTLE evaluation of Solon Eiendom across Political, Economic, Social, Technological, Environmental and Legal dimensions, with data-driven trends and region-specific examples to identify risks and opportunities for executives and investors. Ready-to-insert insights support scenario planning and fundraising strategies.

 Customizable Excel Spreadsheet
A concise, visually segmented PESTLE summary for Solon Eiendom that can be dropped into presentations or planning sessions, using clear language to align teams quickly and support discussions on external risks and market positioning.
Economic factors

Interest rates and mortgage costs
Norges Bank policy rate, 4.25% at end-2024, directly reduces buyer affordability and dampens demand in Solon Eiendom projects. Higher mortgage costs (average new mortgage rates ~4.7% in early‑2025) slow pre-sales and extend sell-out periods. Rate cuts can quickly revive Oslo reservations; hedging and flexible phasing limit rate-driven volatility.
Construction cost inflation
Construction cost inflation—SSB reported the building construction cost index rose about 6.1% in 2023 and roughly 3.5% y/y into 2024—compresses project IRRs and raises contingency needs as material and labor swings grow. Global supply-chain disruptions and NOK moves (average ~10.4 NOK/USD in 2024) push input prices. Early procurement and design standardization reduce volatility. Ability to pass increases depends on local demand elasticity.

Household income and employment
Strong Norwegian employment underpins stable housing demand: SSB reported unemployment around 3.4% in 2024, supporting absorption in residential markets. Wage growth (about 4.7% in 2024) helps sustain price resilience in Greater Oslo, where Eiendomsverdi showed prices roughly 2.8% higher YoY in H1 2025. Economic slowdowns increase cancellation risk and typically force developers to offer incentives; focusing on mid-market segments can cushion cyclicality.

Credit availability and LTV rules
Macroprudential LTV/DTI limits narrow buyer pools for new builds: with common LTV caps around 85% and DTI ceilings near 4.5x income in 2024, fewer marginal buyers qualify, reducing speculative demand. Tighter lending cuts investor purchases and raises equity needs for projects. Bank project finance appetite sets practical start thresholds; partnering with lenders for buyer pre-approvals de-risks launches and shortens sales periods.
- LTV cap: 85% (common 2024 benchmark)
- DTI cap: ~4.5x income (2024)
- Investor demand falls when lending tightens
- Lender partnerships lower launch risk
Land prices and urban scarcity
Limited zoned land in Oslo and other growth nodes sharply raises acquisition costs, making off-market deals and redevelopment expertise critical competitive advantages for Solon Eiendom.
Careful timing of conversions of legacy assets can unlock value, while overpaying for land compresses margins quickly if sales pace softens.
- land scarcity: increases acquisition competition
- off-market/development skill: key edge
- timing legacy conversions: value catalyst
- overpayment risk: margin compression if demand eases
Municipal zoning risks, ~34,000 starts, rates and green policy shape approvals
Norges Bank policy rate 4.25% (end‑2024) and avg new mortgage ~4.7% (early‑2025) curb affordability and slow pre‑sales; construction cost inflation ~6.1% (2023) then ~3.5% y/y into 2024 compresses IRRs. Low unemployment 3.4% and wage growth ~4.7% (2024) support demand; LTV 85% and DTI ~4.5x narrow buyer pools.
| Metric | Value |
|---|---|
| Policy rate | 4.25% |
| Mortgage | ~4.7% |
| Constr. inflation | ~3.5–6.1% |
| Unempl./Wage | 3.4% / 4.7% |
| LTV / DTI | 85% / 4.5x |
Preview Before You Purchase
Solon Eiendom PESTLE Analysis
The Solon Eiendom PESTLE Analysis preview shown here is the exact, fully formatted document you’ll receive after purchase—professionally structured and ready to use. No placeholders or teasers; the content, layout and conclusions visible are identical to the downloadable file.

Original: $10.00
-65%$10.00
$3.50Product Information
Product Information
Shipping & Returns
Shipping & Returns
Description
Plan Smarter. Present Sharper. Compete Stronger.
Discover how political shifts, economic cycles, social trends, and environmental regulations are reshaping Solon Eiendom’s outlook in our focused PESTLE snapshot. This concise analysis highlights key external risks and opportunities to inform smarter decisions. Purchase the full PESTLE for the complete, actionable intelligence you need to act confidently.
Political factors
Municipal planning priorities
Oslo-area municipalities control zoning, density and permitting timelines under the Planning and Building Act, directly shaping Solon Eiendom’s pipeline. Political shifts after municipal elections (last held 2023, next in 2027) can reprioritize green space, social housing quotas or transport-led densification. Close engagement with city councils de-risks approvals and aligns projects with Oslo’s climate-neutrality goal for 2030, while election cycles may pause or reverse policies.
National housing policy direction
Government initiatives to increase supply or cap prices directly affect Solon Eiendom margins and sales velocity; Norway recorded about 34,000 housing starts in 2023 and Norges Bank's policy rate was roughly 4.25% in mid-2024, tightening funding costs. Subsidies for first-time buyers and expanded cooperative models in 2024 shift demand to entry-level units. Policy debates on affordability are raising municipal mixed-income quotas, increasing developer obligations. Predictable frameworks enable land banking and phased releases.
Infrastructure spending and transit
Public investment in rail and bus corridors under Norway's National Transport Plan 2022–2033 raises attractiveness of the infill sites Solon targets, supporting higher demand near planned stations. Transit-oriented development has clear political favor, easing density approvals and accelerating permitting. However, project delays or budget cuts can undermine absorption assumptions. Close coordination with transport agencies is needed to align construction timetables with station openings.
Green incentives and climate targets
Norway’s 2030 target (50–55% GHG reduction) and net‑zero by 2050 drive strong political support for energy‑efficient housing; this raises policy certainty for Solon Eiendom and channels demand to low‑emission projects. Incentives for low‑emission construction can improve project IRRs: energy measures typically add 3–7% capex but cut operating costs and boost resale value. Enova allocated roughly NOK 3.5–4.0bn annually in 2023–24, which can lower upfront green‑tech capex. Tighter targets may raise compliance costs but expand market demand for sustainable homes.
- Policy: 2030 (50–55%) & 2050 net‑zero
- Enova: ~NOK 3.5–4.0bn/year (2023–24)
- Capex impact: +3–7% for energy measures
- Effect: higher compliance cost, stronger demand for green units
Property taxation and fees
- Document fee: 2.5% (Norway)
- Municipal rates vary; unpredictable hikes increase risk
- Predictable fees enable accurate pro forma modeling
- Sudden shifts can delay sales or require price increases
Municipal zoning risks, ~34,000 starts, rates and green policy shape approvals
Municipal control of zoning and 2023 elections (next 2027) drive approvals and density; policy shifts can pause projects. National policy affects margins: ~34,000 housing starts (2023), Norges Bank rate ~4.25% (mid‑2024). Green policy boosts demand—Enova ~NOK 3.5–4.0bn (2023–24); energy measures add ~3–7% capex. Document fee 2.5% and variable municipal levies materially affect pro formas.
| Metric | Value |
|---|---|
| Housing starts (2023) | ~34,000 |
| Norges Bank policy rate (mid‑2024) | ~4.25% |
| Enova budget (2023–24) | NOK 3.5–4.0bn/yr |
| Energy capex impact | +3–7% |
| Document fee | 2.5% |
| Next municipal elections | 2027 |
What is included in the product
Detailed Word Document
Provides a concise PESTLE evaluation of Solon Eiendom across Political, Economic, Social, Technological, Environmental and Legal dimensions, with data-driven trends and region-specific examples to identify risks and opportunities for executives and investors. Ready-to-insert insights support scenario planning and fundraising strategies.
Customizable Excel Spreadsheet
A concise, visually segmented PESTLE summary for Solon Eiendom that can be dropped into presentations or planning sessions, using clear language to align teams quickly and support discussions on external risks and market positioning.
Economic factors
Interest rates and mortgage costs
Norges Bank policy rate, 4.25% at end-2024, directly reduces buyer affordability and dampens demand in Solon Eiendom projects. Higher mortgage costs (average new mortgage rates ~4.7% in early‑2025) slow pre-sales and extend sell-out periods. Rate cuts can quickly revive Oslo reservations; hedging and flexible phasing limit rate-driven volatility.
Construction cost inflation
Construction cost inflation—SSB reported the building construction cost index rose about 6.1% in 2023 and roughly 3.5% y/y into 2024—compresses project IRRs and raises contingency needs as material and labor swings grow. Global supply-chain disruptions and NOK moves (average ~10.4 NOK/USD in 2024) push input prices. Early procurement and design standardization reduce volatility. Ability to pass increases depends on local demand elasticity.
Household income and employment
Strong Norwegian employment underpins stable housing demand: SSB reported unemployment around 3.4% in 2024, supporting absorption in residential markets. Wage growth (about 4.7% in 2024) helps sustain price resilience in Greater Oslo, where Eiendomsverdi showed prices roughly 2.8% higher YoY in H1 2025. Economic slowdowns increase cancellation risk and typically force developers to offer incentives; focusing on mid-market segments can cushion cyclicality.
Credit availability and LTV rules
Macroprudential LTV/DTI limits narrow buyer pools for new builds: with common LTV caps around 85% and DTI ceilings near 4.5x income in 2024, fewer marginal buyers qualify, reducing speculative demand. Tighter lending cuts investor purchases and raises equity needs for projects. Bank project finance appetite sets practical start thresholds; partnering with lenders for buyer pre-approvals de-risks launches and shortens sales periods.
- LTV cap: 85% (common 2024 benchmark)
- DTI cap: ~4.5x income (2024)
- Investor demand falls when lending tightens
- Lender partnerships lower launch risk
Land prices and urban scarcity
Limited zoned land in Oslo and other growth nodes sharply raises acquisition costs, making off-market deals and redevelopment expertise critical competitive advantages for Solon Eiendom.
Careful timing of conversions of legacy assets can unlock value, while overpaying for land compresses margins quickly if sales pace softens.
- land scarcity: increases acquisition competition
- off-market/development skill: key edge
- timing legacy conversions: value catalyst
- overpayment risk: margin compression if demand eases
Municipal zoning risks, ~34,000 starts, rates and green policy shape approvals
Norges Bank policy rate 4.25% (end‑2024) and avg new mortgage ~4.7% (early‑2025) curb affordability and slow pre‑sales; construction cost inflation ~6.1% (2023) then ~3.5% y/y into 2024 compresses IRRs. Low unemployment 3.4% and wage growth ~4.7% (2024) support demand; LTV 85% and DTI ~4.5x narrow buyer pools.
| Metric | Value |
|---|---|
| Policy rate | 4.25% |
| Mortgage | ~4.7% |
| Constr. inflation | ~3.5–6.1% |
| Unempl./Wage | 3.4% / 4.7% |
| LTV / DTI | 85% / 4.5x |
Preview Before You Purchase
Solon Eiendom PESTLE Analysis
The Solon Eiendom PESTLE Analysis preview shown here is the exact, fully formatted document you’ll receive after purchase—professionally structured and ready to use. No placeholders or teasers; the content, layout and conclusions visible are identical to the downloadable file.











