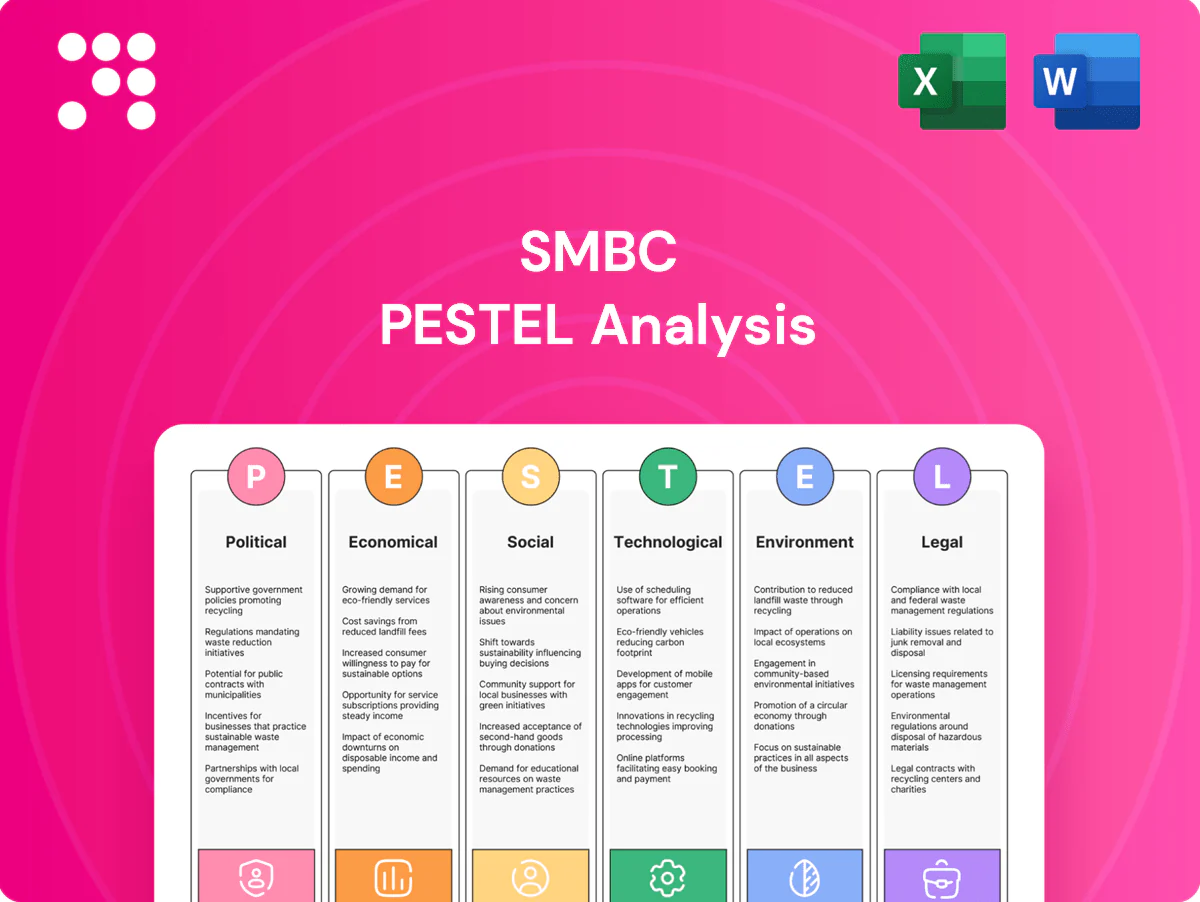
SMBC PESTLE Analysis

Make Smarter Strategic Decisions with a Complete PESTEL View
Gain a strategic edge with our PESTLE analysis of SMBC. We map political, economic, social, technological, legal, and environmental forces shaping its outlook, highlighting risks and growth levers. Ideal for investors and strategists—buy the full, editable report to access deep, actionable insights immediately.
Political factors

Geopolitical tensions
US‑China rivalry and regional frictions, plus war‑related sanctions, have repeatedly disrupted cross‑border flows and counterparties—EM sovereign spreads widened ~300 bps in major 2022–23 episodes—forcing SMFG to rapidly tighten risk appetites, adjust hedges and cut country limits. Political spillovers can widen spreads and constrain syndications; proactive scenario planning and diversified booking centers reduce shock exposure.
Japan policy shifts
Changes in Japan’s fiscal stance and industrial policy directly affect SMBC lending demand as Japan’s general government gross debt remains around 260% of GDP (IMF 2024), pressuring fiscal consolidation and government-related business. BOJ leadership under Governor Kazuo Ueda since April 2023 has signaled policy normalization, influencing market liquidity and bank funding conditions. Public investment programs—backed by multi-trillion-yen budgets—feed project finance pipelines for infrastructure and energy. Policy reversals, however, heighten planning and duration risks for longer-term loans and securitisations.

Sanctions and export controls
Evolving US/EU/Japan measures — more than 10 major sanction rounds since 2022 — are narrowing permissible clients and sectors, forcing SMFG to tighten screening and accelerate client outreach on restrictions. Breaches risk multi‑million dollar fines and severe reputational damage. Active portfolio rebalancing may compress yields short‑term but safeguards SMFGs license to operate.

ASEAN political stability
ASEAN political stability shapes SMFG’s Asian growth thesis as variations in governance and elections in 2024–25 (notably Indonesia and the Philippines) affect policy continuity and deal pipelines; ADB estimates ASEAN needs about 210 billion USD annually for infrastructure, which can catalyze lending volumes. Sudden regulatory pivots risk collateral values and recovery; strong local partnerships materially hedge execution risk and speed compliance.
- Governance variation: national elections 2024 impacted policy certainty
- Infrastructure demand: ~210 billion USD/year (ADB)
- Regulatory risk: sudden pivots affect collateral/recovery
- Mitigation: local partners reduce execution and compliance risk
Trade and investment policy
Rising FDI screening and tariffs, plus friend-shoring driven by policies like the US CHIPS Act (about 280 billion USD in incentives) and the EU’s foreign subsidy rules, are redirecting capital and shifting supply chains; UNCTAD reports global FDI fell to roughly 1.1 trillion USD in 2023, pushing clients to restructure footprints and change credit demand by sector and region. SMFG can underwrite relocations, capex and working-capital transitions, but policy unpredictability requires flexible financings and covenant structuring.
- FDI screening: tighter since 2021, raises deal complexity
- CHIPS Act: ~280bn USD incentives, spurs tech reshoring
- Global FDI: ~1.1tn USD in 2023 (UNCTAD)
- SMFG role: finance relocations, working capital, flexible structuring
Geopolitics, over 10 sanctions and Japan ~260% GDP debt reshape funding
Geopolitical tensions (US‑China, regional wars) and >10 sanction rounds since 2022 have widened sovereign spreads and tightened cross‑border activity; SMFG uses scenario planning and diversified booking to limit shocks. Japan’s debt ~260% of GDP (IMF 2024) and BOJ normalization reshape funding and loan demand. ASEAN infrastructure need ~210bn USD/yr (ADB) and CHIPS incentives ~280bn USD drive client capex and reshoring; global FDI ~1.1tn USD (UNCTAD 2023).
| Tag | Metric | Value | Impact |
|---|---|---|---|
| Fiscal | Japan debt | ~260% GDP | Funding pressure |
| Infra | ASEAN need | 210bn USD/yr | Loan pipeline |
| Policy | Sanctions | >10 rounds since 2022 | Screening cost |
| FDI | Global | ~1.1tn USD (2023) | Deal flow shift |
What is included in the product
 Detailed Word Document
Explores how macro-environmental factors uniquely affect SMBC across Political, Economic, Social, Technological, Environmental and Legal dimensions, with each section backed by current data and regional regulatory context; designed to help executives, consultants and investors identify threats, opportunities and forward-looking scenarios for strategy and risk management.

 Customizable Excel Spreadsheet
A concise, visually segmented SMBC PESTLE summary that relieves prep pain by distilling external risks and opportunities into clear, presentation-ready bullet points. Easily dropped into PowerPoints or shared across teams for quick alignment during planning and client discussions.
Economic factors

Rate and yield-curve dynamics
BOJ normalization and global rate cycles drove NIMs and marked AFS/HTM positions as policy rates moved: Fed funds peaked at 5.25–5.50% and 10Y UST around 4.0% in 2024 while 10Y JGB rose toward ~0.9%, lifting yields and securities marks.
Steeper curves have supported deposit franchises and NIM expansion; curve flattening, conversely, compresses loan-deposit spreads and fee income.
Rising hedging costs for USD funding—reflected in wider cross-currency basis in 2024—added funding expense.
Disciplined asset-liability management is critical to stabilize earnings volatility amid these rate dynamics.
FX and yen volatility
Yen volatility—USD/JPY swinging from about 115 in 2021 to roughly 155 in 2022–24 (≈35% move)—pressures translation and capital ratios and raises client hedging demand. Dollar funding premiums can widen sharply in stress, forcing higher cross-currency funding costs. SMFG can monetize flow via FX solutions while managing foreign-currency LCR, but mismatches require conservative liquidity buffers.

Credit cycle and NPLs
Global slowdowns push banks to raise stage 2/3 provisions—IMF projected global growth at about 3.1% in 2024, increasing credit stress in cyclical sectors. Asia’s SME-heavy lending is vulnerable to cash-flow shocks; SMEs account for roughly 60% of employment in many Asian economies (World Bank). Early-warning models and covenant discipline at SMBC help cap migration to default. Skilled workout teams preserve recovery values and limit loss severity.

Capital markets activity
SMBC fee income is cyclical: IPO and DCM activity (global IPO proceeds ~USD 180bn in 2024; global bond issuance ~USD 4.5trn in 2024) and M&A cycles (global M&A ~USD 2.3trn in 2024) drive variability, while market volatility shifts revenue toward FX/IR risk‑management products; balance-sheet lending fills gaps during muted underwriting windows and geographic diversification smooths regional troughs.
- IPO/DCM/M&A: cyclical fee swings
- Volatility: revenue to risk products
- Balance‑sheet lending: underwriting bridge
- Diversified geographies: revenue smoothing
Regional growth differentials
US resilience (2024 GDP ~2.5%) vs China moderation (2024 GDP ~5.2%) and ASEAN expansion (2024–25 avg ~4.8%) create mixed opportunities; sector rotation favors energy transition, digital and infrastructure. Allocating to higher-growth Asia can boost ROE if risks managed; macro dispersion enhances cross-sell potential across corporate and retail clients.
- US: ~2.5% GDP
- China: ~5.2% GDP
- ASEAN: ~4.8% forecast
- Focus: energy, digital, infra
Geopolitics, over 10 sanctions and Japan ~260% GDP debt reshape funding
BOJ normalization and global rate cycles lifted yields and securities marks while steeper curves supported NIMs; hedging and USD funding costs widened in 2024. Yen volatility (≈155 peak) strains capital and client hedging demand; global growth dispersion (IMF 2024 ~3.1%) shifts credit risk regionally. Fee cycles (IPOs/DCM/M&A) and balance-sheet lending drive revenue variability; disciplined ALM and provisions contain earnings volatility.
| Metric | 2024 |
|---|---|
| Fed funds | 5.25–5.50% |
| 10Y UST | ~4.0% |
| 10Y JGB | ~0.9% |
| USD/JPY peak | ~155 |
| Global GDP (IMF) | ~3.1% |
| US GDP | ~2.5% |
| China GDP | ~5.2% |
| IPOs | ~USD180bn |
| Bond issuance | ~USD4.5trn |
| M&A | ~USD2.3trn |
Preview the Actual Deliverable
SMBC PESTLE Analysis
The preview shown here is the exact SMBC PESTLE Analysis document you’ll receive after purchase — fully formatted, professionally structured, and ready to use. No placeholders or teasers: the content and layout visible are the final file. After checkout you’ll be able to download this identical document instantly.

Original: $10.00
-65%$10.00
$3.50Product Information
Product Information
Shipping & Returns
Shipping & Returns
Description
Make Smarter Strategic Decisions with a Complete PESTEL View
Gain a strategic edge with our PESTLE analysis of SMBC. We map political, economic, social, technological, legal, and environmental forces shaping its outlook, highlighting risks and growth levers. Ideal for investors and strategists—buy the full, editable report to access deep, actionable insights immediately.
Political factors
Geopolitical tensions
US‑China rivalry and regional frictions, plus war‑related sanctions, have repeatedly disrupted cross‑border flows and counterparties—EM sovereign spreads widened ~300 bps in major 2022–23 episodes—forcing SMFG to rapidly tighten risk appetites, adjust hedges and cut country limits. Political spillovers can widen spreads and constrain syndications; proactive scenario planning and diversified booking centers reduce shock exposure.
Japan policy shifts
Changes in Japan’s fiscal stance and industrial policy directly affect SMBC lending demand as Japan’s general government gross debt remains around 260% of GDP (IMF 2024), pressuring fiscal consolidation and government-related business. BOJ leadership under Governor Kazuo Ueda since April 2023 has signaled policy normalization, influencing market liquidity and bank funding conditions. Public investment programs—backed by multi-trillion-yen budgets—feed project finance pipelines for infrastructure and energy. Policy reversals, however, heighten planning and duration risks for longer-term loans and securitisations.
Sanctions and export controls
Evolving US/EU/Japan measures — more than 10 major sanction rounds since 2022 — are narrowing permissible clients and sectors, forcing SMFG to tighten screening and accelerate client outreach on restrictions. Breaches risk multi‑million dollar fines and severe reputational damage. Active portfolio rebalancing may compress yields short‑term but safeguards SMFGs license to operate.
ASEAN political stability
ASEAN political stability shapes SMFG’s Asian growth thesis as variations in governance and elections in 2024–25 (notably Indonesia and the Philippines) affect policy continuity and deal pipelines; ADB estimates ASEAN needs about 210 billion USD annually for infrastructure, which can catalyze lending volumes. Sudden regulatory pivots risk collateral values and recovery; strong local partnerships materially hedge execution risk and speed compliance.
- Governance variation: national elections 2024 impacted policy certainty
- Infrastructure demand: ~210 billion USD/year (ADB)
- Regulatory risk: sudden pivots affect collateral/recovery
- Mitigation: local partners reduce execution and compliance risk
Trade and investment policy
Rising FDI screening and tariffs, plus friend-shoring driven by policies like the US CHIPS Act (about 280 billion USD in incentives) and the EU’s foreign subsidy rules, are redirecting capital and shifting supply chains; UNCTAD reports global FDI fell to roughly 1.1 trillion USD in 2023, pushing clients to restructure footprints and change credit demand by sector and region. SMFG can underwrite relocations, capex and working-capital transitions, but policy unpredictability requires flexible financings and covenant structuring.
- FDI screening: tighter since 2021, raises deal complexity
- CHIPS Act: ~280bn USD incentives, spurs tech reshoring
- Global FDI: ~1.1tn USD in 2023 (UNCTAD)
- SMFG role: finance relocations, working capital, flexible structuring
Geopolitics, over 10 sanctions and Japan ~260% GDP debt reshape funding
Geopolitical tensions (US‑China, regional wars) and >10 sanction rounds since 2022 have widened sovereign spreads and tightened cross‑border activity; SMFG uses scenario planning and diversified booking to limit shocks. Japan’s debt ~260% of GDP (IMF 2024) and BOJ normalization reshape funding and loan demand. ASEAN infrastructure need ~210bn USD/yr (ADB) and CHIPS incentives ~280bn USD drive client capex and reshoring; global FDI ~1.1tn USD (UNCTAD 2023).
| Tag | Metric | Value | Impact |
|---|---|---|---|
| Fiscal | Japan debt | ~260% GDP | Funding pressure |
| Infra | ASEAN need | 210bn USD/yr | Loan pipeline |
| Policy | Sanctions | >10 rounds since 2022 | Screening cost |
| FDI | Global | ~1.1tn USD (2023) | Deal flow shift |
What is included in the product
Detailed Word Document
Explores how macro-environmental factors uniquely affect SMBC across Political, Economic, Social, Technological, Environmental and Legal dimensions, with each section backed by current data and regional regulatory context; designed to help executives, consultants and investors identify threats, opportunities and forward-looking scenarios for strategy and risk management.
Customizable Excel Spreadsheet
A concise, visually segmented SMBC PESTLE summary that relieves prep pain by distilling external risks and opportunities into clear, presentation-ready bullet points. Easily dropped into PowerPoints or shared across teams for quick alignment during planning and client discussions.
Economic factors
Rate and yield-curve dynamics
BOJ normalization and global rate cycles drove NIMs and marked AFS/HTM positions as policy rates moved: Fed funds peaked at 5.25–5.50% and 10Y UST around 4.0% in 2024 while 10Y JGB rose toward ~0.9%, lifting yields and securities marks.
Steeper curves have supported deposit franchises and NIM expansion; curve flattening, conversely, compresses loan-deposit spreads and fee income.
Rising hedging costs for USD funding—reflected in wider cross-currency basis in 2024—added funding expense.
Disciplined asset-liability management is critical to stabilize earnings volatility amid these rate dynamics.
FX and yen volatility
Yen volatility—USD/JPY swinging from about 115 in 2021 to roughly 155 in 2022–24 (≈35% move)—pressures translation and capital ratios and raises client hedging demand. Dollar funding premiums can widen sharply in stress, forcing higher cross-currency funding costs. SMFG can monetize flow via FX solutions while managing foreign-currency LCR, but mismatches require conservative liquidity buffers.
Credit cycle and NPLs
Global slowdowns push banks to raise stage 2/3 provisions—IMF projected global growth at about 3.1% in 2024, increasing credit stress in cyclical sectors. Asia’s SME-heavy lending is vulnerable to cash-flow shocks; SMEs account for roughly 60% of employment in many Asian economies (World Bank). Early-warning models and covenant discipline at SMBC help cap migration to default. Skilled workout teams preserve recovery values and limit loss severity.
Capital markets activity
SMBC fee income is cyclical: IPO and DCM activity (global IPO proceeds ~USD 180bn in 2024; global bond issuance ~USD 4.5trn in 2024) and M&A cycles (global M&A ~USD 2.3trn in 2024) drive variability, while market volatility shifts revenue toward FX/IR risk‑management products; balance-sheet lending fills gaps during muted underwriting windows and geographic diversification smooths regional troughs.
- IPO/DCM/M&A: cyclical fee swings
- Volatility: revenue to risk products
- Balance‑sheet lending: underwriting bridge
- Diversified geographies: revenue smoothing
Regional growth differentials
US resilience (2024 GDP ~2.5%) vs China moderation (2024 GDP ~5.2%) and ASEAN expansion (2024–25 avg ~4.8%) create mixed opportunities; sector rotation favors energy transition, digital and infrastructure. Allocating to higher-growth Asia can boost ROE if risks managed; macro dispersion enhances cross-sell potential across corporate and retail clients.
- US: ~2.5% GDP
- China: ~5.2% GDP
- ASEAN: ~4.8% forecast
- Focus: energy, digital, infra
Geopolitics, over 10 sanctions and Japan ~260% GDP debt reshape funding
BOJ normalization and global rate cycles lifted yields and securities marks while steeper curves supported NIMs; hedging and USD funding costs widened in 2024. Yen volatility (≈155 peak) strains capital and client hedging demand; global growth dispersion (IMF 2024 ~3.1%) shifts credit risk regionally. Fee cycles (IPOs/DCM/M&A) and balance-sheet lending drive revenue variability; disciplined ALM and provisions contain earnings volatility.
| Metric | 2024 |
|---|---|
| Fed funds | 5.25–5.50% |
| 10Y UST | ~4.0% |
| 10Y JGB | ~0.9% |
| USD/JPY peak | ~155 |
| Global GDP (IMF) | ~3.1% |
| US GDP | ~2.5% |
| China GDP | ~5.2% |
| IPOs | ~USD180bn |
| Bond issuance | ~USD4.5trn |
| M&A | ~USD2.3trn |
Preview the Actual Deliverable
SMBC PESTLE Analysis
The preview shown here is the exact SMBC PESTLE Analysis document you’ll receive after purchase — fully formatted, professionally structured, and ready to use. No placeholders or teasers: the content and layout visible are the final file. After checkout you’ll be able to download this identical document instantly.











