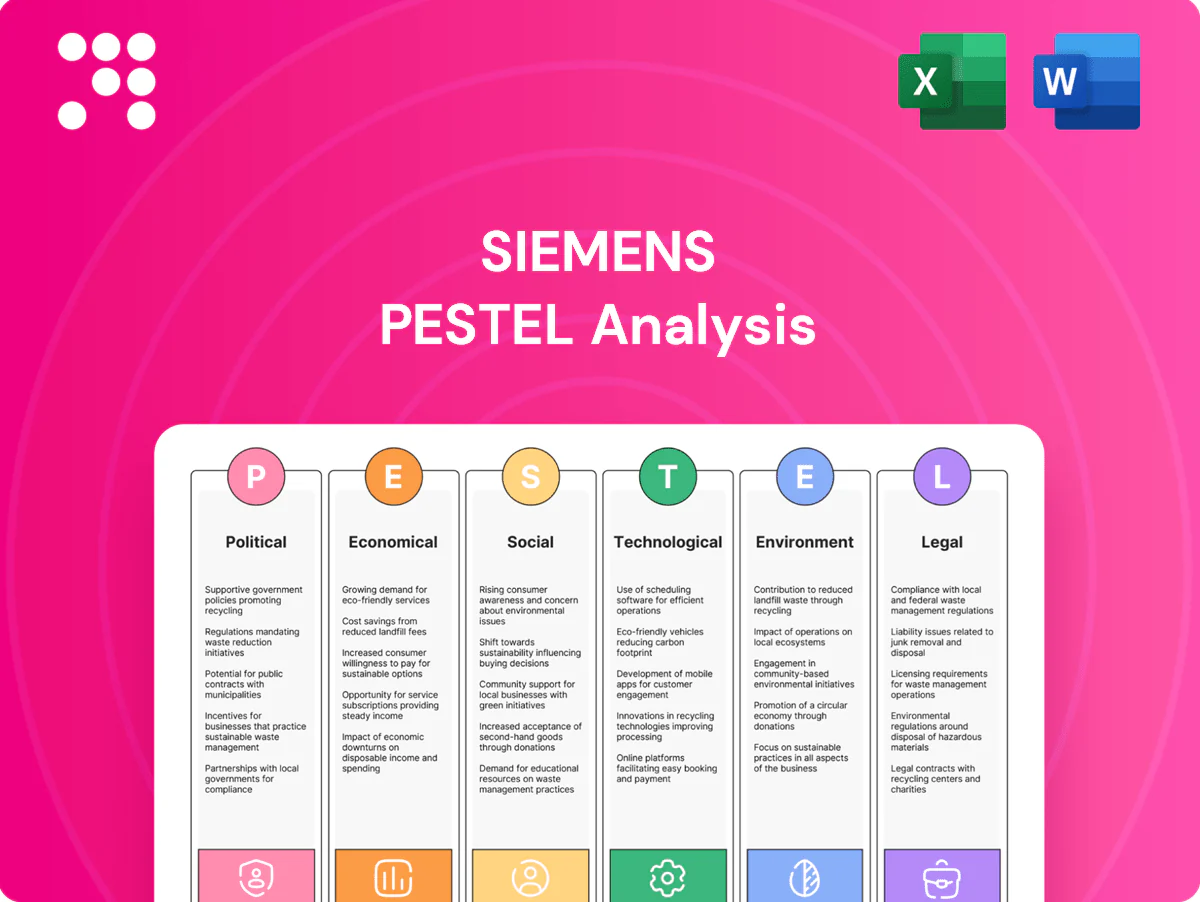
Siemens PESTLE Analysis

Make Smarter Strategic Decisions with a Complete PESTEL View
Unlock strategic clarity with our targeted PESTLE Analysis of Siemens—revealing how political shifts, economic cycles, social trends, technological innovation, legal changes, and environmental pressures shape its trajectory. Ideal for investors, consultants, and strategists, this concise intelligence helps you spot risks and opportunities fast. Purchase the full report to get the complete, editable analysis instantly.
Political factors

EU industrial policy and subsidies
The EU Green Deal Industrial Plan and 2023 Net-Zero Industry Act, which targets 40% domestic manufacture of strategic clean-tech by 2030, steer demand toward automation, grid and rail solutions, favoring Siemens' energy-efficiency, electrification and digital infrastructure offerings. National subsidy schemes across Germany, France and Italy channel billions into electrification and grid upgrades, but competition for funds forces firms to commit to local job creation and localization. Shifts in policy continuity and election outcomes across member states can rapidly reallocate subsidies and change procurement priorities.
Geopolitical tensions and export controls
Since 2022 US–China tech export controls and ongoing EU sanctions (notably post‑2022 measures on Russia) have constrained Siemens’ access to certain components and sales into sensitive sectors, forcing stricter screening of customers. Siemens must navigate complex dual‑use rules for advanced electronics, software and medical devices, with licensing processes that have lengthened deal cycles by weeks to months. Compliance and re‑routing of supplies and regionalization strategies are being used to mitigate disruptions and protect delivery timelines.

Public infrastructure spending
Government-backed upgrades in rail, grid and smart buildings—bolstered by NextGenerationEU ~€807bn—drive multi-year order pipelines for Siemens, aligning with a Global Infrastructure Hub estimate of $3.9tn annual investment need. Stimulus and recovery funds create project waves but intensify procurement competition and price pressure. Fiscal deficits and budget cycles can delay awards. PPPs expand opportunities yet add political and counterparty risk.

Healthcare policy and reimbursement
National health budgets and reimbursement frameworks shape imaging and diagnostics demand; the US spends about 18% of GDP on health versus an OECD average near 9%, driving procurement priorities. Value-based care shifts tenders toward total-cost-of-ownership and outcome metrics. Regulatory approval pathways and reference pricing vary widely, while public-private partnerships are expanding access in emerging markets.
- Budget pressure → demand timing and volumes
- Value-based tenders → TCO + outcomes
- Regulatory heterogeneity → market entry variance
- PPP growth → expanded EMR access
Localization and government procurement rules
Localization and buy-national procurement rules drive Siemens to redesign plant footprints and favor local suppliers, with EU public procurement ~14% of GDP in 2024 reinforcing market stakes. Tenders increasingly require tech transfer and local joint ventures, raising compliance and IP-management complexity but securing contracts. Rapid political shifts can change local-content thresholds and preference margins within months, altering project economics.
- Local content mandates shape supply chains
- Tech transfer and JV requirements common in tenders
- Compliance ups complexity but improves market access
EU Net‑Zero Act and €807bn stimulus plus export controls accelerate regional clean‑tech demand
Political shifts — EU Green Deal and Net‑Zero Industry Act (40% domestic clean‑tech by 2030) plus NextGenerationEU €807bn boost demand for Siemens' electrification, grid and rail solutions. US‑China export controls since 2022 and EU sanctions extend deal cycles and force regionalization. Local content and public procurement (~14% of EU GDP in 2024) raise compliance and reshape supply chains.
| Metric | Value |
|---|---|
| Net‑Zero Industry Act | 40% domestic clean‑tech by 2030 |
| NextGenerationEU | €807bn |
| EU public procurement (2024) | ~14% of GDP |
| Global infra need | $3.9tn/yr |
| Health spend (US vs OECD) | 18% vs ~9% of GDP |
What is included in the product
 Detailed Word Document
Explores how macro-environmental factors uniquely affect Siemens across Political, Economic, Social, Technological, Environmental and Legal dimensions, with data-backed trends and region-specific regulatory context; designed for executives and investors to identify threats, opportunities and forward-looking scenarios for strategic planning.

 Customizable Excel Spreadsheet
Visually segmented by PESTLE categories for quick interpretation at a glance, providing a concise, editable summary ideal for drop-in PowerPoint slides, team alignment, and adding region- or business-line-specific notes to support fast decision-making.
Economic factors

Industrial capex cycles
Factory automation and process-digitalization spend tracks S&P Global manufacturing PMI (around 50 in H1 2025) and reshoring waves; downturns delay capital upgrades while upturns compress lead times and swell order backlogs. Siemens’ push to subscription/software via Xcelerator (double-digit recurring revenue growth) cushions cyclicality. Regional demand varies with sector mix—autos, chemicals and semiconductors drive divergent timing and intensity.
Interest rates, FX, and financing
Higher policy rates (Fed funds 5.25–5.50% and ECB deposit ~4.00% in mid‑2024) increase customer WACC, causing deferral of capital projects and leases; EUR–USD ~1.07 in mid‑2024 and volatile EM currencies materially alter reported revenues and input costs; vendor financing and as‑a‑service offers help close deals by lowering upfront cost; hedging programs reduce but cannot eliminate FX exposure.

Energy prices and input inflation
European wholesale power and gas prices fell more than 50% from 2022 peaks by 2024, improving customer ROI for Siemens efficiency solutions; metals, electronics and logistics inflation remained elevated in 2024, continuing to pressure margins. Pricing power and aggressive cost engineering are therefore critical to defend profitability, while long-term contracts and indexation clauses provide only partial protection.

Emerging market growth and urbanization
Asia, the Middle East and Africa drive demand for transport, grid expansion and hospitals as urban populations rise; UN World Urbanization Prospects 2022 project Asia urban share to ~66% and Africa to ~56% by 2050, boosting smart infrastructure spending. Macro volatility and sovereign risk force selective bidding and staged contracts. Local and multilateral development banks frequently enable financing for complex projects.
- Regional focus: transport, grids, hospitals
- UN urbanization: Asia ~66%, Africa ~56% by 2050
- Risk: sovereign and macro volatility → selective projects
- Financing: local MDBs unlock complex deals
Supply chain resilience
- Component shortages: increase delivery risk
- Dual-sourcing/nearshoring: higher resilience, higher capital
- Digital visibility: faster disruption detection
- Supplier health/ESG: elevated monitoring
EU Net‑Zero Act and €807bn stimulus plus export controls accelerate regional clean‑tech demand
Factory capex follows S&P Global Manufacturing PMI ~50 (H1 2025); Siemens’ Xcelerator double‑digit recurring revenue growth cushions cycles. Higher policy rates (Fed 5.25–5.50%, ECB deposit ~4% mid‑2024) and EUR‑USD ~1.07 raise WACC and delay projects; supply shortages and freight push dual‑sourcing and inventory. Asia/Africa urbanization (Asia ~66%, Africa ~56% by 2050) sustains infrastructure demand; Siemens employs ≈300,000.
| Metric | Value |
|---|---|
| S&P PMI (H1 2025) | ~50 |
| Fed funds (mid‑2024) | 5.25–5.50% |
| ECB deposit (mid‑2024) | ~4.00% |
| EUR‑USD (mid‑2024) | ~1.07 |
| Siemens employees | ≈300,000 |
| Urbanization (2050) | Asia ~66%, Africa ~56% |
| Xcelerator growth | Double‑digit recurring rev growth |
What You See Is What You Get
Siemens PESTLE Analysis
This Siemens PESTLE Analysis provides a concise examination of political, economic, social, technological, legal and environmental factors affecting Siemens. The content and structure shown in the preview is the same document you’ll download after payment. It's fully formatted, professionally structured, and ready to use for strategy, valuation or academic work. No placeholders or surprises—what you see is what you'll receive.

Product Information
Product Information
Shipping & Returns
Shipping & Returns
Description
Make Smarter Strategic Decisions with a Complete PESTEL View
Unlock strategic clarity with our targeted PESTLE Analysis of Siemens—revealing how political shifts, economic cycles, social trends, technological innovation, legal changes, and environmental pressures shape its trajectory. Ideal for investors, consultants, and strategists, this concise intelligence helps you spot risks and opportunities fast. Purchase the full report to get the complete, editable analysis instantly.
Political factors
EU industrial policy and subsidies
The EU Green Deal Industrial Plan and 2023 Net-Zero Industry Act, which targets 40% domestic manufacture of strategic clean-tech by 2030, steer demand toward automation, grid and rail solutions, favoring Siemens' energy-efficiency, electrification and digital infrastructure offerings. National subsidy schemes across Germany, France and Italy channel billions into electrification and grid upgrades, but competition for funds forces firms to commit to local job creation and localization. Shifts in policy continuity and election outcomes across member states can rapidly reallocate subsidies and change procurement priorities.
Geopolitical tensions and export controls
Since 2022 US–China tech export controls and ongoing EU sanctions (notably post‑2022 measures on Russia) have constrained Siemens’ access to certain components and sales into sensitive sectors, forcing stricter screening of customers. Siemens must navigate complex dual‑use rules for advanced electronics, software and medical devices, with licensing processes that have lengthened deal cycles by weeks to months. Compliance and re‑routing of supplies and regionalization strategies are being used to mitigate disruptions and protect delivery timelines.
Public infrastructure spending
Government-backed upgrades in rail, grid and smart buildings—bolstered by NextGenerationEU ~€807bn—drive multi-year order pipelines for Siemens, aligning with a Global Infrastructure Hub estimate of $3.9tn annual investment need. Stimulus and recovery funds create project waves but intensify procurement competition and price pressure. Fiscal deficits and budget cycles can delay awards. PPPs expand opportunities yet add political and counterparty risk.
Healthcare policy and reimbursement
National health budgets and reimbursement frameworks shape imaging and diagnostics demand; the US spends about 18% of GDP on health versus an OECD average near 9%, driving procurement priorities. Value-based care shifts tenders toward total-cost-of-ownership and outcome metrics. Regulatory approval pathways and reference pricing vary widely, while public-private partnerships are expanding access in emerging markets.
- Budget pressure → demand timing and volumes
- Value-based tenders → TCO + outcomes
- Regulatory heterogeneity → market entry variance
- PPP growth → expanded EMR access
Localization and government procurement rules
Localization and buy-national procurement rules drive Siemens to redesign plant footprints and favor local suppliers, with EU public procurement ~14% of GDP in 2024 reinforcing market stakes. Tenders increasingly require tech transfer and local joint ventures, raising compliance and IP-management complexity but securing contracts. Rapid political shifts can change local-content thresholds and preference margins within months, altering project economics.
- Local content mandates shape supply chains
- Tech transfer and JV requirements common in tenders
- Compliance ups complexity but improves market access
EU Net‑Zero Act and €807bn stimulus plus export controls accelerate regional clean‑tech demand
Political shifts — EU Green Deal and Net‑Zero Industry Act (40% domestic clean‑tech by 2030) plus NextGenerationEU €807bn boost demand for Siemens' electrification, grid and rail solutions. US‑China export controls since 2022 and EU sanctions extend deal cycles and force regionalization. Local content and public procurement (~14% of EU GDP in 2024) raise compliance and reshape supply chains.
| Metric | Value |
|---|---|
| Net‑Zero Industry Act | 40% domestic clean‑tech by 2030 |
| NextGenerationEU | €807bn |
| EU public procurement (2024) | ~14% of GDP |
| Global infra need | $3.9tn/yr |
| Health spend (US vs OECD) | 18% vs ~9% of GDP |
What is included in the product
Detailed Word Document
Explores how macro-environmental factors uniquely affect Siemens across Political, Economic, Social, Technological, Environmental and Legal dimensions, with data-backed trends and region-specific regulatory context; designed for executives and investors to identify threats, opportunities and forward-looking scenarios for strategic planning.
Customizable Excel Spreadsheet
Visually segmented by PESTLE categories for quick interpretation at a glance, providing a concise, editable summary ideal for drop-in PowerPoint slides, team alignment, and adding region- or business-line-specific notes to support fast decision-making.
Economic factors
Industrial capex cycles
Factory automation and process-digitalization spend tracks S&P Global manufacturing PMI (around 50 in H1 2025) and reshoring waves; downturns delay capital upgrades while upturns compress lead times and swell order backlogs. Siemens’ push to subscription/software via Xcelerator (double-digit recurring revenue growth) cushions cyclicality. Regional demand varies with sector mix—autos, chemicals and semiconductors drive divergent timing and intensity.
Interest rates, FX, and financing
Higher policy rates (Fed funds 5.25–5.50% and ECB deposit ~4.00% in mid‑2024) increase customer WACC, causing deferral of capital projects and leases; EUR–USD ~1.07 in mid‑2024 and volatile EM currencies materially alter reported revenues and input costs; vendor financing and as‑a‑service offers help close deals by lowering upfront cost; hedging programs reduce but cannot eliminate FX exposure.
Energy prices and input inflation
European wholesale power and gas prices fell more than 50% from 2022 peaks by 2024, improving customer ROI for Siemens efficiency solutions; metals, electronics and logistics inflation remained elevated in 2024, continuing to pressure margins. Pricing power and aggressive cost engineering are therefore critical to defend profitability, while long-term contracts and indexation clauses provide only partial protection.
Emerging market growth and urbanization
Asia, the Middle East and Africa drive demand for transport, grid expansion and hospitals as urban populations rise; UN World Urbanization Prospects 2022 project Asia urban share to ~66% and Africa to ~56% by 2050, boosting smart infrastructure spending. Macro volatility and sovereign risk force selective bidding and staged contracts. Local and multilateral development banks frequently enable financing for complex projects.
- Regional focus: transport, grids, hospitals
- UN urbanization: Asia ~66%, Africa ~56% by 2050
- Risk: sovereign and macro volatility → selective projects
- Financing: local MDBs unlock complex deals
Supply chain resilience
- Component shortages: increase delivery risk
- Dual-sourcing/nearshoring: higher resilience, higher capital
- Digital visibility: faster disruption detection
- Supplier health/ESG: elevated monitoring
EU Net‑Zero Act and €807bn stimulus plus export controls accelerate regional clean‑tech demand
Factory capex follows S&P Global Manufacturing PMI ~50 (H1 2025); Siemens’ Xcelerator double‑digit recurring revenue growth cushions cycles. Higher policy rates (Fed 5.25–5.50%, ECB deposit ~4% mid‑2024) and EUR‑USD ~1.07 raise WACC and delay projects; supply shortages and freight push dual‑sourcing and inventory. Asia/Africa urbanization (Asia ~66%, Africa ~56% by 2050) sustains infrastructure demand; Siemens employs ≈300,000.
| Metric | Value |
|---|---|
| S&P PMI (H1 2025) | ~50 |
| Fed funds (mid‑2024) | 5.25–5.50% |
| ECB deposit (mid‑2024) | ~4.00% |
| EUR‑USD (mid‑2024) | ~1.07 |
| Siemens employees | ≈300,000 |
| Urbanization (2050) | Asia ~66%, Africa ~56% |
| Xcelerator growth | Double‑digit recurring rev growth |
What You See Is What You Get
Siemens PESTLE Analysis
This Siemens PESTLE Analysis provides a concise examination of political, economic, social, technological, legal and environmental factors affecting Siemens. The content and structure shown in the preview is the same document you’ll download after payment. It's fully formatted, professionally structured, and ready to use for strategy, valuation or academic work. No placeholders or surprises—what you see is what you'll receive.











