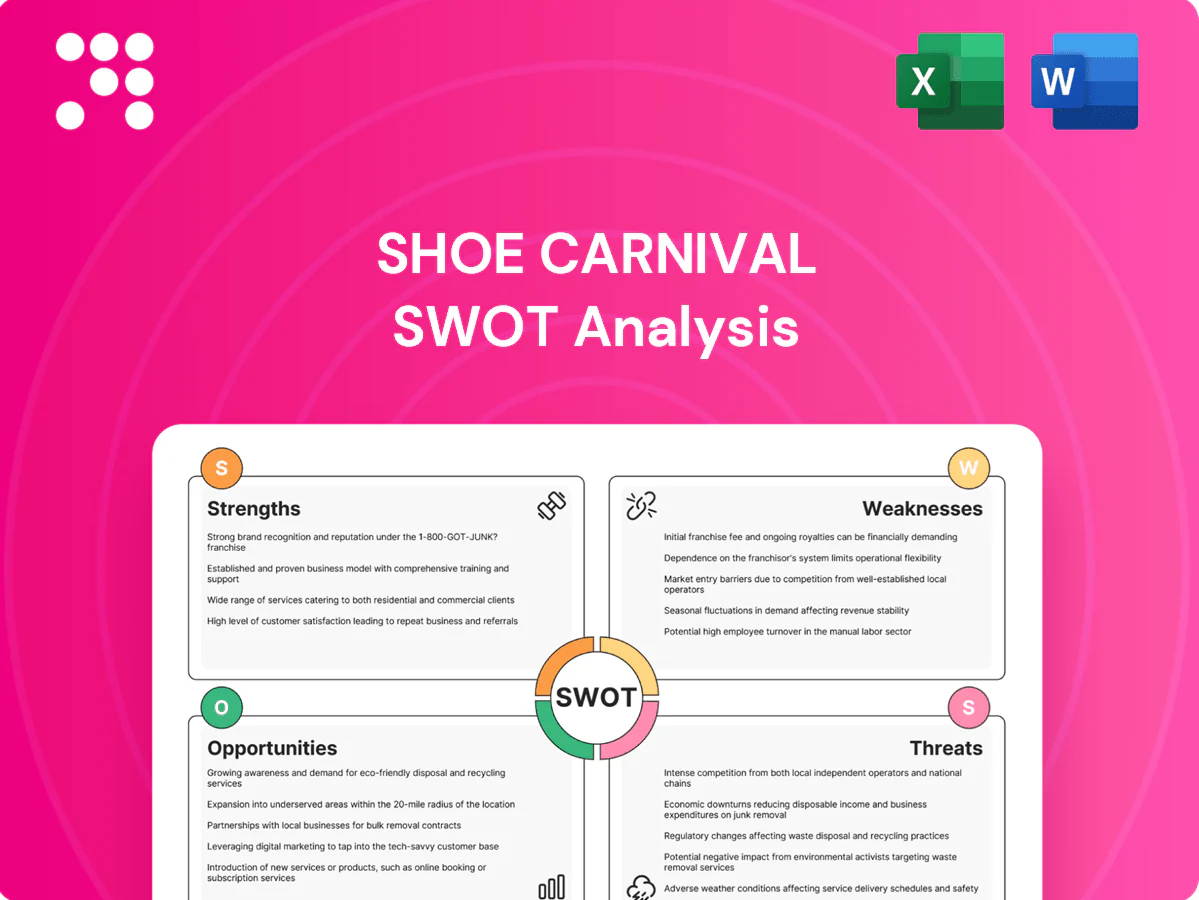
Shoe Carnival SWOT Analysis

Dive Deeper Into the Company’s Strategic Blueprint
Shoe Carnival’s SWOT highlights resilient value positioning, inventory agility, and regional brand loyalty, alongside margin pressure and e‑commerce gaps; opportunites include omnichannel expansion and private labels while competition and economic shifts pose risks. Discover the full, editable SWOT report—purchase now for a detailed, investor-ready Word and Excel package to plan, pitch, and act with confidence.
Strengths

Broad family assortment
Broad family assortment across men, women and kids creates one-stop convenience that boosts basket sizes; with over 340 stores nationwide and annual revenue topping 1 billion dollars, coverage of boots, sandals, athletics and accessories helps smooth seasonality and appeals to value- and variety-seeking households, supporting frequent traffic from recurring family needs.
Value-focused pricing
Everyday deals and frequent promotional events resonate with budget-conscious shoppers, helping Shoe Carnival sustain over $1 billion in annual sales (FY2024). Price leadership versus mass merchants preserves market share and supports traffic during macro slowdowns. Deal-driven merchandising accelerates inventory turns and cash conversion.

Engaging in-store experience
Shoe Carnival (SCVL) leverages a uniquely promotional, fun store environment that differentiates it from plain-rack retailers and supports event-style selling and PA-driven promotions that boost impulse purchases. This experiential format enhances local brand recall and complements family shopping trips with interactive cues. As of 2024 the chain operates about 340 stores across 35 states, reinforcing community-level impact.

Omnichannel reach
Omnichannel reach extends Shoe Carnival beyond its core Midwest footprint via over 300 stores plus growing e-commerce, enabling BOPIS and ship-from-store to use in-store inventory more efficiently. Digital discovery drives cross-channel traffic—online funnels customers to stores and in-store promotions boost digital orders—while online journey data refines merchandising assortments and promotions.
- Over 300 stores
- BOPIS/ship-from-store efficiency
- Cross-channel traffic flow
- Online data informs merchandising
Regional scale and vendor ties
Concentrated Midwest/South/Southeast presence (about 400 stores and roughly $1.3B net sales in FY2024) drives local merchandising expertise and cost leverage, supported by longstanding supplier agreements with mainstream footwear brands that secure broad assortments and favorable terms. Regional distribution centers shorten lead times to days and the repeatable store model enables rapid infill expansion.
- regional-scale
- ~400-stores-FY2024
- $1.3B-net-sales-FY2024
- shorter-lead-times
- repeatable-store-model
Omnichannel value retailer: experiential stores, BOPIS and regional scale drove FY2024 resilience
Wide family assortment and promotional, experiential stores drive repeat traffic and larger baskets; omnichannel BOPIS/ship-from-store boosts turns and cross-channel conversion. Regional scale (Midwest/South) plus supplier agreements shorten lead times and protect margins. FY2024 strength: resilient value positioning during slowdowns.
| Metric | FY2024 |
|---|---|
| Net Sales | $1.3B |
| Stores | ~400 |
What is included in the product
 Detailed Word Document
Provides a concise SWOT analysis of Shoe Carnival, highlighting internal strengths and weaknesses and external opportunities and threats that shape its competitive position and growth prospects.

 Customizable Excel Spreadsheet
Provides a concise Shoe Carnival SWOT matrix for fast, visual strategy alignment, helping pinpoint competitive strengths and address inventory or pricing weaknesses quickly for stakeholder decision-making.
Weaknesses

Geographic concentration
Heavy exposure in the Midwest and Southeast — with over 300 stores concentrated regionally — raises sensitivity to local weather and economic cycles, limits brand awareness on underpenetrated East and West coasts, reduces national advertising efficiency per dollar, and elevates catastrophe and logistics risk from regional disruptions.
High promo dependency
Event-driven traffic at Shoe Carnival trains shoppers to wait for markdowns, pressuring full-price sell-through during fashion turns and increasing margin volatility in competitive windows; promos also complicate demand forecasting—Shoe Carnival reported roughly $1.09 billion in net sales for fiscal 2024, amplifying the impact of discount-driven mix shifts.

Limited brand differentiation
Many SKUs overlap with rivals and marketplaces, limiting differentiation despite a store footprint of roughly 360 locations and fiscal 2024 net sales near $1.1B. Without exclusive product, Shoe Carnival struggles to command premium pricing; the experiential store model helps traffic but product sameness caps the moat. Private-label mix is modest—mid-single-digit share of sales—below peers that report double-digit private-label exposure.

Fashion and inventory risk
Rapid shifts in footwear trends by season and sport make misreads costly, driving markdowns and aged stock; size curves spanning 10+ size points intensify assortment complexity and return rates, and slow-moving styles tie up working capital, pressuring cash flow.
Store-based cost structure
Store-based cost structure saddles Shoe Carnival with fixed lease, labor and utility expenses across roughly 300 retail locations, so foot-traffic declines can quickly deleverage SG&A and margins. Ongoing remodels and maintenance require recurring capital expenditure, constraining cash flow and reducing flexibility versus asset-light online competitors.
- Leases, labor, utilities: fixed cost burden
- Traffic drop → rapid SG&A deleverage
- Remodels/maintenance → recurring capex
- Less flexible vs asset-light online rivals
Concentrated Midwest/Southeast chain: ~360 stores, $1.09B sales — promo-driven margin risk
Concentrated footprint (~360 stores, heavy Midwest/Southeast exposure) magnifies local-weather and economic risk, limits national brand reach, and raises logistics/catastrophe vulnerability. Promo-driven shopping depresses full-price sell-through, increasing margin volatility despite roughly $1.09B fiscal 2024 net sales. Modest private‑label (mid‑single‑digit share) and high assortment complexity raise markdown and working-capital pressure.
| Metric | Value |
|---|---|
| Store count | ~360 |
| Fiscal 2024 Net Sales | $1.09B |
| Private‑label share | Mid‑single‑digit % |
| Regional concentration | Midwest/Southeast |
Preview the Actual Deliverable
Shoe Carnival SWOT Analysis
This is the actual Shoe Carnival SWOT analysis document you’ll receive upon purchase—no surprises, just professional quality. The preview below is taken directly from the full report you'll get, and the content is structured, editable, and ready for use. Buy now to unlock the complete, detailed SWOT analysis for Shoe Carnival.

Original: $10.00
-65%$10.00
$3.50Product Information
Product Information
Shipping & Returns
Shipping & Returns
Description
Dive Deeper Into the Company’s Strategic Blueprint
Shoe Carnival’s SWOT highlights resilient value positioning, inventory agility, and regional brand loyalty, alongside margin pressure and e‑commerce gaps; opportunites include omnichannel expansion and private labels while competition and economic shifts pose risks. Discover the full, editable SWOT report—purchase now for a detailed, investor-ready Word and Excel package to plan, pitch, and act with confidence.
Strengths
Broad family assortment
Broad family assortment across men, women and kids creates one-stop convenience that boosts basket sizes; with over 340 stores nationwide and annual revenue topping 1 billion dollars, coverage of boots, sandals, athletics and accessories helps smooth seasonality and appeals to value- and variety-seeking households, supporting frequent traffic from recurring family needs.
Value-focused pricing
Everyday deals and frequent promotional events resonate with budget-conscious shoppers, helping Shoe Carnival sustain over $1 billion in annual sales (FY2024). Price leadership versus mass merchants preserves market share and supports traffic during macro slowdowns. Deal-driven merchandising accelerates inventory turns and cash conversion.
Engaging in-store experience
Shoe Carnival (SCVL) leverages a uniquely promotional, fun store environment that differentiates it from plain-rack retailers and supports event-style selling and PA-driven promotions that boost impulse purchases. This experiential format enhances local brand recall and complements family shopping trips with interactive cues. As of 2024 the chain operates about 340 stores across 35 states, reinforcing community-level impact.
Omnichannel reach
Omnichannel reach extends Shoe Carnival beyond its core Midwest footprint via over 300 stores plus growing e-commerce, enabling BOPIS and ship-from-store to use in-store inventory more efficiently. Digital discovery drives cross-channel traffic—online funnels customers to stores and in-store promotions boost digital orders—while online journey data refines merchandising assortments and promotions.
- Over 300 stores
- BOPIS/ship-from-store efficiency
- Cross-channel traffic flow
- Online data informs merchandising
Regional scale and vendor ties
Concentrated Midwest/South/Southeast presence (about 400 stores and roughly $1.3B net sales in FY2024) drives local merchandising expertise and cost leverage, supported by longstanding supplier agreements with mainstream footwear brands that secure broad assortments and favorable terms. Regional distribution centers shorten lead times to days and the repeatable store model enables rapid infill expansion.
- regional-scale
- ~400-stores-FY2024
- $1.3B-net-sales-FY2024
- shorter-lead-times
- repeatable-store-model
Omnichannel value retailer: experiential stores, BOPIS and regional scale drove FY2024 resilience
Wide family assortment and promotional, experiential stores drive repeat traffic and larger baskets; omnichannel BOPIS/ship-from-store boosts turns and cross-channel conversion. Regional scale (Midwest/South) plus supplier agreements shorten lead times and protect margins. FY2024 strength: resilient value positioning during slowdowns.
| Metric | FY2024 |
|---|---|
| Net Sales | $1.3B |
| Stores | ~400 |
What is included in the product
Detailed Word Document
Provides a concise SWOT analysis of Shoe Carnival, highlighting internal strengths and weaknesses and external opportunities and threats that shape its competitive position and growth prospects.
Customizable Excel Spreadsheet
Provides a concise Shoe Carnival SWOT matrix for fast, visual strategy alignment, helping pinpoint competitive strengths and address inventory or pricing weaknesses quickly for stakeholder decision-making.
Weaknesses
Geographic concentration
Heavy exposure in the Midwest and Southeast — with over 300 stores concentrated regionally — raises sensitivity to local weather and economic cycles, limits brand awareness on underpenetrated East and West coasts, reduces national advertising efficiency per dollar, and elevates catastrophe and logistics risk from regional disruptions.
High promo dependency
Event-driven traffic at Shoe Carnival trains shoppers to wait for markdowns, pressuring full-price sell-through during fashion turns and increasing margin volatility in competitive windows; promos also complicate demand forecasting—Shoe Carnival reported roughly $1.09 billion in net sales for fiscal 2024, amplifying the impact of discount-driven mix shifts.
Limited brand differentiation
Many SKUs overlap with rivals and marketplaces, limiting differentiation despite a store footprint of roughly 360 locations and fiscal 2024 net sales near $1.1B. Without exclusive product, Shoe Carnival struggles to command premium pricing; the experiential store model helps traffic but product sameness caps the moat. Private-label mix is modest—mid-single-digit share of sales—below peers that report double-digit private-label exposure.
Fashion and inventory risk
Rapid shifts in footwear trends by season and sport make misreads costly, driving markdowns and aged stock; size curves spanning 10+ size points intensify assortment complexity and return rates, and slow-moving styles tie up working capital, pressuring cash flow.
Store-based cost structure
Store-based cost structure saddles Shoe Carnival with fixed lease, labor and utility expenses across roughly 300 retail locations, so foot-traffic declines can quickly deleverage SG&A and margins. Ongoing remodels and maintenance require recurring capital expenditure, constraining cash flow and reducing flexibility versus asset-light online competitors.
- Leases, labor, utilities: fixed cost burden
- Traffic drop → rapid SG&A deleverage
- Remodels/maintenance → recurring capex
- Less flexible vs asset-light online rivals
Concentrated Midwest/Southeast chain: ~360 stores, $1.09B sales — promo-driven margin risk
Concentrated footprint (~360 stores, heavy Midwest/Southeast exposure) magnifies local-weather and economic risk, limits national brand reach, and raises logistics/catastrophe vulnerability. Promo-driven shopping depresses full-price sell-through, increasing margin volatility despite roughly $1.09B fiscal 2024 net sales. Modest private‑label (mid‑single‑digit share) and high assortment complexity raise markdown and working-capital pressure.
| Metric | Value |
|---|---|
| Store count | ~360 |
| Fiscal 2024 Net Sales | $1.09B |
| Private‑label share | Mid‑single‑digit % |
| Regional concentration | Midwest/Southeast |
Preview the Actual Deliverable
Shoe Carnival SWOT Analysis
This is the actual Shoe Carnival SWOT analysis document you’ll receive upon purchase—no surprises, just professional quality. The preview below is taken directly from the full report you'll get, and the content is structured, editable, and ready for use. Buy now to unlock the complete, detailed SWOT analysis for Shoe Carnival.











