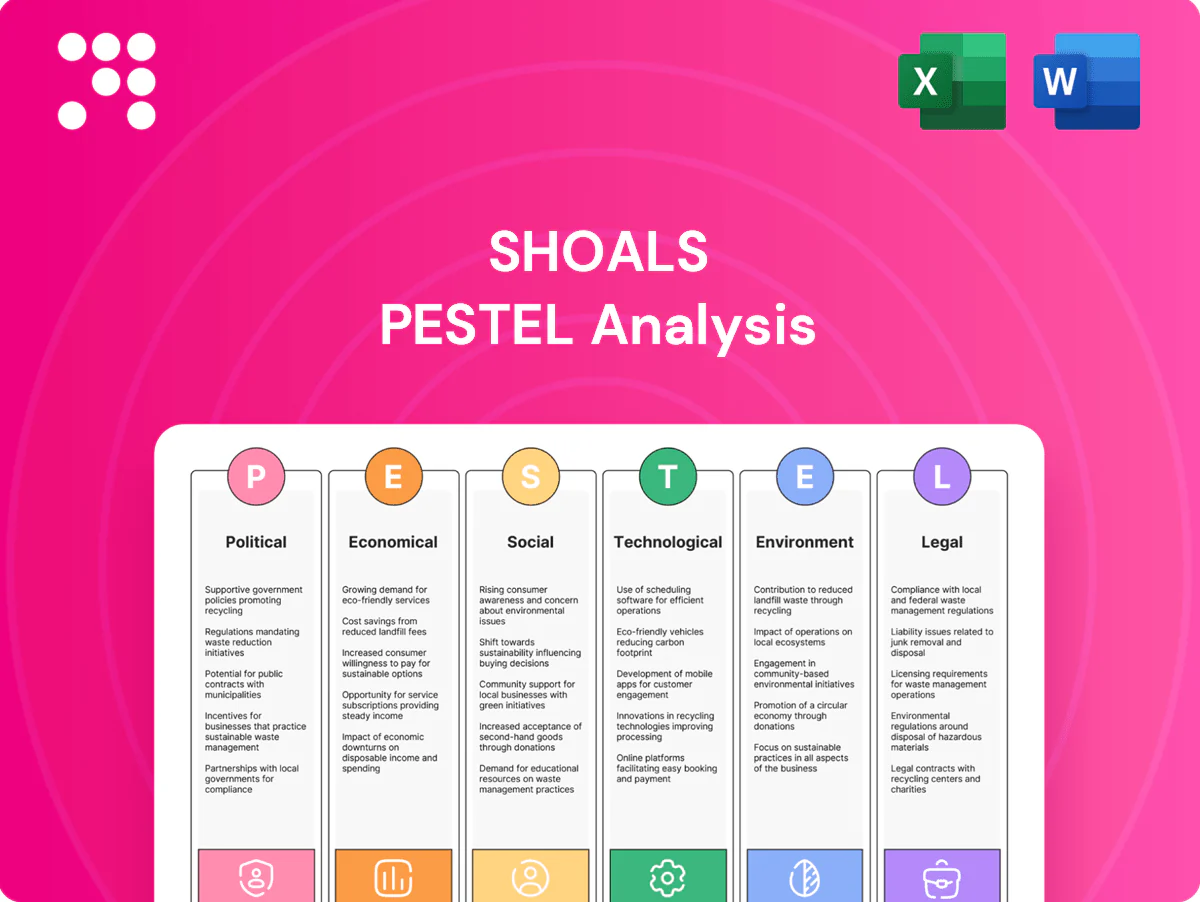
Shoals PESTLE Analysis

Your Competitive Advantage Starts with This Report
Discover how political, economic, social, technological, legal, and environmental forces are shaping Shoals's future in our concise PESTLE Analysis. This expert briefing highlights key risks and opportunities to inform investment and strategy decisions. Purchase the full report for the complete, editable breakdown and actionable insights.
Political factors

Renewable incentives
The U.S. Inflation Reduction Act directs roughly 369 billion dollars to energy and climate incentives, spurring utility-scale solar and storage buildout; similar schemes abroad expand subsidized pipelines. EBOS demand tracks the pace of subsidized projects and domestic-content bonuses of up to 10 percentage points for the ITC. Shoals can benefit from localization incentives but must align sourcing to qualify; policy rollbacks or delays could soften order pipelines.
Trade and tariffs
Tariffs on modules, inverters or metals — often in the 10–25% range in recent trade actions — materially shift project cost structures and can delay procurement and commissioning timelines. EBOS and balance-of-system players like Shoals can gain share if developers substitute toward tariff-favored components, as procurement shifts were observed across multiple 2023–24 project pipelines. Broader US-China trade tensions have already slowed contracting cycles; Shoals should diversify suppliers and tariff-proof key SKUs to preserve margins and timelines.

Grid and interconnection policy
Regulatory pushes for grid modernization, backed by roughly 65 billion USD from the Bipartisan Infrastructure Law, and interconnection reform are unlocking a US backlog exceeding 1,000 GW, easing long-standing project bottlenecks. Standardized interconnect requirements increase demand for reliable, code-compliant EBOS, improving procurement predictability. Multi-year delays at many ISOs/RTOs (commonly 2–5 years) prolong working capital cycles and delay revenue recognition. Active engagement in FERC, NERC and IEEE standards bodies can shape favorable technical specs.

Public infrastructure and EV funding
US NEVI and related federal programs provide roughly 5 billion dollars for EV charging and resilience, expanding adjacent EBOS use-cases as public tenders prioritize compliant, scalable and resilient wiring systems. Funding cycles remain lumpy, driving peaks in demand and the need for flexible manufacturing capacity. Shoals can bundle wiring, monitoring and service to score higher on grant criteria.
Geopolitical stability
Geopolitical instability drives currency swings and regional conflicts that disrupt metals and component logistics; USD strength of roughly 5% vs emerging-market currencies in 2024 raised imported-cost exposure for balance-of-system suppliers.
Developers re-sequenced projects by geography, altering sales mix, while sanctions and tightened export controls in 2024 narrowed supplier pools; risk-adjusted pricing and dual-sourcing reduced procurement disruption risk.
- FX volatility: USD ~+5% vs EM (2024)
- Supply constraint: export controls tightened (2024)
- Mitigant: dual-sourcing, risk premiums on bids
IRA/BIL/NEVI spur utility solar, storage & EV wiring; tariffs, export controls and FX raise costs
Federal incentives (IRA ~369B, BIL ~65B, NEVI ~5B) boost utility solar, storage and EV wiring demand but require domestic content and sourcing alignment; tariffs (10–25%) and 2024 export controls raised costs and procurement delays; USD ~+5% vs EM (2024) increased import exposure; policy rollbacks or interconnection delays can compress pipelines.
| Factor | Impact | Key figures |
|---|---|---|
| Incentives | Higher project build | IRA 369B, BIL 65B, NEVI 5B |
| Tariffs/Trade | Cost/timing volatility | Tariffs 10–25%, export controls 2024 |
| FX | Import cost pressure | USD +5% vs EM (2024) |
What is included in the product
 Detailed Word Document
Explores how external macro-environmental factors uniquely affect the Shoals across six dimensions: Political, Economic, Social, Technological, Environmental, and Legal, with each section data-backed and forward-looking to identify threats, opportunities and strategic responses relevant to the Shoals' industry and region.

 Customizable Excel Spreadsheet
A concise, visually segmented PESTLE summary for Shoals that simplifies external risk assessment, is easily dropped into presentations and shared across teams, and includes editable notes for regional or product-specific context.
Economic factors

Interest rates and capital costs
Project NPV and PPA competitiveness are highly sensitive to financing costs: US policy rates hovered around 5.25–5.50% in mid‑2025, pushing utility‑scale WACC commonly into the 6–8% range and delaying FIDs. Higher rates favor lower‑CAPEX designs and boost demand for EBOS that improve BOS efficiency. Rate cuts can rapidly reaccelerate pipelines, and Shoals strengthens value by shortening install time and cutting BOS CAPEX.
Commodity inputs
Copper (~US$8,500/tonne in 2024), aluminum (~US$2,300/tonne) and resin (HDPE/PP ~US$1,200–1,500/tonne) directly drive Shoals cable and enclosure costs, pushing gross-margin sensitivity. Volatility forces hedging programs and agile customer pricing clauses to preserve margins. Engineering design to cut copper content by 10–20% and supplier partnerships that reduce lead times and buffer inventory mitigate cost and supply risk.

Utility-scale solar and storage growth
Rising grid decarbonization targets expand Shoals addressable market as utility‑scale projects dominated global PV additions—IEA reported about 230 GW new PV in 2023, with utility projects ~60% of that—driving demand for EBOS. Hybrid solar‑plus‑storage plants boost BOS complexity and kit content per MW, letting Shoals upsell integrated wiring and monitoring for both PV and batteries. Cyclical module pricing can pull demand forward or delay builds, creating volatility in order timing and working capital.

Supply chain resilience
Global container rates remained roughly 40–60% below 2021 peaks in 2024 while US port dwell times averaged about 3–4 days, pressuring delivery SLAs and raising logistics costs for Shoals. Regionalizing assembly near demand centers can cut landed cost and supply risk by an estimated 15–30%, while safety stock for long‑lead items prevents site delays. Digital forecasting and collaborative SIOP with customers has improved forecast accuracy ~15–25% in recent pilots.
- Global logistics: container rates -40–60% vs 2021 (2024)
- Port dwell: ~3–4 days (US, 2024)
- Regional assembly: landed cost/risk cut ~15–30%
- Safety stock: protects against long‑lead delays
- Digital SIOP: forecast accuracy +15–25%
Pricing power and competition
Competitors vie on cost, reliability and speed-to-install; Shoals' differentiated plug-and-play EBOS enables premium pricing through labor savings and faster commissioning. Large EPC frameworks pressure discounts (often low double-digits) but provide volume certainty and multi-year order visibility. Ongoing cost-out roadmaps target supply-chain and product-cost reductions to preserve gross margin through project cycles.
- EBOS premium: labor & time savings
- EPC impact: volume vs price
- Discounts: low double-digits
- Cost-out: margin protection
IRA/BIL/NEVI spur utility solar, storage & EV wiring; tariffs, export controls and FX raise costs
Higher financing costs (US policy 5.25–5.50% mid‑2025) raise WACC (6–8%) and favor low‑CAPEX EBOS that cut BOS spend and install time. Commodity pressure (copper ~US$8,500/t, Al ~US$2,300/t in 2024) and logistics volatility drive margin sensitivity and hedging. PV build growth (IEA 230 GW new PV in 2023; ~60% utility) expands addressable market but creates timing risk.
| Metric | Value |
|---|---|
| US policy rate (mid‑2025) | 5.25–5.50% |
| Copper (2024) | ~US$8,500/t |
| New PV (2023) | ~230 GW |
| Container rates vs 2021 (2024) | -40–60% |
Preview Before You Purchase
Shoals PESTLE Analysis
The Shoals PESTLE Analysis provides a concise evaluation of political, economic, social, technological, legal and environmental factors affecting Shoals. The preview shown here is the exact document you’ll receive after purchase—fully formatted and ready to use. It includes structured insights, data highlights and strategic implications. No placeholders—this is the final file you’ll download upon payment.

Original: $10.00
-65%$10.00
$3.50Product Information
Product Information
Shipping & Returns
Shipping & Returns
Description
Your Competitive Advantage Starts with This Report
Discover how political, economic, social, technological, legal, and environmental forces are shaping Shoals's future in our concise PESTLE Analysis. This expert briefing highlights key risks and opportunities to inform investment and strategy decisions. Purchase the full report for the complete, editable breakdown and actionable insights.
Political factors
Renewable incentives
The U.S. Inflation Reduction Act directs roughly 369 billion dollars to energy and climate incentives, spurring utility-scale solar and storage buildout; similar schemes abroad expand subsidized pipelines. EBOS demand tracks the pace of subsidized projects and domestic-content bonuses of up to 10 percentage points for the ITC. Shoals can benefit from localization incentives but must align sourcing to qualify; policy rollbacks or delays could soften order pipelines.
Trade and tariffs
Tariffs on modules, inverters or metals — often in the 10–25% range in recent trade actions — materially shift project cost structures and can delay procurement and commissioning timelines. EBOS and balance-of-system players like Shoals can gain share if developers substitute toward tariff-favored components, as procurement shifts were observed across multiple 2023–24 project pipelines. Broader US-China trade tensions have already slowed contracting cycles; Shoals should diversify suppliers and tariff-proof key SKUs to preserve margins and timelines.
Grid and interconnection policy
Regulatory pushes for grid modernization, backed by roughly 65 billion USD from the Bipartisan Infrastructure Law, and interconnection reform are unlocking a US backlog exceeding 1,000 GW, easing long-standing project bottlenecks. Standardized interconnect requirements increase demand for reliable, code-compliant EBOS, improving procurement predictability. Multi-year delays at many ISOs/RTOs (commonly 2–5 years) prolong working capital cycles and delay revenue recognition. Active engagement in FERC, NERC and IEEE standards bodies can shape favorable technical specs.
Public infrastructure and EV funding
US NEVI and related federal programs provide roughly 5 billion dollars for EV charging and resilience, expanding adjacent EBOS use-cases as public tenders prioritize compliant, scalable and resilient wiring systems. Funding cycles remain lumpy, driving peaks in demand and the need for flexible manufacturing capacity. Shoals can bundle wiring, monitoring and service to score higher on grant criteria.
Geopolitical stability
Geopolitical instability drives currency swings and regional conflicts that disrupt metals and component logistics; USD strength of roughly 5% vs emerging-market currencies in 2024 raised imported-cost exposure for balance-of-system suppliers.
Developers re-sequenced projects by geography, altering sales mix, while sanctions and tightened export controls in 2024 narrowed supplier pools; risk-adjusted pricing and dual-sourcing reduced procurement disruption risk.
- FX volatility: USD ~+5% vs EM (2024)
- Supply constraint: export controls tightened (2024)
- Mitigant: dual-sourcing, risk premiums on bids
IRA/BIL/NEVI spur utility solar, storage & EV wiring; tariffs, export controls and FX raise costs
Federal incentives (IRA ~369B, BIL ~65B, NEVI ~5B) boost utility solar, storage and EV wiring demand but require domestic content and sourcing alignment; tariffs (10–25%) and 2024 export controls raised costs and procurement delays; USD ~+5% vs EM (2024) increased import exposure; policy rollbacks or interconnection delays can compress pipelines.
| Factor | Impact | Key figures |
|---|---|---|
| Incentives | Higher project build | IRA 369B, BIL 65B, NEVI 5B |
| Tariffs/Trade | Cost/timing volatility | Tariffs 10–25%, export controls 2024 |
| FX | Import cost pressure | USD +5% vs EM (2024) |
What is included in the product
Detailed Word Document
Explores how external macro-environmental factors uniquely affect the Shoals across six dimensions: Political, Economic, Social, Technological, Environmental, and Legal, with each section data-backed and forward-looking to identify threats, opportunities and strategic responses relevant to the Shoals' industry and region.
Customizable Excel Spreadsheet
A concise, visually segmented PESTLE summary for Shoals that simplifies external risk assessment, is easily dropped into presentations and shared across teams, and includes editable notes for regional or product-specific context.
Economic factors
Interest rates and capital costs
Project NPV and PPA competitiveness are highly sensitive to financing costs: US policy rates hovered around 5.25–5.50% in mid‑2025, pushing utility‑scale WACC commonly into the 6–8% range and delaying FIDs. Higher rates favor lower‑CAPEX designs and boost demand for EBOS that improve BOS efficiency. Rate cuts can rapidly reaccelerate pipelines, and Shoals strengthens value by shortening install time and cutting BOS CAPEX.
Commodity inputs
Copper (~US$8,500/tonne in 2024), aluminum (~US$2,300/tonne) and resin (HDPE/PP ~US$1,200–1,500/tonne) directly drive Shoals cable and enclosure costs, pushing gross-margin sensitivity. Volatility forces hedging programs and agile customer pricing clauses to preserve margins. Engineering design to cut copper content by 10–20% and supplier partnerships that reduce lead times and buffer inventory mitigate cost and supply risk.
Utility-scale solar and storage growth
Rising grid decarbonization targets expand Shoals addressable market as utility‑scale projects dominated global PV additions—IEA reported about 230 GW new PV in 2023, with utility projects ~60% of that—driving demand for EBOS. Hybrid solar‑plus‑storage plants boost BOS complexity and kit content per MW, letting Shoals upsell integrated wiring and monitoring for both PV and batteries. Cyclical module pricing can pull demand forward or delay builds, creating volatility in order timing and working capital.
Supply chain resilience
Global container rates remained roughly 40–60% below 2021 peaks in 2024 while US port dwell times averaged about 3–4 days, pressuring delivery SLAs and raising logistics costs for Shoals. Regionalizing assembly near demand centers can cut landed cost and supply risk by an estimated 15–30%, while safety stock for long‑lead items prevents site delays. Digital forecasting and collaborative SIOP with customers has improved forecast accuracy ~15–25% in recent pilots.
- Global logistics: container rates -40–60% vs 2021 (2024)
- Port dwell: ~3–4 days (US, 2024)
- Regional assembly: landed cost/risk cut ~15–30%
- Safety stock: protects against long‑lead delays
- Digital SIOP: forecast accuracy +15–25%
Pricing power and competition
Competitors vie on cost, reliability and speed-to-install; Shoals' differentiated plug-and-play EBOS enables premium pricing through labor savings and faster commissioning. Large EPC frameworks pressure discounts (often low double-digits) but provide volume certainty and multi-year order visibility. Ongoing cost-out roadmaps target supply-chain and product-cost reductions to preserve gross margin through project cycles.
- EBOS premium: labor & time savings
- EPC impact: volume vs price
- Discounts: low double-digits
- Cost-out: margin protection
IRA/BIL/NEVI spur utility solar, storage & EV wiring; tariffs, export controls and FX raise costs
Higher financing costs (US policy 5.25–5.50% mid‑2025) raise WACC (6–8%) and favor low‑CAPEX EBOS that cut BOS spend and install time. Commodity pressure (copper ~US$8,500/t, Al ~US$2,300/t in 2024) and logistics volatility drive margin sensitivity and hedging. PV build growth (IEA 230 GW new PV in 2023; ~60% utility) expands addressable market but creates timing risk.
| Metric | Value |
|---|---|
| US policy rate (mid‑2025) | 5.25–5.50% |
| Copper (2024) | ~US$8,500/t |
| New PV (2023) | ~230 GW |
| Container rates vs 2021 (2024) | -40–60% |
Preview Before You Purchase
Shoals PESTLE Analysis
The Shoals PESTLE Analysis provides a concise evaluation of political, economic, social, technological, legal and environmental factors affecting Shoals. The preview shown here is the exact document you’ll receive after purchase—fully formatted and ready to use. It includes structured insights, data highlights and strategic implications. No placeholders—this is the final file you’ll download upon payment.











