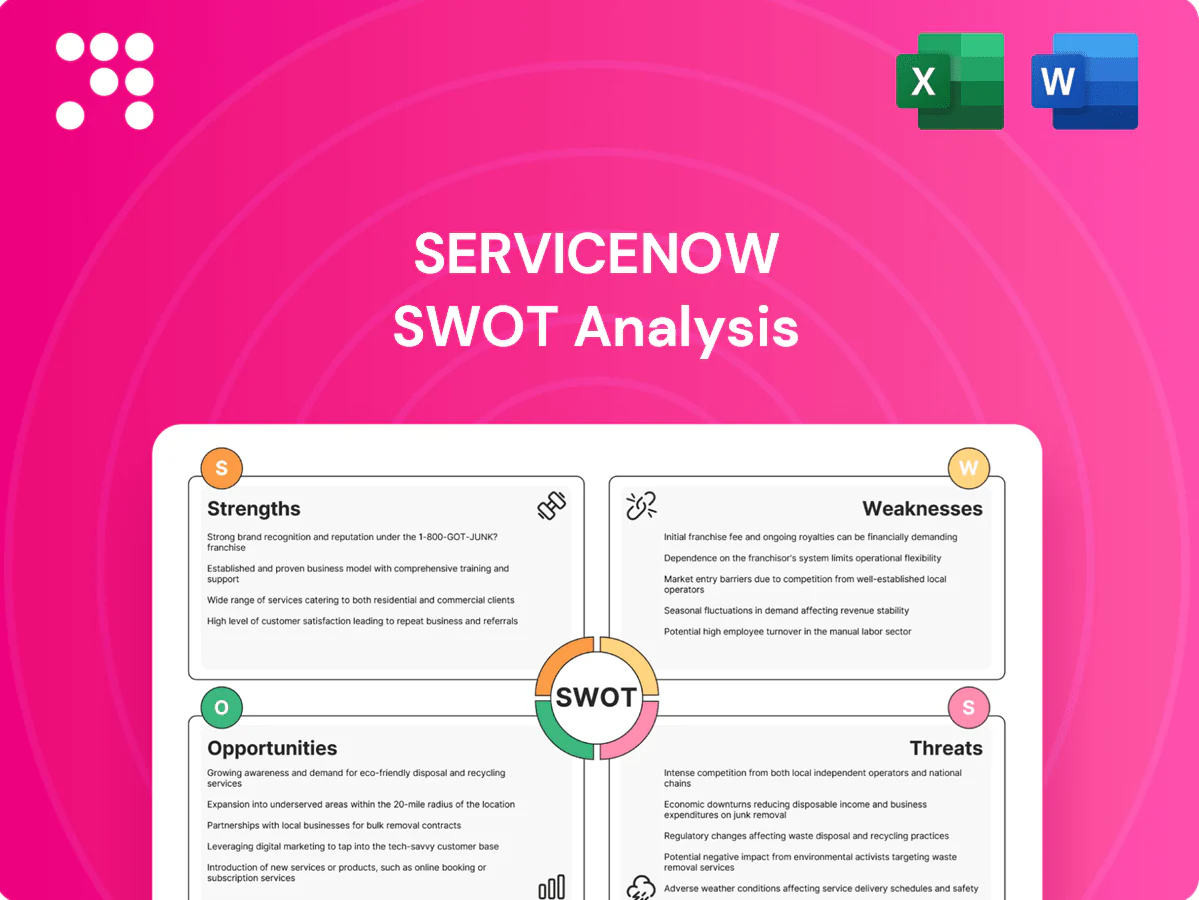
ServiceNow SWOT Analysis

Elevate Your Analysis with the Complete SWOT Report
ServiceNow's SWOT highlights a dominant cloud workflow platform, recurring revenue strength, and robust partner ecosystem, countered by intensifying competition and valuation sensitivity. Our full SWOT unpacks market threats, execution risks, and growth levers in detail. Purchase the complete analysis for actionable insights, a Word report, and editable Excel matrix to guide strategy and investment. Don't settle for a snapshot—unlock the full report today.
Strengths

Unified workflow platform
One cloud-native platform consolidates IT, HR, customer service and operations, with ServiceNow serving thousands of enterprises and reporting ~20% revenue growth in FY2024; a single data model and shared services cut silos and manual handoffs, delivering end-to-end visibility and standardized governance, and improving time-to-value by reusing components across departments for faster deployments.
Deep enterprise-grade capabilities
Proven scalability, reliability and security power deployments across roughly 80% of the Fortune 500, supporting large, complex organizations. Native CMDB, automation, orchestration and governance engines are battle-tested in mission-critical environments. Compliance certifications including ISO 27001, SOC 1/2 and FedRAMP Moderate plus robust access controls meet stringent regulatory requirements.

High switching costs and stickiness
Extensive workflows, integrations, and custom apps embed ServiceNow into daily operations, creating high switching costs as processes and data become platform-native. As usage expands across IT, HR, and customer workflows, value compounds and replacement risk declines, supporting land-and-expand motions that drive cross-module adoption. ServiceNow reported strong renewal momentum and dollar-based net retention near 120% in 2024, reflecting multi-year, multi-module dependencies that boost lifetime value.

Low-code and ecosystem leverage
Low-code tooling lets developers and citizen builders deliver apps faster, supporting Gartner’s forecast that low-code will drive ~65% of application development by 2025; ServiceNow’s App Engine plus a marketplace of thousands of prebuilt apps and integrations shortens implementation cycles. A large partner network accelerates solution delivery while governance controls preserve enterprise agility and compliance.
- Low-code: faster delivery
- Marketplace: thousands of prebuilt apps
- Partner network: accelerated implementation
- Governance: agility with control
Strong brand in digital workflows
ServiceNow's market leadership in IT service management and workflow automation—FY2024 revenue $8.83 billion and 10,000+ customers—gives credibility to expand into adjacent domains, with recognized thought leadership that accelerates enterprise sales and deal cycles. Referenceable outcomes from large deployments measurably improve win rates and enable premium pricing and strategic positioning.
- Credibility: expands into adjacent domains
- Thought leadership: shortens enterprise sales cycles
- References: higher win rates
- Brand equity: supports premium pricing
Cloud platform posts $8.83B, ~20% growth, ~120% retention
ServiceNow’s cloud-native platform drove FY2024 revenue $8.83B (~20% YoY) across 10,000+ customers, with dollar-based net retention ~120% and deployments in ~80% of the Fortune 500, creating high switching costs via native CMDB, low-code App Engine, marketplace and a large partner ecosystem.
| Metric | Value |
|---|---|
| FY2024 Revenue | $8.83B |
| YoY Growth | ~20% |
| Customers | 10,000+ |
| DBNR | ~120% |
| Fortune 500 Penetration | ~80% |
What is included in the product
 Detailed Word Document
Delivers a strategic overview of ServiceNow’s internal and external business factors, outlining its strengths, weaknesses, opportunities, and threats to assess competitive position, growth drivers, operational gaps, and market risks shaping its future.

 Customizable Excel Spreadsheet
Provides a concise, visual SWOT matrix tailored to ServiceNow to quickly identify strengths, weaknesses, opportunities, and threats, easing stakeholder alignment and accelerating strategic decision-making.
Weaknesses

Premium pricing and TCO
Licensing, implementation and ongoing administration costs for ServiceNow can be high, with large deployments commonly exceeding $1M and material multi-year TCO. Tight budget scrutiny can limit seat expansion or additional modules, and price-sensitive segments often opt for lighter tools. ROI cases therefore must be robust and measurable, with payback typically targeted within 12–36 months.
Implementation complexity
Large ServiceNow deployments demand careful design, change management and skilled resources, often spanning 6–18 months for enterprise rollouts and delaying ROI; ServiceNow reported fiscal 2024 revenue of $9.9B, underscoring scale but also complexity. Over-customization drives technical debt and increased TCO, so strict governance is required to sustain performance.

Reliance on partner services
Many ServiceNow projects depend on systems integrators for success, and McKinsey estimates roughly 70% of digital transformations fail when execution or partners falter. Partner quality and availability vary by region and industry, which in a global IT services market of about $1.2 trillion (2024) can skew pricing and timelines. Misaligned incentives often inflate scope and cost, leaving customers with uneven experiences across engagements.

Limited industry depth vs best-of-breed
Horizontal workflows can miss niche sector features, forcing extra configuration or ISV add-ons; ServiceNow reported FY2024 revenue >$8B and serves over 8,000 enterprises, yet best-of-breed vendors often lead on domain-specific depth. That gap can slow time-to-value and complicate procurement and solution architecture for regulated industries.
- Horizontal-first platform
- May need ISV/extensions
- Procurement/architecture complexity
- Specialized vendors outpace domain features
Enterprise focus limits SMB reach
ServiceNow sales motions and product complexity skew toward large enterprises, reflected in fiscal 2024 revenue of about 8.6 billion driven largely by big-ticket deals. Mid-market customers often perceive the platform as heavy and costly, creating adoption friction versus lighter mid-tier tools that win with good-enough functionality. Simplified, lower-cost packages are needed to broaden SMB reach and stem competitive undercutting.
- Enterprise-centric sales
- Perceived heaviness by mid-market
- Need for simplified packages
- Mid-tier competitors undercut
High TCO, long payback and over-customization stall enterprise rollouts and mid-market adoption
High licensing and TCO (large deployments commonly >$1M) constrain seat/module expansion and demand 12–36 month payback; enterprise rollouts typically span 6–18 months and can be delayed by design and change management. Over-customization increases technical debt and reliance on systems integrators, with partner quality varying by region. Platform is horizontal-first, prompting ISV add-ons for niche sectors and limiting mid-market adoption.
| Metric | Value |
|---|---|
| FY2024 revenue | $9.9B |
| Enterprise customers | ≈8,000+ |
| Large deployment cost | >$1M |
| Enterprise rollout time | 6–18 months |
| Digital transformation failure (McKinsey) | ≈70% |
Full Version Awaits
ServiceNow SWOT Analysis
This is the actual SWOT analysis document you’ll receive upon purchase—no surprises, just professional quality. The preview below is taken directly from the full SWOT report you'll get, and the content shown is a real excerpt. Once purchased, you’ll receive the complete, editable version. Buy now to unlock the full, detailed report.

Original: $10.00
-65%$10.00
$3.50Product Information
Product Information
Shipping & Returns
Shipping & Returns
Description
Elevate Your Analysis with the Complete SWOT Report
ServiceNow's SWOT highlights a dominant cloud workflow platform, recurring revenue strength, and robust partner ecosystem, countered by intensifying competition and valuation sensitivity. Our full SWOT unpacks market threats, execution risks, and growth levers in detail. Purchase the complete analysis for actionable insights, a Word report, and editable Excel matrix to guide strategy and investment. Don't settle for a snapshot—unlock the full report today.
Strengths
Unified workflow platform
One cloud-native platform consolidates IT, HR, customer service and operations, with ServiceNow serving thousands of enterprises and reporting ~20% revenue growth in FY2024; a single data model and shared services cut silos and manual handoffs, delivering end-to-end visibility and standardized governance, and improving time-to-value by reusing components across departments for faster deployments.
Deep enterprise-grade capabilities
Proven scalability, reliability and security power deployments across roughly 80% of the Fortune 500, supporting large, complex organizations. Native CMDB, automation, orchestration and governance engines are battle-tested in mission-critical environments. Compliance certifications including ISO 27001, SOC 1/2 and FedRAMP Moderate plus robust access controls meet stringent regulatory requirements.
High switching costs and stickiness
Extensive workflows, integrations, and custom apps embed ServiceNow into daily operations, creating high switching costs as processes and data become platform-native. As usage expands across IT, HR, and customer workflows, value compounds and replacement risk declines, supporting land-and-expand motions that drive cross-module adoption. ServiceNow reported strong renewal momentum and dollar-based net retention near 120% in 2024, reflecting multi-year, multi-module dependencies that boost lifetime value.
Low-code and ecosystem leverage
Low-code tooling lets developers and citizen builders deliver apps faster, supporting Gartner’s forecast that low-code will drive ~65% of application development by 2025; ServiceNow’s App Engine plus a marketplace of thousands of prebuilt apps and integrations shortens implementation cycles. A large partner network accelerates solution delivery while governance controls preserve enterprise agility and compliance.
- Low-code: faster delivery
- Marketplace: thousands of prebuilt apps
- Partner network: accelerated implementation
- Governance: agility with control
Strong brand in digital workflows
ServiceNow's market leadership in IT service management and workflow automation—FY2024 revenue $8.83 billion and 10,000+ customers—gives credibility to expand into adjacent domains, with recognized thought leadership that accelerates enterprise sales and deal cycles. Referenceable outcomes from large deployments measurably improve win rates and enable premium pricing and strategic positioning.
- Credibility: expands into adjacent domains
- Thought leadership: shortens enterprise sales cycles
- References: higher win rates
- Brand equity: supports premium pricing
Cloud platform posts $8.83B, ~20% growth, ~120% retention
ServiceNow’s cloud-native platform drove FY2024 revenue $8.83B (~20% YoY) across 10,000+ customers, with dollar-based net retention ~120% and deployments in ~80% of the Fortune 500, creating high switching costs via native CMDB, low-code App Engine, marketplace and a large partner ecosystem.
| Metric | Value |
|---|---|
| FY2024 Revenue | $8.83B |
| YoY Growth | ~20% |
| Customers | 10,000+ |
| DBNR | ~120% |
| Fortune 500 Penetration | ~80% |
What is included in the product
Detailed Word Document
Delivers a strategic overview of ServiceNow’s internal and external business factors, outlining its strengths, weaknesses, opportunities, and threats to assess competitive position, growth drivers, operational gaps, and market risks shaping its future.
Customizable Excel Spreadsheet
Provides a concise, visual SWOT matrix tailored to ServiceNow to quickly identify strengths, weaknesses, opportunities, and threats, easing stakeholder alignment and accelerating strategic decision-making.
Weaknesses
Premium pricing and TCO
Licensing, implementation and ongoing administration costs for ServiceNow can be high, with large deployments commonly exceeding $1M and material multi-year TCO. Tight budget scrutiny can limit seat expansion or additional modules, and price-sensitive segments often opt for lighter tools. ROI cases therefore must be robust and measurable, with payback typically targeted within 12–36 months.
Implementation complexity
Large ServiceNow deployments demand careful design, change management and skilled resources, often spanning 6–18 months for enterprise rollouts and delaying ROI; ServiceNow reported fiscal 2024 revenue of $9.9B, underscoring scale but also complexity. Over-customization drives technical debt and increased TCO, so strict governance is required to sustain performance.
Reliance on partner services
Many ServiceNow projects depend on systems integrators for success, and McKinsey estimates roughly 70% of digital transformations fail when execution or partners falter. Partner quality and availability vary by region and industry, which in a global IT services market of about $1.2 trillion (2024) can skew pricing and timelines. Misaligned incentives often inflate scope and cost, leaving customers with uneven experiences across engagements.
Limited industry depth vs best-of-breed
Horizontal workflows can miss niche sector features, forcing extra configuration or ISV add-ons; ServiceNow reported FY2024 revenue >$8B and serves over 8,000 enterprises, yet best-of-breed vendors often lead on domain-specific depth. That gap can slow time-to-value and complicate procurement and solution architecture for regulated industries.
- Horizontal-first platform
- May need ISV/extensions
- Procurement/architecture complexity
- Specialized vendors outpace domain features
Enterprise focus limits SMB reach
ServiceNow sales motions and product complexity skew toward large enterprises, reflected in fiscal 2024 revenue of about 8.6 billion driven largely by big-ticket deals. Mid-market customers often perceive the platform as heavy and costly, creating adoption friction versus lighter mid-tier tools that win with good-enough functionality. Simplified, lower-cost packages are needed to broaden SMB reach and stem competitive undercutting.
- Enterprise-centric sales
- Perceived heaviness by mid-market
- Need for simplified packages
- Mid-tier competitors undercut
High TCO, long payback and over-customization stall enterprise rollouts and mid-market adoption
High licensing and TCO (large deployments commonly >$1M) constrain seat/module expansion and demand 12–36 month payback; enterprise rollouts typically span 6–18 months and can be delayed by design and change management. Over-customization increases technical debt and reliance on systems integrators, with partner quality varying by region. Platform is horizontal-first, prompting ISV add-ons for niche sectors and limiting mid-market adoption.
| Metric | Value |
|---|---|
| FY2024 revenue | $9.9B |
| Enterprise customers | ≈8,000+ |
| Large deployment cost | >$1M |
| Enterprise rollout time | 6–18 months |
| Digital transformation failure (McKinsey) | ≈70% |
Full Version Awaits
ServiceNow SWOT Analysis
This is the actual SWOT analysis document you’ll receive upon purchase—no surprises, just professional quality. The preview below is taken directly from the full SWOT report you'll get, and the content shown is a real excerpt. Once purchased, you’ll receive the complete, editable version. Buy now to unlock the full, detailed report.











