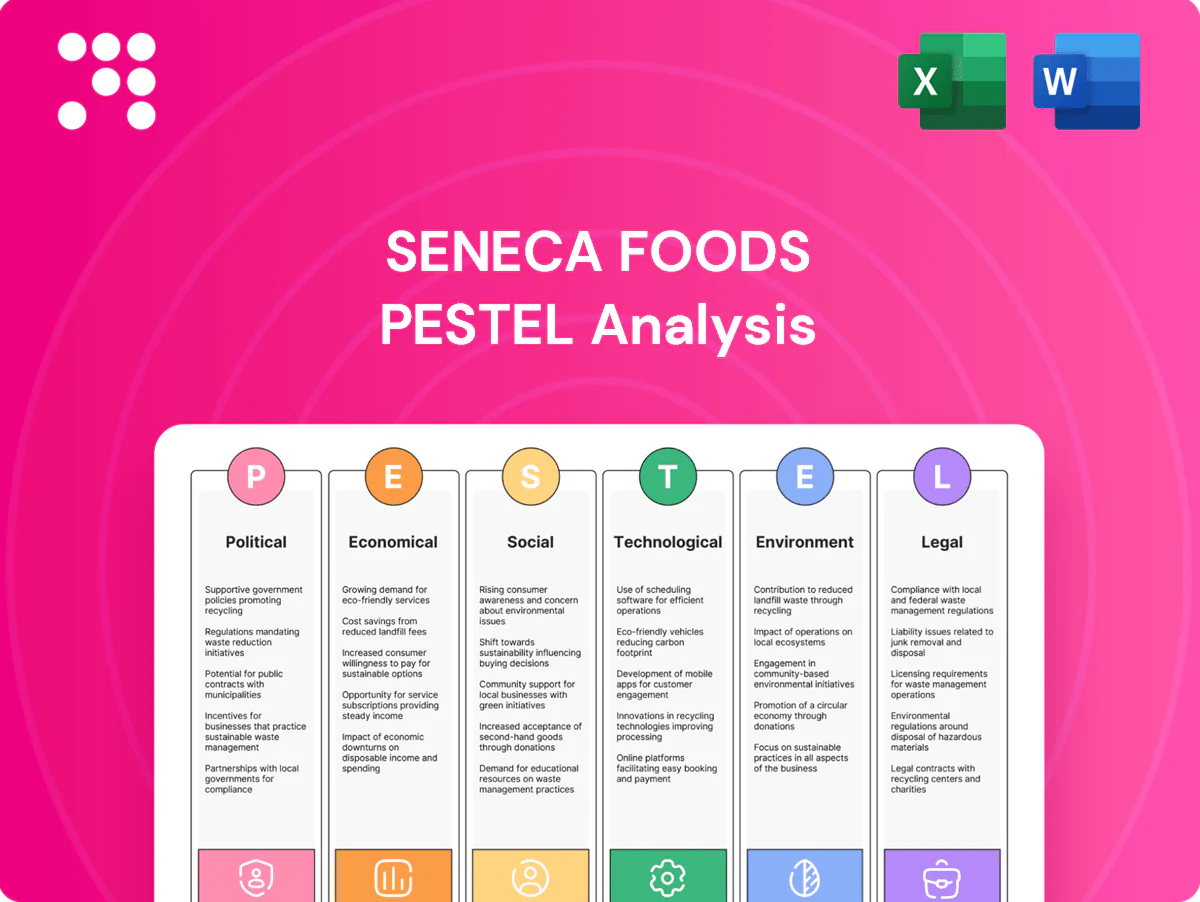
Seneca Foods PESTLE Analysis

Your Competitive Advantage Starts with This Report
Our PESTLE Analysis for Seneca Foods maps political, economic, social, technological, legal and environmental forces shaping its supply chains and margins, highlighting regulatory risks, shifting consumer trends and sustainability pressures. Use these insights to anticipate disruptions, spot growth levers, and sharpen strategy. Purchase the full report to access the complete, actionable breakdown instantly.
Political factors

US ag policy subsidies
US farm bills (five-year cycles; 2018–2023 covered most recent period) and USDA programs materially shape economics for vegetables and fruits Seneca Foods processes, affecting price signals and acreage. Federal crop insurance typically subsidizes roughly 60% of premiums, influencing growers’ planting and contract commitments. Changes in subsidy structure or reauthorization timing can shift raw-material costs and supply reliability, so monitoring cycles is critical.
Trade tariffs and export access
Tariffs on canned and frozen produce and a 25% US Section 232 steel tariff raise Seneca’s can input costs and weaken export competitiveness, pressuring margins.
Retaliatory measures from China and the EU in 2018–19 showed how quickly market access can be disrupted in key regions.
USMCA (effective 2020) and bilateral trade deals shape labeling and sanitary standards, and ongoing volatility makes hedging international sales and FX exposure essential.

Buy American and procurement
Buy American mandates in nutrition programs such as the National School Lunch Program, which serves about 29 million students daily, can lift demand for US-packed products and benefit Seneca Foods’ institutional channels. Government procurement policies favoring domestic processors require strict origin certification and documentation to qualify for contracts. Political shifts at federal and state levels can materially tighten or relax these requirements, affecting bid opportunities and volumes.

Infrastructure and logistics funding
Public investment under the 2021 Bipartisan Infrastructure Law (roughly $1.2 trillion) affects Seneca Foods by improving roads, rail, and port capacity for inbound crops and outbound goods; reliability spikes during seasonal harvests when regional transport is critical. Trucking availability is pressured by an American Trucking Associations estimated driver shortfall of about 80,000, increasing lead times and costs when congestion or underinvestment occur.
- Infrastructure spend: $1.2 trillion
- Driver shortfall: ~80,000 (ATA)
- Seasonal sensitivity: higher lead times/costs
State-level incentives and zoning
State-level incentives and zoning affect Seneca Foods operations: 50 states offer varied tax credits/grants and local zoning/permitting can delay plant modernization timelines by months; workforce training funds such as WIOA (roughly $3.3B annual federal program) can subsidize seasonal labor, while state political shifts every 2–4 years can rapidly change operating economics.
- 50 states: varied incentives
- WIOA ≈ $3.3B/year workforce funds
- Zoning/permitting → modernization delays
- Election cycles (2–4 yrs) alter economics
Federal farm policy, tariffs and Buy American squeeze cans, exports and logistics
Federal farm bills, USDA programs and crop-insurance subsidies (≈60% premium support) materially affect Seneca’s raw-material costs and acreage signals. Tariffs (including 25% Section 232 steel) and past retaliatory measures have raised can and export costs. Buy American in NSLP (≈29M students) and USMCA shape demand and standards; infrastructure (BIL $1.2T) and ATA driver shortfall (~80,000) constrain logistics.
| Factor | Key data |
|---|---|
| NSLP reach | ≈29M students |
| BIL | $1.2T |
| Driver shortfall (ATA) | ~80,000 |
| WIOA funding | ≈$3.3B/yr |
What is included in the product
 Detailed Word Document
Explores how Political, Economic, Social, Technological, Environmental, and Legal factors uniquely affect Seneca Foods, with data-backed insights reflecting current market and regulatory dynamics; designed to help executives and investors identify risks, opportunities, and forward-looking scenarios for strategy and planning.

 Customizable Excel Spreadsheet
A clean, visually segmented Seneca Foods PESTLE summary that relieves briefing pain points by providing editable, shareable insights for quick alignment, meeting slides, and strategic risk discussions.
Economic factors

Commodity and input inflation
Rising input costs drive Seneca Foods COGS: steel/aluminum can prices were about 12% higher YoY in 2024, packaging resins averaged ~6% below their 2022 peak but remain volatile, and energy costs stayed ~8% above pre‑pandemic levels. Agricultural yield swings can move raw produce prices by roughly ±30% seasonally. Private‑label pass‑throughs typically lag 2–4 quarters, so margin management relies on procurement timing and hedging to protect several hundred basis points.
Consumer demand cycles
Canned and frozen lines tend to outperform in downturns as value options, supporting resilience in Seneca Foods’ core categories while private-label penetration in US grocery rose to about 17% in 2023, increasing price sensitivity in that channel. During expansions, premium fresh alternatives pressure canned/frozen volume mix as consumers trade up. Foodservice recovery—US restaurant sales near $997 billion in 2023—boosts bulk and ingredient demand. Elasticity is higher in private label than branded lines, compressing margins.

Labor availability and wages
Seasonal processing for Seneca Foods relies on flexible rural labor pools during harvest peaks, pressuring staffing across its US plant network; Seneca reported roughly $1.7 billion in net sales in FY2024, underscoring scale exposure. Tight labor markets have pushed wages and overtime, raising unit costs and compressing margins. Persistent wage inflation improves automation ROI, accelerating capital spend on mechanization. Changes in immigration and H-2A policy materially affect field and plant labor supply.

Retailer bargaining power
Large grocers and club stores (top four account for roughly 40% of US grocery sales per FMI 2024) exert strong price and slotting pressure on Seneca, especially for private-label lines; consolidation has intensified terms and chargebacks, squeezing margins. Long-term contracts secure volume but limit upside pricing. Differentiation via quality and service remains Seneca’s primary leverage in negotiations.
- Grocer concentration: ~40% (FMI 2024)
- Private-label pressure: higher slotting/discounts
- Consolidation: increased chargebacks and tougher terms
- Contracts: volume stability, capped price upside
- Negotiation lever: product quality & service
FX and export pricing
Stronger USD (DXY ~103–107 in 2024) reduces Seneca Foods export competitiveness and import-substitute sales, pressuring margins; currency swings also affect foreign ingredient buyers' purchasing power. Hedging programs can stabilize reported earnings but introduce premium and administrative costs. Broadening export markets lowers FX concentration risk.
- Stronger USD: lower export margins
- Ingredient buyers: demand sensitive to FX
- Hedging: smoother earnings, added cost
- Diversification: reduces FX concentration
Federal farm policy, tariffs and Buy American squeeze cans, exports and logistics
Rising input and energy costs (+12% cans/aluminum YoY 2024; energy ~+8% vs pre‑pandemic) squeeze margins while seasonal crop swings (±30%) drive raw material volatility. Private‑label pressure (17% US grocery 2023) and top‑4 grocer concentration (~40% FMI 2024) compress pricing power. Strong USD (DXY 103–107 in 2024) and tight labor raise costs, boosting automation capex.
| Metric | Value |
|---|---|
| FY2024 Net Sales | $1.7B |
| Can/Aluminum YoY 2024 | +12% |
| Private‑label US 2023 | 17% |
| DXY 2024 | 103–107 |
Preview the Actual Deliverable
Seneca Foods PESTLE Analysis
The Seneca Foods PESTLE Analysis preview shown here is the exact document you’ll receive after purchase—fully formatted and ready to use. This real snapshot reflects the final content, layout, and structure with no placeholders. After payment you’ll instantly download the same professional, ready-to-use file.

Original: $10.00
-65%$10.00
$3.50Product Information
Product Information
Shipping & Returns
Shipping & Returns
Description
Your Competitive Advantage Starts with This Report
Our PESTLE Analysis for Seneca Foods maps political, economic, social, technological, legal and environmental forces shaping its supply chains and margins, highlighting regulatory risks, shifting consumer trends and sustainability pressures. Use these insights to anticipate disruptions, spot growth levers, and sharpen strategy. Purchase the full report to access the complete, actionable breakdown instantly.
Political factors
US ag policy subsidies
US farm bills (five-year cycles; 2018–2023 covered most recent period) and USDA programs materially shape economics for vegetables and fruits Seneca Foods processes, affecting price signals and acreage. Federal crop insurance typically subsidizes roughly 60% of premiums, influencing growers’ planting and contract commitments. Changes in subsidy structure or reauthorization timing can shift raw-material costs and supply reliability, so monitoring cycles is critical.
Trade tariffs and export access
Tariffs on canned and frozen produce and a 25% US Section 232 steel tariff raise Seneca’s can input costs and weaken export competitiveness, pressuring margins.
Retaliatory measures from China and the EU in 2018–19 showed how quickly market access can be disrupted in key regions.
USMCA (effective 2020) and bilateral trade deals shape labeling and sanitary standards, and ongoing volatility makes hedging international sales and FX exposure essential.
Buy American and procurement
Buy American mandates in nutrition programs such as the National School Lunch Program, which serves about 29 million students daily, can lift demand for US-packed products and benefit Seneca Foods’ institutional channels. Government procurement policies favoring domestic processors require strict origin certification and documentation to qualify for contracts. Political shifts at federal and state levels can materially tighten or relax these requirements, affecting bid opportunities and volumes.
Infrastructure and logistics funding
Public investment under the 2021 Bipartisan Infrastructure Law (roughly $1.2 trillion) affects Seneca Foods by improving roads, rail, and port capacity for inbound crops and outbound goods; reliability spikes during seasonal harvests when regional transport is critical. Trucking availability is pressured by an American Trucking Associations estimated driver shortfall of about 80,000, increasing lead times and costs when congestion or underinvestment occur.
- Infrastructure spend: $1.2 trillion
- Driver shortfall: ~80,000 (ATA)
- Seasonal sensitivity: higher lead times/costs
State-level incentives and zoning
State-level incentives and zoning affect Seneca Foods operations: 50 states offer varied tax credits/grants and local zoning/permitting can delay plant modernization timelines by months; workforce training funds such as WIOA (roughly $3.3B annual federal program) can subsidize seasonal labor, while state political shifts every 2–4 years can rapidly change operating economics.
- 50 states: varied incentives
- WIOA ≈ $3.3B/year workforce funds
- Zoning/permitting → modernization delays
- Election cycles (2–4 yrs) alter economics
Federal farm policy, tariffs and Buy American squeeze cans, exports and logistics
Federal farm bills, USDA programs and crop-insurance subsidies (≈60% premium support) materially affect Seneca’s raw-material costs and acreage signals. Tariffs (including 25% Section 232 steel) and past retaliatory measures have raised can and export costs. Buy American in NSLP (≈29M students) and USMCA shape demand and standards; infrastructure (BIL $1.2T) and ATA driver shortfall (~80,000) constrain logistics.
| Factor | Key data |
|---|---|
| NSLP reach | ≈29M students |
| BIL | $1.2T |
| Driver shortfall (ATA) | ~80,000 |
| WIOA funding | ≈$3.3B/yr |
What is included in the product
Detailed Word Document
Explores how Political, Economic, Social, Technological, Environmental, and Legal factors uniquely affect Seneca Foods, with data-backed insights reflecting current market and regulatory dynamics; designed to help executives and investors identify risks, opportunities, and forward-looking scenarios for strategy and planning.
Customizable Excel Spreadsheet
A clean, visually segmented Seneca Foods PESTLE summary that relieves briefing pain points by providing editable, shareable insights for quick alignment, meeting slides, and strategic risk discussions.
Economic factors
Commodity and input inflation
Rising input costs drive Seneca Foods COGS: steel/aluminum can prices were about 12% higher YoY in 2024, packaging resins averaged ~6% below their 2022 peak but remain volatile, and energy costs stayed ~8% above pre‑pandemic levels. Agricultural yield swings can move raw produce prices by roughly ±30% seasonally. Private‑label pass‑throughs typically lag 2–4 quarters, so margin management relies on procurement timing and hedging to protect several hundred basis points.
Consumer demand cycles
Canned and frozen lines tend to outperform in downturns as value options, supporting resilience in Seneca Foods’ core categories while private-label penetration in US grocery rose to about 17% in 2023, increasing price sensitivity in that channel. During expansions, premium fresh alternatives pressure canned/frozen volume mix as consumers trade up. Foodservice recovery—US restaurant sales near $997 billion in 2023—boosts bulk and ingredient demand. Elasticity is higher in private label than branded lines, compressing margins.
Labor availability and wages
Seasonal processing for Seneca Foods relies on flexible rural labor pools during harvest peaks, pressuring staffing across its US plant network; Seneca reported roughly $1.7 billion in net sales in FY2024, underscoring scale exposure. Tight labor markets have pushed wages and overtime, raising unit costs and compressing margins. Persistent wage inflation improves automation ROI, accelerating capital spend on mechanization. Changes in immigration and H-2A policy materially affect field and plant labor supply.
Retailer bargaining power
Large grocers and club stores (top four account for roughly 40% of US grocery sales per FMI 2024) exert strong price and slotting pressure on Seneca, especially for private-label lines; consolidation has intensified terms and chargebacks, squeezing margins. Long-term contracts secure volume but limit upside pricing. Differentiation via quality and service remains Seneca’s primary leverage in negotiations.
- Grocer concentration: ~40% (FMI 2024)
- Private-label pressure: higher slotting/discounts
- Consolidation: increased chargebacks and tougher terms
- Contracts: volume stability, capped price upside
- Negotiation lever: product quality & service
FX and export pricing
Stronger USD (DXY ~103–107 in 2024) reduces Seneca Foods export competitiveness and import-substitute sales, pressuring margins; currency swings also affect foreign ingredient buyers' purchasing power. Hedging programs can stabilize reported earnings but introduce premium and administrative costs. Broadening export markets lowers FX concentration risk.
- Stronger USD: lower export margins
- Ingredient buyers: demand sensitive to FX
- Hedging: smoother earnings, added cost
- Diversification: reduces FX concentration
Federal farm policy, tariffs and Buy American squeeze cans, exports and logistics
Rising input and energy costs (+12% cans/aluminum YoY 2024; energy ~+8% vs pre‑pandemic) squeeze margins while seasonal crop swings (±30%) drive raw material volatility. Private‑label pressure (17% US grocery 2023) and top‑4 grocer concentration (~40% FMI 2024) compress pricing power. Strong USD (DXY 103–107 in 2024) and tight labor raise costs, boosting automation capex.
| Metric | Value |
|---|---|
| FY2024 Net Sales | $1.7B |
| Can/Aluminum YoY 2024 | +12% |
| Private‑label US 2023 | 17% |
| DXY 2024 | 103–107 |
Preview the Actual Deliverable
Seneca Foods PESTLE Analysis
The Seneca Foods PESTLE Analysis preview shown here is the exact document you’ll receive after purchase—fully formatted and ready to use. This real snapshot reflects the final content, layout, and structure with no placeholders. After payment you’ll instantly download the same professional, ready-to-use file.











