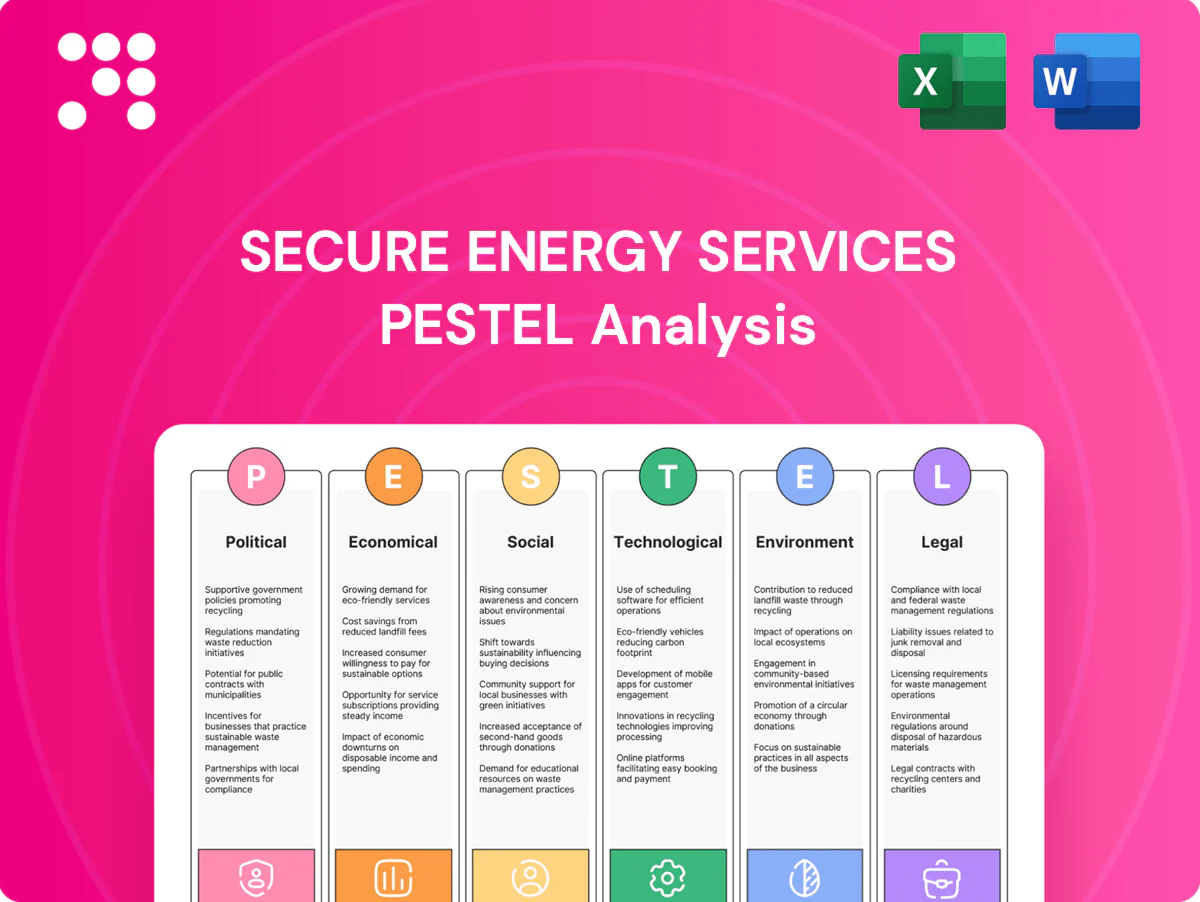
Secure Energy Services PESTLE Analysis

Your Competitive Advantage Starts with This Report
Discover how political shifts, market cycles, and environmental regulations are reshaping Secure Energy Services' outlook in our concise PESTLE snapshot—designed for investors and strategists who need clarity fast. Buy the full PESTLE analysis to unlock detailed risks, opportunities, and actionable recommendations ready for immediate use.
Political factors

Federal-provincial energy policy alignment
Shifts between federal climate priorities and provincial resource agendas shape permitting, incentives and operating constraints for firms like Secure Energy; Canada’s carbon price reached $80/tonne in 2024 while pipeline debates (eg Trans Mountain cost CAD 30.9B in 2023) show real impacts. Policy misalignment can delay projects and add compliance complexity; harmonized frameworks accelerate infrastructure roll‑out and cut regulatory friction. Monitoring policy signals helps sequence capital to provinces with stable support.
Indigenous rights and consultation
Duty-to-consult obligations materially shape timelines for pipelines, terminals and disposal sites in Canada, where Indigenous peoples represent about 5.0% of the population (2021 Census); projects such as Coastal GasLink (≈CAD 6.6B) illustrate both consultation conflicts and continuity risks. Early, meaningful engagement can secure social license and reduce legal risk, while partnership models and benefit agreements have measurably improved project resilience. Inadequate consultation has triggered delays, cost overruns and cancellations on multiple large-scale energy projects.

Cross-border trade and US relations
Waste and fluids logistics for Secure Energy mirror North American oil flows, with Canada shipping about 3.8 million barrels per day to the US in 2024 and roughly 99% of Canadian crude exports headed south, so pipeline capacity (Enbridge Mainline ~2.85 mbpd) directly affects volumes and pricing.

Infrastructure permitting and local governance
Municipal and regional authorities in Alberta and Saskatchewan directly control siting, zoning and allowable operating hours for Secure Energy Services facilities, often imposing conditions that affect throughput and cost recovery. Fragmented approval processes across municipalities and Indigenous jurisdictions commonly extend lead times by months to over a year, increasing carrying costs and capital tie-up. Proactive stakeholder engagement and signed community benefit agreements have shortened approvals in some cases, while political turnover at municipal councils can reset priorities mid-project and require rework.
- Regulatory control: municipal zoning, bylaws, Indigenous consultation
- Delay impact: approvals often add months–>1+ year to timelines
- Mitigation: proactive stakeholder management and benefit agreements
- Risk: political turnover can reset project conditions
Public investment and incentives
Carbon-price and pipeline politics heighten permitting risk and push investment to emissions tech
Federal-provincial policy mismatch (Canada carbon price CAD80/t in 2024) and pipeline politics (Trans Mountain CAD30.9B) drive permitting risk and costs for Secure Energy. Indigenous duty-to-consult (Indigenous ~5.0% pop, 2021) and municipal zoning extend timelines. Cross-border flows (3.8 mbpd to US, 2024) and US IRA (US$369B) shift investment toward emissions tech.
| Policy | Key stat | Impact |
|---|---|---|
| Carbon pricing | CAD80/t (2024) | Higher compliance costs |
| Pipelines | CAD30.9B TM (2023) | Permitting delays |
What is included in the product
 Detailed Word Document
Explores how macro-environmental factors uniquely affect Secure Energy Services across Political, Economic, Social, Technological, Environmental and Legal dimensions, with data-driven insights, region- and industry-specific examples, forward-looking implications, and actionable points to aid executives, investors and strategists.

 Customizable Excel Spreadsheet
A concise, visually segmented PESTLE of Secure Energy Services that distills regulatory, economic, social and technological risks into a one-page reference, easing meeting prep and stakeholder alignment; editable notes and plain language make it instantly shareable and actionable across teams.
Economic factors

Oil and gas activity cycles
Service demand for waste and fluids closely tracks drilling, completions and production, with Secure Energy Services’ volumes tied to Canadian onshore activity; WTI averaged in the mid-70s USD/bbl in 2024, driving visible throughput swings. Price volatility in crude and gas continues to move facility utilization quickly. Countercyclical and take-or-pay arrangements provide cash-flow stability. Diversification across Alberta, Saskatchewan and BC lessens single-region risk.
Inflation and input costs
Rising energy, chemicals, steel and trucking costs directly pressure Secure Energy Services margins in processing and logistics; WTI averaged about 78.5 USD/bbl in 2024 and US diesel averaged ~3.89 USD/gal, while Canada CPI averaged ~2.8% in 2024. Index-linked pricing and fuel surcharges enable partial pass-through. Efficiency gains and automation reduce labor and consumables exposure. Persistent cost inflation compresses spreads when contracts lag.

Interest rates and capital intensity
Disposal wells, pipelines and terminals demand significant upfront capex, typically exceeding C$100m for mid‑scale projects and often reaching C$500m+ for larger builds, so policy rates matter; with policy rates around 5.25–5.50% (mid‑2025 US Fed target range) higher discount rates raise hurdle returns and slow expansion. Strong balance sheets and long‑term contracts improve financing terms and reduce cost of capital, while rate cuts reopen project backlogs and increase M&A optionality.

Currency fluctuations (CAD/USD)
Currency fluctuations between CAD and USD materially affect Secure Energy Services: revenue, equipment purchases and US-dollar debt can be mismatched, so a stronger USD can improve export competitiveness while raising import and capex costs; as of July 2025 CAD trades around 0.74–0.76 USD, amplifying these effects.
- Revenue exposure: CAD/USD sensitivity
- Costs: higher USD lifts import & equipment costs
- Debt: USD-denominated liabilities raise FX risk
- Mitigation: hedging reduces earnings volatility
- Strategy: geographic mix planning balances risk
Industry consolidation and credit quality
Customer consolidation concentrates bargaining power, pressuring pricing and fee structures for Secure Energy Services; the top producers now represent roughly half of Canadian crude output, intensifying contract negotiation dynamics. Stronger counterparties reduce bad-debt risk and enable longer payment tenors, improving working capital; downturns raise bankruptcy risk for smaller producers and can cut volumes sharply. Strategic M&A boosts network density and utilization, lifting margin resilience.
- consolidation: top producers ≈50% share
- credit: stronger counterparties → lower bad-debt, longer tenors
- downturn risk: smaller producers ↑ bankruptcy, ↓ volumes
- M&A: increases network density and utilization
Carbon-price and pipeline politics heighten permitting risk and push investment to emissions tech
Demand tracks Canadian drilling and production; WTI averaged ~78.5 USD/bbl in 2024 driving throughput swings. Policy rates ~5.25–5.50% (mid‑2025) raise capex hurdles; CAD ~0.74–0.76 USD (Jul 2025) shifts capex and revenue mixes. Top producers account for ~50% of Canadian crude, concentrating pricing power and contract risk.
| Metric | Value |
|---|---|
| WTI 2024 | ~78.5 USD/bbl |
| US diesel 2024 | ~3.89 USD/gal |
| Canada CPI 2024 | ~2.8% |
| Policy rate mid‑2025 | 5.25–5.50% |
| CAD/USD Jul 2025 | 0.74–0.76 |
| Top producers share | ~50% |
What You See Is What You Get
Secure Energy Services PESTLE Analysis
The Secure Energy Services PESTLE Analysis shown here is the exact, fully formatted document you’ll receive after purchase. This preview reflects the real file—no placeholders or teasers—and is delivered exactly as displayed. The content, layout, and structure are finalized and ready to download immediately after payment. What you see here is what you’ll own and use.

Original: $10.00
-65%$10.00
$3.50Product Information
Product Information
Shipping & Returns
Shipping & Returns
Description
Your Competitive Advantage Starts with This Report
Discover how political shifts, market cycles, and environmental regulations are reshaping Secure Energy Services' outlook in our concise PESTLE snapshot—designed for investors and strategists who need clarity fast. Buy the full PESTLE analysis to unlock detailed risks, opportunities, and actionable recommendations ready for immediate use.
Political factors
Federal-provincial energy policy alignment
Shifts between federal climate priorities and provincial resource agendas shape permitting, incentives and operating constraints for firms like Secure Energy; Canada’s carbon price reached $80/tonne in 2024 while pipeline debates (eg Trans Mountain cost CAD 30.9B in 2023) show real impacts. Policy misalignment can delay projects and add compliance complexity; harmonized frameworks accelerate infrastructure roll‑out and cut regulatory friction. Monitoring policy signals helps sequence capital to provinces with stable support.
Indigenous rights and consultation
Duty-to-consult obligations materially shape timelines for pipelines, terminals and disposal sites in Canada, where Indigenous peoples represent about 5.0% of the population (2021 Census); projects such as Coastal GasLink (≈CAD 6.6B) illustrate both consultation conflicts and continuity risks. Early, meaningful engagement can secure social license and reduce legal risk, while partnership models and benefit agreements have measurably improved project resilience. Inadequate consultation has triggered delays, cost overruns and cancellations on multiple large-scale energy projects.
Cross-border trade and US relations
Waste and fluids logistics for Secure Energy mirror North American oil flows, with Canada shipping about 3.8 million barrels per day to the US in 2024 and roughly 99% of Canadian crude exports headed south, so pipeline capacity (Enbridge Mainline ~2.85 mbpd) directly affects volumes and pricing.
Infrastructure permitting and local governance
Municipal and regional authorities in Alberta and Saskatchewan directly control siting, zoning and allowable operating hours for Secure Energy Services facilities, often imposing conditions that affect throughput and cost recovery. Fragmented approval processes across municipalities and Indigenous jurisdictions commonly extend lead times by months to over a year, increasing carrying costs and capital tie-up. Proactive stakeholder engagement and signed community benefit agreements have shortened approvals in some cases, while political turnover at municipal councils can reset priorities mid-project and require rework.
- Regulatory control: municipal zoning, bylaws, Indigenous consultation
- Delay impact: approvals often add months–>1+ year to timelines
- Mitigation: proactive stakeholder management and benefit agreements
- Risk: political turnover can reset project conditions
Public investment and incentives
Carbon-price and pipeline politics heighten permitting risk and push investment to emissions tech
Federal-provincial policy mismatch (Canada carbon price CAD80/t in 2024) and pipeline politics (Trans Mountain CAD30.9B) drive permitting risk and costs for Secure Energy. Indigenous duty-to-consult (Indigenous ~5.0% pop, 2021) and municipal zoning extend timelines. Cross-border flows (3.8 mbpd to US, 2024) and US IRA (US$369B) shift investment toward emissions tech.
| Policy | Key stat | Impact |
|---|---|---|
| Carbon pricing | CAD80/t (2024) | Higher compliance costs |
| Pipelines | CAD30.9B TM (2023) | Permitting delays |
What is included in the product
Detailed Word Document
Explores how macro-environmental factors uniquely affect Secure Energy Services across Political, Economic, Social, Technological, Environmental and Legal dimensions, with data-driven insights, region- and industry-specific examples, forward-looking implications, and actionable points to aid executives, investors and strategists.
Customizable Excel Spreadsheet
A concise, visually segmented PESTLE of Secure Energy Services that distills regulatory, economic, social and technological risks into a one-page reference, easing meeting prep and stakeholder alignment; editable notes and plain language make it instantly shareable and actionable across teams.
Economic factors
Oil and gas activity cycles
Service demand for waste and fluids closely tracks drilling, completions and production, with Secure Energy Services’ volumes tied to Canadian onshore activity; WTI averaged in the mid-70s USD/bbl in 2024, driving visible throughput swings. Price volatility in crude and gas continues to move facility utilization quickly. Countercyclical and take-or-pay arrangements provide cash-flow stability. Diversification across Alberta, Saskatchewan and BC lessens single-region risk.
Inflation and input costs
Rising energy, chemicals, steel and trucking costs directly pressure Secure Energy Services margins in processing and logistics; WTI averaged about 78.5 USD/bbl in 2024 and US diesel averaged ~3.89 USD/gal, while Canada CPI averaged ~2.8% in 2024. Index-linked pricing and fuel surcharges enable partial pass-through. Efficiency gains and automation reduce labor and consumables exposure. Persistent cost inflation compresses spreads when contracts lag.
Interest rates and capital intensity
Disposal wells, pipelines and terminals demand significant upfront capex, typically exceeding C$100m for mid‑scale projects and often reaching C$500m+ for larger builds, so policy rates matter; with policy rates around 5.25–5.50% (mid‑2025 US Fed target range) higher discount rates raise hurdle returns and slow expansion. Strong balance sheets and long‑term contracts improve financing terms and reduce cost of capital, while rate cuts reopen project backlogs and increase M&A optionality.
Currency fluctuations (CAD/USD)
Currency fluctuations between CAD and USD materially affect Secure Energy Services: revenue, equipment purchases and US-dollar debt can be mismatched, so a stronger USD can improve export competitiveness while raising import and capex costs; as of July 2025 CAD trades around 0.74–0.76 USD, amplifying these effects.
- Revenue exposure: CAD/USD sensitivity
- Costs: higher USD lifts import & equipment costs
- Debt: USD-denominated liabilities raise FX risk
- Mitigation: hedging reduces earnings volatility
- Strategy: geographic mix planning balances risk
Industry consolidation and credit quality
Customer consolidation concentrates bargaining power, pressuring pricing and fee structures for Secure Energy Services; the top producers now represent roughly half of Canadian crude output, intensifying contract negotiation dynamics. Stronger counterparties reduce bad-debt risk and enable longer payment tenors, improving working capital; downturns raise bankruptcy risk for smaller producers and can cut volumes sharply. Strategic M&A boosts network density and utilization, lifting margin resilience.
- consolidation: top producers ≈50% share
- credit: stronger counterparties → lower bad-debt, longer tenors
- downturn risk: smaller producers ↑ bankruptcy, ↓ volumes
- M&A: increases network density and utilization
Carbon-price and pipeline politics heighten permitting risk and push investment to emissions tech
Demand tracks Canadian drilling and production; WTI averaged ~78.5 USD/bbl in 2024 driving throughput swings. Policy rates ~5.25–5.50% (mid‑2025) raise capex hurdles; CAD ~0.74–0.76 USD (Jul 2025) shifts capex and revenue mixes. Top producers account for ~50% of Canadian crude, concentrating pricing power and contract risk.
| Metric | Value |
|---|---|
| WTI 2024 | ~78.5 USD/bbl |
| US diesel 2024 | ~3.89 USD/gal |
| Canada CPI 2024 | ~2.8% |
| Policy rate mid‑2025 | 5.25–5.50% |
| CAD/USD Jul 2025 | 0.74–0.76 |
| Top producers share | ~50% |
What You See Is What You Get
Secure Energy Services PESTLE Analysis
The Secure Energy Services PESTLE Analysis shown here is the exact, fully formatted document you’ll receive after purchase. This preview reflects the real file—no placeholders or teasers—and is delivered exactly as displayed. The content, layout, and structure are finalized and ready to download immediately after payment. What you see here is what you’ll own and use.











