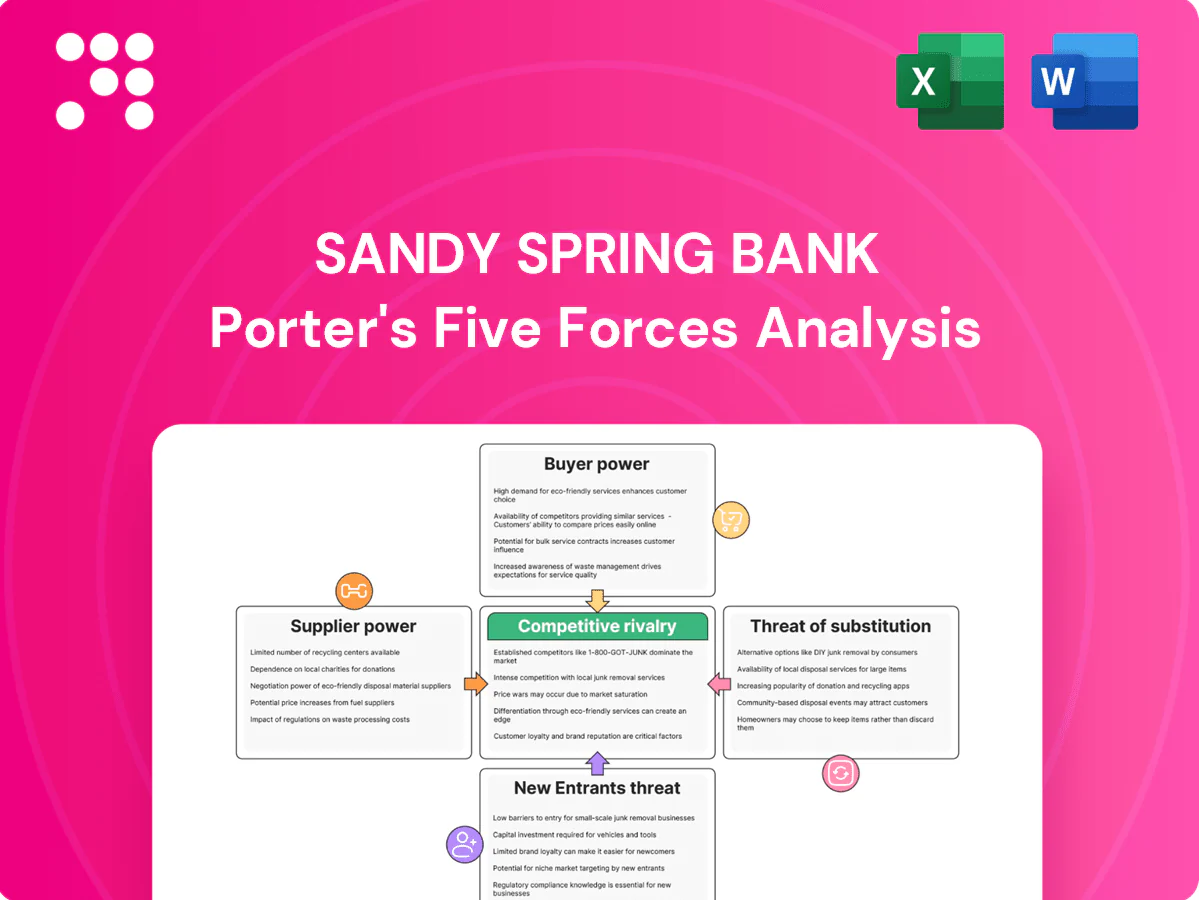
Sandy Spring Bank Porter's Five Forces Analysis

Go Beyond the Preview—Access the Full Strategic Report
Sandy Spring Bank faces moderate buyer power, rising fintech competition, regulatory pressures, supplier stability, and regionally framed barriers to new entrants. Competitive rivalry intensifies as scale-driven peers and digital challengers press on margins and innovation. This brief snapshot only scratches the surface. Unlock the full Porter's Five Forces Analysis to explore Sandy Spring Bank’s competitive dynamics, market pressures, and strategic advantages in detail.
Suppliers Bargaining Power

Core tech vendor dependence
Sandy Spring Bank relies on a small set of core banking and digital platform providers, concentrating supplier leverage and raising dependency risk. Industry data in 2024 shows core migrations typically cost $20–50 million and take 18–36 months, making switching costly and risky. Vendors can therefore shape pricing, product roadmaps, and integration timelines, though strict contract terms and regulatory scrutiny (including OCC guidance) partially constrain this power.
Funding mix sensitivity
Depositors and wholesale markets are the bank’s primary funding suppliers; concentration in commercial or municipal deposit buckets and reliance on brokered deposits or FHLB advances can lift funding costs and volatility. In rising-rate cycles suppliers push yields higher, compressing margins. A larger base of relationship deposits dampens supplier bargaining power and stabilizes funding.

Payments network tolls
Card associations and ACH networks impose largely non-negotiable fee schedules, with Visa and Mastercard handling roughly 80% of U.S. card volume and NACHA processing ~32.5 billion ACH entries in 2023, giving scale players better economics and squeezing community banks. Network rules limit product design and pricing, and mandatory participation keeps supplier leverage high.

Skilled labor & compliance
Experienced bankers and risk/compliance talent in the D.C. metro commanded notable premiums in 2024 as the region's labor market tightened, contributing to above-national wage pressure and elevated hiring costs for Sandy Spring Bank. Loss of key producers can materially slow loan growth and weaken client relationships, while internal training pipelines and a retention-focused culture mitigate supplier power and turnover risk.
- 2024 labor squeeze: regional unemployment remained below national average
- Premiums: talent costs up, pressuring margins
- Key-producer risk: impacts growth and relationships
- Mitigation: training pipelines and retention culture
Data & analytics providers
Data & analytics providers such as the three national credit bureaus (Experian, Equifax, TransUnion) control roughly 90% of US consumer credit files; specialized KYC and fraud vendors are few and their scoring tools are embedded in Sandy Spring Bank’s underwriting and onboarding workflows. Pricing power has risen with tighter KYC/AML rules and elevated fraud risk in 2023–24, increasing vendor leverage. Sandy Spring mitigates exposure via multi‑vendor strategies and strong contracts.
- Concentration: credit bureaus ~90%
- Role: embedded in underwriting/onboarding
- Risk: pricing up with regulatory/fraud pressure
- Mitigation: multi‑vendor + contractual SLAs
Vendor concentration: switching costs $20–50M, migrations 18–36 months
Reliance on core banking vendors makes switching costly ($20–50M) and slow (18–36 months), concentrating supplier leverage. Funding suppliers—concentrated deposits, brokered/FHLB reliance—raise funding cost volatility in rising-rate cycles; relationship deposits reduce that power. Card networks (~80% U.S. volume), credit bureaus (~90% share) and 2024 regional talent premiums further constrain margins; mitigants include multi‑vendor strategies and retention.
| Metric | Value |
|---|---|
| Core migration cost | $20–50M |
| Core migration time | 18–36 months |
| Card network share | ~80% |
| ACH entries (2023) | 32.5B |
| Credit bureaus share | ~90% |
| Regional unemployment (2024) | below national avg |
What is included in the product
 Detailed Word Document
Tailored Porter's Five Forces for Sandy Spring Bank, assessing competitive rivalry, buyer and supplier power, entry barriers, substitutes, and disruptive threats to its market position and profitability.

 Customizable Excel Spreadsheet
One-sheet Porter's Five Forces for Sandy Spring Bank—quickly visualizes competitive pressure with a customizable spider chart so teams can swap in current data, tailor scenarios (regulatory shifts or new entrants), and drop directly into pitch decks without macros or complex setup.
Customers Bargaining Power

Rate-sensitive depositors
Rate-sensitive depositors can shop rates across banks and fintechs instantly; with the federal funds target at 5.25–5.50% in 2024, many online platforms offered high-yield APYs, raising pressure on margins. In higher-rate environments customers demand better yields or move funds, elevating funding costs and churn risk. Strong relationship bundles and superior service can blunt this sensitivity and reduce attrition.
Large commercial clients
Middle-market and commercial real estate borrowers routinely negotiate pricing, covenants and ancillary-service concessions, leveraging Sandy Spring Bank’s roughly $12 billion balance sheet to extract favorable terms. Their large balances materially influence portfolio yields and deposit stickiness, with CRE and commercial loans often representing a meaningful share of commercial lending. Ready competitor alternatives increase borrower negotiating power and compress margins.

Digital expectations
Buyers expect seamless mobile apps, real-time payments and robust self-service, with roughly 80% of US consumers using mobile banking in 2024, raising switching risk for Sandy Spring if feature gaps versus national peers persist. Feature parity pressures fee income and net interest spread as competitors undercut pricing with digital convenience. Continuous UX investment and faster payments integration reduce buyer power by lowering churn and fee sensitivity.

Wealth management fee pressure
Wealth management clients increasingly compare advisory fees to robo and ETF solutions—average robo fees were about 0.25% in 2024 while Cerulli reported median human-advised fees near 0.85% in 2024, putting transparent pricing pressure on Sandy Spring Bank and compressing margins. Demonstrable performance, tax and holistic planning can justify higher fees, and tiered pricing structures help retain clients and lower attrition.
- fee-comparison: robo 0.25% vs median WM 0.85% (2024)
- transparency: margin compression risk
- value-drivers: performance, holistic planning
- mitigation: tiered pricing reduces attrition
Multi-homing behavior
Households and SMBs commonly multi-home, with 2024 industry surveys showing consumers hold around 2.5 banking relationships on average; this dilutes Sandy Spring Bank wallet share and drives deal-by-deal price checks. Multi-homing makes cross-sell harder and raises buyer leverage, forcing higher acquisition and retention spend. Deepening primary relationships via tailored offers and service stickiness is key to regain pricing power.
- average banking relationships ~2.5 (2024)
- multi-homing reduces wallet share and boosts price sensitivity
- priority: deepen primary relationship to improve cross-sell and margins
Rate shock and digital demand squeeze bank margins: deposit flight, fee compression
Customers exert strong bargaining power: rate-sensitive depositors shift to high-yield platforms in a 5.25–5.50% Fed-rate environment (2024), pressuring margins; Sandy Spring’s ~$12B balance sheet faces negotiated loan terms from CRE/commercial clients. Digital expectations (80% mobile use) and fee compression (robo 0.25% vs human 0.85% in 2024) raise churn and pricing pressure.
| Metric | 2024 |
|---|---|
| Fed target | 5.25–5.50% |
| Balance sheet | $12B |
| Mobile use | 80% |
| Robo vs WM fees | 0.25% vs 0.85% |
| Banking relationships | 2.5 |
What You See Is What You Get
Sandy Spring Bank Porter's Five Forces Analysis
This preview is the exact Sandy Spring Bank Porter's Five Forces Analysis you'll receive after purchase—no placeholders or samples. The full, professionally formatted document is ready for immediate download and use. It contains in-depth force-by-force evaluation, conclusions and strategic implications to inform decision-making.

Original: $10.00
-65%$10.00
$3.50Product Information
Product Information
Shipping & Returns
Shipping & Returns
Description
Go Beyond the Preview—Access the Full Strategic Report
Sandy Spring Bank faces moderate buyer power, rising fintech competition, regulatory pressures, supplier stability, and regionally framed barriers to new entrants. Competitive rivalry intensifies as scale-driven peers and digital challengers press on margins and innovation. This brief snapshot only scratches the surface. Unlock the full Porter's Five Forces Analysis to explore Sandy Spring Bank’s competitive dynamics, market pressures, and strategic advantages in detail.
Suppliers Bargaining Power
Core tech vendor dependence
Sandy Spring Bank relies on a small set of core banking and digital platform providers, concentrating supplier leverage and raising dependency risk. Industry data in 2024 shows core migrations typically cost $20–50 million and take 18–36 months, making switching costly and risky. Vendors can therefore shape pricing, product roadmaps, and integration timelines, though strict contract terms and regulatory scrutiny (including OCC guidance) partially constrain this power.
Funding mix sensitivity
Depositors and wholesale markets are the bank’s primary funding suppliers; concentration in commercial or municipal deposit buckets and reliance on brokered deposits or FHLB advances can lift funding costs and volatility. In rising-rate cycles suppliers push yields higher, compressing margins. A larger base of relationship deposits dampens supplier bargaining power and stabilizes funding.
Payments network tolls
Card associations and ACH networks impose largely non-negotiable fee schedules, with Visa and Mastercard handling roughly 80% of U.S. card volume and NACHA processing ~32.5 billion ACH entries in 2023, giving scale players better economics and squeezing community banks. Network rules limit product design and pricing, and mandatory participation keeps supplier leverage high.
Skilled labor & compliance
Experienced bankers and risk/compliance talent in the D.C. metro commanded notable premiums in 2024 as the region's labor market tightened, contributing to above-national wage pressure and elevated hiring costs for Sandy Spring Bank. Loss of key producers can materially slow loan growth and weaken client relationships, while internal training pipelines and a retention-focused culture mitigate supplier power and turnover risk.
- 2024 labor squeeze: regional unemployment remained below national average
- Premiums: talent costs up, pressuring margins
- Key-producer risk: impacts growth and relationships
- Mitigation: training pipelines and retention culture
Data & analytics providers
Data & analytics providers such as the three national credit bureaus (Experian, Equifax, TransUnion) control roughly 90% of US consumer credit files; specialized KYC and fraud vendors are few and their scoring tools are embedded in Sandy Spring Bank’s underwriting and onboarding workflows. Pricing power has risen with tighter KYC/AML rules and elevated fraud risk in 2023–24, increasing vendor leverage. Sandy Spring mitigates exposure via multi‑vendor strategies and strong contracts.
- Concentration: credit bureaus ~90%
- Role: embedded in underwriting/onboarding
- Risk: pricing up with regulatory/fraud pressure
- Mitigation: multi‑vendor + contractual SLAs
Vendor concentration: switching costs $20–50M, migrations 18–36 months
Reliance on core banking vendors makes switching costly ($20–50M) and slow (18–36 months), concentrating supplier leverage. Funding suppliers—concentrated deposits, brokered/FHLB reliance—raise funding cost volatility in rising-rate cycles; relationship deposits reduce that power. Card networks (~80% U.S. volume), credit bureaus (~90% share) and 2024 regional talent premiums further constrain margins; mitigants include multi‑vendor strategies and retention.
| Metric | Value |
|---|---|
| Core migration cost | $20–50M |
| Core migration time | 18–36 months |
| Card network share | ~80% |
| ACH entries (2023) | 32.5B |
| Credit bureaus share | ~90% |
| Regional unemployment (2024) | below national avg |
What is included in the product
Detailed Word Document
Tailored Porter's Five Forces for Sandy Spring Bank, assessing competitive rivalry, buyer and supplier power, entry barriers, substitutes, and disruptive threats to its market position and profitability.
Customizable Excel Spreadsheet
One-sheet Porter's Five Forces for Sandy Spring Bank—quickly visualizes competitive pressure with a customizable spider chart so teams can swap in current data, tailor scenarios (regulatory shifts or new entrants), and drop directly into pitch decks without macros or complex setup.
Customers Bargaining Power
Rate-sensitive depositors
Rate-sensitive depositors can shop rates across banks and fintechs instantly; with the federal funds target at 5.25–5.50% in 2024, many online platforms offered high-yield APYs, raising pressure on margins. In higher-rate environments customers demand better yields or move funds, elevating funding costs and churn risk. Strong relationship bundles and superior service can blunt this sensitivity and reduce attrition.
Large commercial clients
Middle-market and commercial real estate borrowers routinely negotiate pricing, covenants and ancillary-service concessions, leveraging Sandy Spring Bank’s roughly $12 billion balance sheet to extract favorable terms. Their large balances materially influence portfolio yields and deposit stickiness, with CRE and commercial loans often representing a meaningful share of commercial lending. Ready competitor alternatives increase borrower negotiating power and compress margins.
Digital expectations
Buyers expect seamless mobile apps, real-time payments and robust self-service, with roughly 80% of US consumers using mobile banking in 2024, raising switching risk for Sandy Spring if feature gaps versus national peers persist. Feature parity pressures fee income and net interest spread as competitors undercut pricing with digital convenience. Continuous UX investment and faster payments integration reduce buyer power by lowering churn and fee sensitivity.
Wealth management fee pressure
Wealth management clients increasingly compare advisory fees to robo and ETF solutions—average robo fees were about 0.25% in 2024 while Cerulli reported median human-advised fees near 0.85% in 2024, putting transparent pricing pressure on Sandy Spring Bank and compressing margins. Demonstrable performance, tax and holistic planning can justify higher fees, and tiered pricing structures help retain clients and lower attrition.
- fee-comparison: robo 0.25% vs median WM 0.85% (2024)
- transparency: margin compression risk
- value-drivers: performance, holistic planning
- mitigation: tiered pricing reduces attrition
Multi-homing behavior
Households and SMBs commonly multi-home, with 2024 industry surveys showing consumers hold around 2.5 banking relationships on average; this dilutes Sandy Spring Bank wallet share and drives deal-by-deal price checks. Multi-homing makes cross-sell harder and raises buyer leverage, forcing higher acquisition and retention spend. Deepening primary relationships via tailored offers and service stickiness is key to regain pricing power.
- average banking relationships ~2.5 (2024)
- multi-homing reduces wallet share and boosts price sensitivity
- priority: deepen primary relationship to improve cross-sell and margins
Rate shock and digital demand squeeze bank margins: deposit flight, fee compression
Customers exert strong bargaining power: rate-sensitive depositors shift to high-yield platforms in a 5.25–5.50% Fed-rate environment (2024), pressuring margins; Sandy Spring’s ~$12B balance sheet faces negotiated loan terms from CRE/commercial clients. Digital expectations (80% mobile use) and fee compression (robo 0.25% vs human 0.85% in 2024) raise churn and pricing pressure.
| Metric | 2024 |
|---|---|
| Fed target | 5.25–5.50% |
| Balance sheet | $12B |
| Mobile use | 80% |
| Robo vs WM fees | 0.25% vs 0.85% |
| Banking relationships | 2.5 |
What You See Is What You Get
Sandy Spring Bank Porter's Five Forces Analysis
This preview is the exact Sandy Spring Bank Porter's Five Forces Analysis you'll receive after purchase—no placeholders or samples. The full, professionally formatted document is ready for immediate download and use. It contains in-depth force-by-force evaluation, conclusions and strategic implications to inform decision-making.