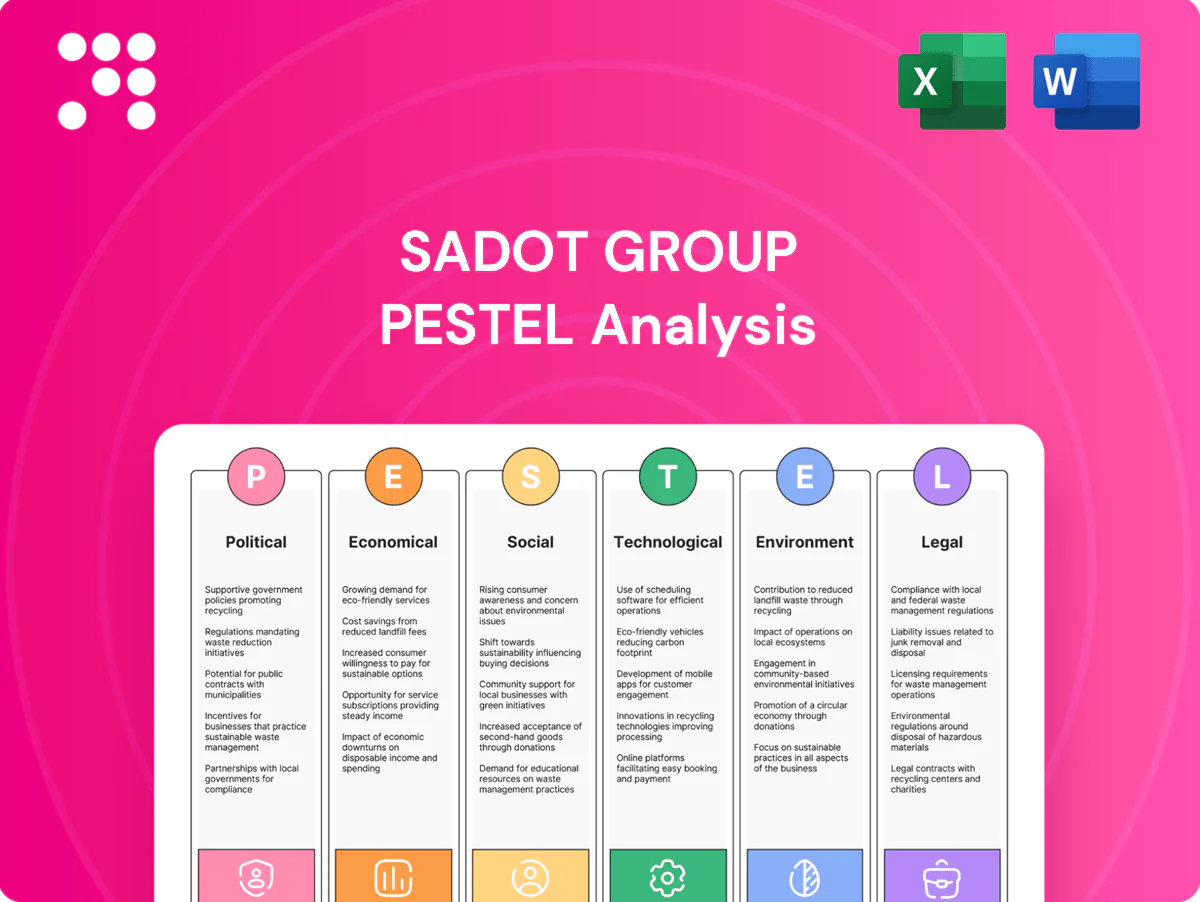
Sadot Group PESTLE Analysis

Skip the Research. Get the Strategy.
Gain a strategic edge with our PESTLE Analysis of Sadot Group—three to five actionable insights reveal how political shifts, economic forces, and tech trends will shape its future. This concise briefing flags regulatory risks, market opportunities, and environmental pressures. Purchase the full report for the complete, editable deep-dive and ready-to-use strategic intelligence.
Political factors

Trade policy volatility
Track how tariffs, export bans and quotas on grains in key origin and destination markets shift margins and logistical flows; Black Sea suppliers account for roughly 30% of global wheat exports, so corridor disruptions materially affect pricing. Assess exposure to geopolitical flashpoints across the Black Sea, Latin America and MENA and quantify scenario impacts on working capital and inventory positioning. Model stress cases to estimate buffer stock days and cash conversion swings, and build contingency sourcing plans with alternative ports and partner suppliers to preserve flow continuity.
Sanctions and geopolitics
Monitor evolving sanctions regimes that could restrict counterparties, vessels or payment channels, noting Russia and Ukraine supplied roughly 30% of global wheat exports pre-2022 and remain systemic suppliers. Evaluate compliance costs and rerouting needs when sanctioned regions are major grain sources, and quantify additional freight and insurance premiums. Stress-test contract enforceability under sudden political shifts and model cashflow impacts. Maintain diversified banking and insurance relationships to preserve trade finance access.

Food security policies
Anticipate state interventions—price controls, strategic reserves, subsidies—that can distort market signals; over 20 countries used export measures since 2022 and major producers such as India and Russia have prioritized domestic supply. Global cereal stocks-to-use were about 29% in 2024, so map markets likely to restrict exports. Align with government food security programs to secure volumes and factor policy-driven demand surges into procurement timing.

Infrastructure and port governance
Sadot Group must assess political control over ports, rail and customs since the World Bank LPI 2023 flags customs and infrastructure governance as primary throughput determinants; risks from strikes, regime shifts or corruption can sharply extend clearance times and reduce reliability, so include multi-port optionality clauses to reroute cargo and engage public–private dialogues to boost logistics transparency.
Agri-diplomacy and quotas
Sadot must align exports with bilateral agri-diplomacy quotas—global agricultural trade reached about $1.9 trillion in 2023—to capture tariff breaks that can shave off roughly 10–15 percentage points versus MFN rates. Structuring tenders around quota windows raises bidding success and margin capture. Active advocacy through industry bodies secures predictable quota administration and timely allocations.
- preferential-benefit: up to 10–15pp vs MFN
- trade-context: global agri trade ~$1.9T (2023)
- tender-strategy: align with quota windows
- advocacy: industry lobbying for predictable quotas
Model 30-60d Black Sea shocks; ~30% share, agri trade $1.9T
Monitor tariffs, export bans and corridor disruptions—Black Sea ~30% of global wheat pre-2022—model working capital and buffer-stock days for 30–60d shocks. Stress-test sanctions, freight/insurance premia and trade finance access; global agri trade ~$1.9T (2023), cereal stocks-to-use ~29% (2024). Engage multi-port clauses, public–private forums and quota-aligned tenders to preserve margins.
| Metric | Value |
|---|---|
| Black Sea share | ~30% |
| Global agri trade | $1.9T (2023) |
| Stocks-to-use | ~29% (2024) |
What is included in the product
 Detailed Word Document
Explores how external macro-environmental factors uniquely affect the Sadot Group across six dimensions: Political, Economic, Social, Technological, Environmental, and Legal. Backed by data and trend analysis, the report offers forward-looking insights and actionable scenarios to help executives and investors identify risks, opportunities, and strategic responses in the group's market and regulatory context.

 Customizable Excel Spreadsheet
The Sadot Group PESTLE analysis condenses complex external risks into a clear, visually segmented summary for quick reference, editable notes, and seamless inclusion in presentations or team planning to speed alignment and decision-making.
Economic factors

Commodity price cycles
Model revenue sensitivity to corn, wheat, soy and feed grain volatility using USDA 2023/24 benchmarks (world corn ~1.20 bn t, wheat ~784 mn t, soy ~362 mn t) and forward curve shocks. Use systematic hedging to isolate merchandising margins from outright price moves and monitor basis and freight spreads as primary drivers of profit. Maintain disciplined 99% one‑day VaR limits through cycle peaks and troughs.
FX and interest rates
Sadot Group faces USD funding pressure with US policy rates near 5.25% in 2024–25, translating to ~4–6% funding costs for dollar loans and EM currency swings of up to ±10% year-on-year across sourcing markets. Aligning payables/receivables by invoicing in USD or local currency hedges translation risk; use forwards and NDFs for thinly traded currencies. Monitor rate-driven inventory carry and trade finance spreads, which rose ~50–150 bps, to manage working capital and margin erosion.

Global growth and demand
Global grain demand tracks GDP and rising protein consumption as populations reach ~8.1 billion (UN), with Asia ~4.7bn, Africa ~1.4bn and MENA ~0.5bn; IMF projects global growth ~3.0% in 2025 and emerging markets ~4.3%, supporting higher feed and food grain needs. Scenario-plan for recessionary slowdowns (demand compression, price volatility) versus EM expansion (volume growth, premium demand for value-added). Maintain a balanced book of staples and higher-margin value-added products (tilt by market cycle) and adjust pipeline inventory dynamically to demand-elasticity signals and forward curves.

Logistics and freight costs
Sadot Group must track dry bulk indices (BDI ~1,100 in June 2025), bunker/VLSFO costs (~$520/ton June 2025) and inland transport rates (up ~7% YoY in 2024) that compress spreads; securing COAs and optional laycan windows mitigates spot volatility. Optimize routing to cut demurrage/detention and embed freight risk into pricing and counterparty terms.
- Monitor BDI, bunker, inland rates
- Secure COAs + laycan options
- Optimize routing to reduce demurrage
- Price freight risk into offers/terms
Working capital intensity
Sadot Group must plan for high inventory and receivables typical in commodity flows, often driving working-capital cycles of 60–120 days and tying up significant cash versus annual revenue. Diversify trade finance across banks, insurers and ECA-backed lines to secure liquidity and lower funding rates. Tighten buyer credit policies and collateral management to cut DSO and default risk. Use structured prepay and repo to recycle capital faster and raise liquidity velocity.
- WC cycle: 60–120 days
- Finance mix: banks, insurers, ECA lines
- Actions: tighter credit, stronger collateral
- Liquidity tools: structured prepay, repo
Model 30-60d Black Sea shocks; ~30% share, agri trade $1.9T
Model revenue sensitivity to USDA 2023/24 volumes (corn 1.20bn t, wheat 784mn t, soy 362mn t) and forward shocks; hedge merchandising margins and monitor basis/freight. USD funding ~4–6% in 2024–25 with EM FX ±10% YoY; manage payables/receivables and use forwards/NDFs. Demand supported by population ~8.1bn and IMF 2025 growth ~3.0%; WC 60–120 days and freight (BDI ~1,100, VLSFO ~$520/t) compress spreads.
| Metric | Value |
|---|---|
| Corn | 1.20bn t |
| Wheat | 784mn t |
| Soy | 362mn t |
| BDI (Jun 2025) | ~1,100 |
| VLSFO (Jun 2025) | ~$520/t |
| USD funding | ~4–6% |
| WC cycle | 60–120 days |
Preview Before You Purchase
Sadot Group PESTLE Analysis
The Sadot Group PESTLE Analysis preview shown here is the exact document you’ll receive after purchase—fully formatted and ready to use. This is a real representation of the final file with no placeholders or teasers, delivered exactly as displayed. The layout, content, and structure visible here are what you’ll be able to download immediately after buying.

Original: $10.00
-65%$10.00
$3.50Product Information
Product Information
Shipping & Returns
Shipping & Returns
Description
Skip the Research. Get the Strategy.
Gain a strategic edge with our PESTLE Analysis of Sadot Group—three to five actionable insights reveal how political shifts, economic forces, and tech trends will shape its future. This concise briefing flags regulatory risks, market opportunities, and environmental pressures. Purchase the full report for the complete, editable deep-dive and ready-to-use strategic intelligence.
Political factors
Trade policy volatility
Track how tariffs, export bans and quotas on grains in key origin and destination markets shift margins and logistical flows; Black Sea suppliers account for roughly 30% of global wheat exports, so corridor disruptions materially affect pricing. Assess exposure to geopolitical flashpoints across the Black Sea, Latin America and MENA and quantify scenario impacts on working capital and inventory positioning. Model stress cases to estimate buffer stock days and cash conversion swings, and build contingency sourcing plans with alternative ports and partner suppliers to preserve flow continuity.
Sanctions and geopolitics
Monitor evolving sanctions regimes that could restrict counterparties, vessels or payment channels, noting Russia and Ukraine supplied roughly 30% of global wheat exports pre-2022 and remain systemic suppliers. Evaluate compliance costs and rerouting needs when sanctioned regions are major grain sources, and quantify additional freight and insurance premiums. Stress-test contract enforceability under sudden political shifts and model cashflow impacts. Maintain diversified banking and insurance relationships to preserve trade finance access.
Food security policies
Anticipate state interventions—price controls, strategic reserves, subsidies—that can distort market signals; over 20 countries used export measures since 2022 and major producers such as India and Russia have prioritized domestic supply. Global cereal stocks-to-use were about 29% in 2024, so map markets likely to restrict exports. Align with government food security programs to secure volumes and factor policy-driven demand surges into procurement timing.
Infrastructure and port governance
Sadot Group must assess political control over ports, rail and customs since the World Bank LPI 2023 flags customs and infrastructure governance as primary throughput determinants; risks from strikes, regime shifts or corruption can sharply extend clearance times and reduce reliability, so include multi-port optionality clauses to reroute cargo and engage public–private dialogues to boost logistics transparency.
Agri-diplomacy and quotas
Sadot must align exports with bilateral agri-diplomacy quotas—global agricultural trade reached about $1.9 trillion in 2023—to capture tariff breaks that can shave off roughly 10–15 percentage points versus MFN rates. Structuring tenders around quota windows raises bidding success and margin capture. Active advocacy through industry bodies secures predictable quota administration and timely allocations.
- preferential-benefit: up to 10–15pp vs MFN
- trade-context: global agri trade ~$1.9T (2023)
- tender-strategy: align with quota windows
- advocacy: industry lobbying for predictable quotas
Model 30-60d Black Sea shocks; ~30% share, agri trade $1.9T
Monitor tariffs, export bans and corridor disruptions—Black Sea ~30% of global wheat pre-2022—model working capital and buffer-stock days for 30–60d shocks. Stress-test sanctions, freight/insurance premia and trade finance access; global agri trade ~$1.9T (2023), cereal stocks-to-use ~29% (2024). Engage multi-port clauses, public–private forums and quota-aligned tenders to preserve margins.
| Metric | Value |
|---|---|
| Black Sea share | ~30% |
| Global agri trade | $1.9T (2023) |
| Stocks-to-use | ~29% (2024) |
What is included in the product
Detailed Word Document
Explores how external macro-environmental factors uniquely affect the Sadot Group across six dimensions: Political, Economic, Social, Technological, Environmental, and Legal. Backed by data and trend analysis, the report offers forward-looking insights and actionable scenarios to help executives and investors identify risks, opportunities, and strategic responses in the group's market and regulatory context.
Customizable Excel Spreadsheet
The Sadot Group PESTLE analysis condenses complex external risks into a clear, visually segmented summary for quick reference, editable notes, and seamless inclusion in presentations or team planning to speed alignment and decision-making.
Economic factors
Commodity price cycles
Model revenue sensitivity to corn, wheat, soy and feed grain volatility using USDA 2023/24 benchmarks (world corn ~1.20 bn t, wheat ~784 mn t, soy ~362 mn t) and forward curve shocks. Use systematic hedging to isolate merchandising margins from outright price moves and monitor basis and freight spreads as primary drivers of profit. Maintain disciplined 99% one‑day VaR limits through cycle peaks and troughs.
FX and interest rates
Sadot Group faces USD funding pressure with US policy rates near 5.25% in 2024–25, translating to ~4–6% funding costs for dollar loans and EM currency swings of up to ±10% year-on-year across sourcing markets. Aligning payables/receivables by invoicing in USD or local currency hedges translation risk; use forwards and NDFs for thinly traded currencies. Monitor rate-driven inventory carry and trade finance spreads, which rose ~50–150 bps, to manage working capital and margin erosion.
Global growth and demand
Global grain demand tracks GDP and rising protein consumption as populations reach ~8.1 billion (UN), with Asia ~4.7bn, Africa ~1.4bn and MENA ~0.5bn; IMF projects global growth ~3.0% in 2025 and emerging markets ~4.3%, supporting higher feed and food grain needs. Scenario-plan for recessionary slowdowns (demand compression, price volatility) versus EM expansion (volume growth, premium demand for value-added). Maintain a balanced book of staples and higher-margin value-added products (tilt by market cycle) and adjust pipeline inventory dynamically to demand-elasticity signals and forward curves.
Logistics and freight costs
Sadot Group must track dry bulk indices (BDI ~1,100 in June 2025), bunker/VLSFO costs (~$520/ton June 2025) and inland transport rates (up ~7% YoY in 2024) that compress spreads; securing COAs and optional laycan windows mitigates spot volatility. Optimize routing to cut demurrage/detention and embed freight risk into pricing and counterparty terms.
- Monitor BDI, bunker, inland rates
- Secure COAs + laycan options
- Optimize routing to reduce demurrage
- Price freight risk into offers/terms
Working capital intensity
Sadot Group must plan for high inventory and receivables typical in commodity flows, often driving working-capital cycles of 60–120 days and tying up significant cash versus annual revenue. Diversify trade finance across banks, insurers and ECA-backed lines to secure liquidity and lower funding rates. Tighten buyer credit policies and collateral management to cut DSO and default risk. Use structured prepay and repo to recycle capital faster and raise liquidity velocity.
- WC cycle: 60–120 days
- Finance mix: banks, insurers, ECA lines
- Actions: tighter credit, stronger collateral
- Liquidity tools: structured prepay, repo
Model 30-60d Black Sea shocks; ~30% share, agri trade $1.9T
Model revenue sensitivity to USDA 2023/24 volumes (corn 1.20bn t, wheat 784mn t, soy 362mn t) and forward shocks; hedge merchandising margins and monitor basis/freight. USD funding ~4–6% in 2024–25 with EM FX ±10% YoY; manage payables/receivables and use forwards/NDFs. Demand supported by population ~8.1bn and IMF 2025 growth ~3.0%; WC 60–120 days and freight (BDI ~1,100, VLSFO ~$520/t) compress spreads.
| Metric | Value |
|---|---|
| Corn | 1.20bn t |
| Wheat | 784mn t |
| Soy | 362mn t |
| BDI (Jun 2025) | ~1,100 |
| VLSFO (Jun 2025) | ~$520/t |
| USD funding | ~4–6% |
| WC cycle | 60–120 days |
Preview Before You Purchase
Sadot Group PESTLE Analysis
The Sadot Group PESTLE Analysis preview shown here is the exact document you’ll receive after purchase—fully formatted and ready to use. This is a real representation of the final file with no placeholders or teasers, delivered exactly as displayed. The layout, content, and structure visible here are what you’ll be able to download immediately after buying.











