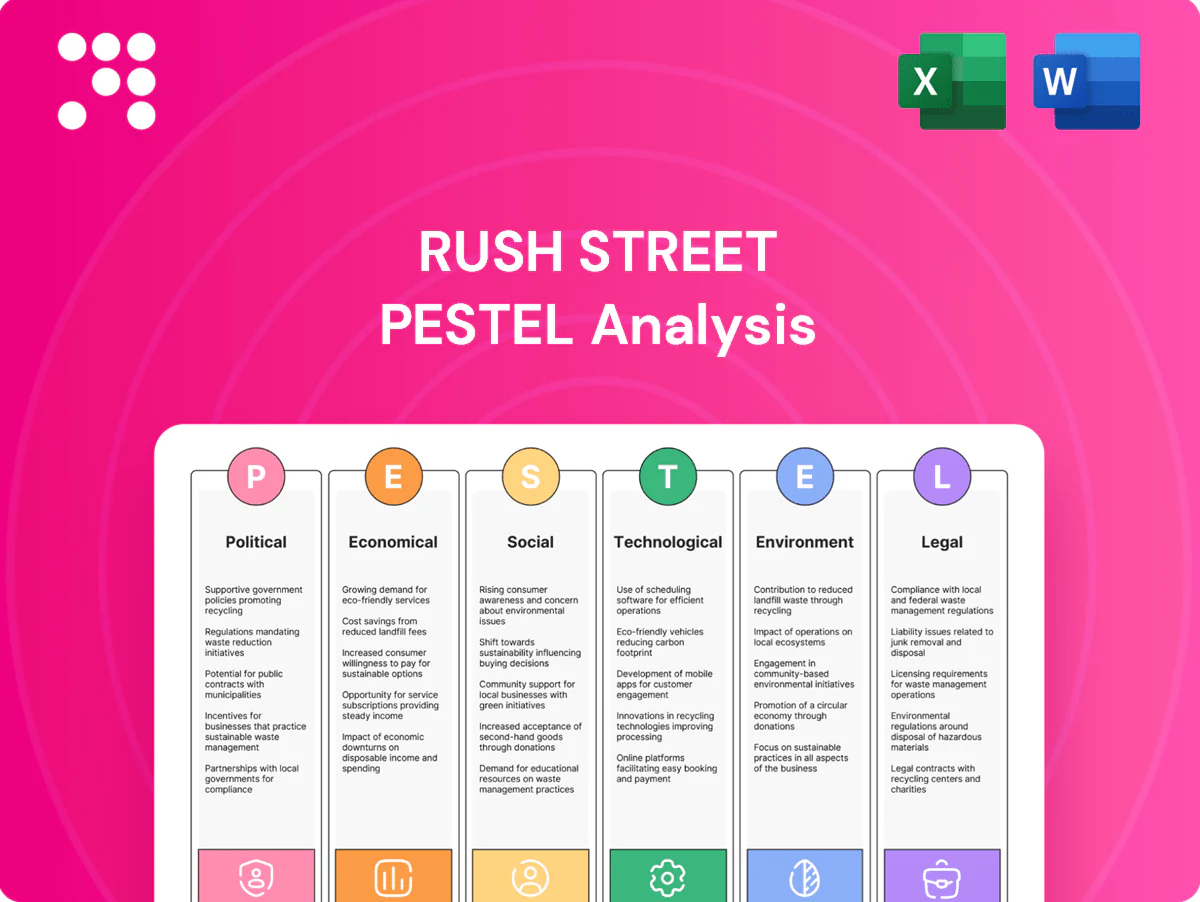
Rush Street PESTLE Analysis

Plan Smarter. Present Sharper. Compete Stronger.
Gain a strategic edge with our focused PESTLE analysis of Rush Street, revealing how political, economic, social, technological, legal and environmental forces shape its prospects. Packed with actionable insights for investors, consultants, and strategists, this concise briefing highlights key risks and opportunities. Purchase the full PESTLE analysis now to access the complete, ready-to-use intelligence and forecasting you need.
Political factors

State gaming policy volatility
Shifts in state legislatures and governors can rapidly change casino licensing, tax rates (ranging from single digits to over 40%) and allowable formats, creating a patchwork U.S. market where ballot initiatives open or close opportunities; with U.S. commercial gaming revenue near $54 billion in 2023, Rush Street must adapt capital planning and site selection, and maintain contingency plans for moratoriums or defined expansion windows.
Taxation and incentives
Assess gaming taxes and promotional credit deductibility against the 21% federal corporate tax to model after-tax returns; state/local excise on table games, slots or online GGR (varies widely) can cut margins materially. Property tax regimes and availability of development incentives, TIF districts and infrastructure support tied to job creation (commonly used in 2024–25 projects) affect capex and IRR. Sensitivity analyses should model surtaxes on GGR and compare net yields to lower-tax neighboring states to gauge competitive positioning.

Interstate and cross-border online rules
As of July 2025, 34 states plus DC permit sports betting and roughly 10 states authorize full iGaming, creating a patchwork that fragments Rush Street Interactive’s market access and constrains shared-liquidity pools. Only New Jersey, Nevada and Delaware maintain a multi-state poker compact (MSIGA), limiting broader pool aggregation. Federal signals remain muted with no enacted online-wagering framework; industry lobbying topped about $25M in 2024, driving RSI into state coalitions and trade groups to press for compacts and harmonized rules.

Municipal relations and community approvals
City councils, referenda and local community boards control zoning and special‑use permits; Rush Street required Chicago City Council approval for Rivers Casino Chicago in 2011 as a precedent. Community benefits agreements commonly tie local hiring, minority contracting and neighborhood investment to approvals. Proactive stakeholder engagement mitigates NIMBY opposition and positive municipal relations accelerate timelines and reduce permitting risk.
- City council approvals
- Referenda/community boards
- Local hiring & minority contracting
- Stakeholder engagement to mitigate NIMBY
- Stronger municipal relations = faster permits
Public-private infrastructure alignment
Public-private alignment on transport, convention center upgrades and entertainment districts can unlock federal and state funds—eg IIJA's $1.2 trillion framework and major projects like the ~$980m Las Vegas Convention Center expansion—driving visitor and convention traffic into integrated resorts. Political backing raises traffic and revenue potential; administration changes risk funding shifts, so build phased, flexible scopes to adapt.
- Opportunity: leverage IIJA and state grants to boost access and footfall
- Impact: direct link between public projects and resort visitation/revenue
- Risk mitigation: phased designs, contingency budgets, policy-triggered pivots
Political volatility forces flexible gaming site and capex plans amid fragmented licensing
Political volatility drives fragmented licensing, taxes (state rates vary single digits to >40%) and formats; U.S. gaming revenue ~$54B in 2023 forces flexible site/capex plans. 34 states+DC allow sports betting and ~10 allow iGaming (Jul 2025), lobbying ~$25M in 2024 shapes state rules. Local approvals, CBAs and public infrastructure grants (IIJA) materially affect timelines and visitation.
| Tag | Metric | Value |
|---|---|---|
| Tax | Federal corp | 21% |
| Market | US gaming revenue | $54B (2023) |
| Access | Sports betting | 34 states + DC (Jul 2025) |
| Access | iGaming | ~10 states (Jul 2025) |
| Lobby | Industry spend | $25M (2024) |
What is included in the product
 Detailed Word Document
Provides a concise PESTLE assessment of Rush Street across Political, Economic, Social, Technological, Environmental and Legal dimensions, each backed by current data and regional market/regulatory trends. Designed for executives and investors with forward‑looking insights to inform strategy, risk mitigation and funding narratives.

 Customizable Excel Spreadsheet
Condenses Rush Street's full PESTLE into a clear, shareable snapshot that speeds stakeholder alignment and supports quick decision-making in meetings or pitch decks.
Economic factors

Consumer discretionary cycle
Gaming and F&B spend at Rush Street is highly sensitive to employment and wage growth—US unemployment averaged about 3.7% in 2024 (BLS) and average hourly earnings rose roughly 4% YoY—correlating with stronger spend when Conference Board consumer confidence (avg ~100 in 2024) is higher. Demand splits: local gamers provide steady weekday revenue while destination tourists drive weekends and premium spend (roughly 40–50% of premium gaming). In downturns consumers trade down to value F&B and increase promo responsiveness, raising promo intensity and lowering ADRs; scenario plans should model revenue declines of 10–25% in recessionary vs 5–15% CAGR upside in expansionary cases.
Interest rates and capital costs
Elevated Fed funds at 5.25–5.50% (mid‑2024–2025) raises cost of capital for Rush Street, reducing DSCR and covenant headroom and increasing refinancing risk on maturing loans. Prioritise projects with sub‑3 year paybacks and higher initial cash yield. Consider sale‑leasebacks or JV equity to lower WACC and shift refinancing exposure.

Inflation and operating margins
Track labor, utilities and food input inflation against pricing power as U.S. CPI eased to about 3.4% in Dec 2024 and leisure and hospitality wages rose roughly 5% year-on-year per BLS; calibrate promotional spend and loyalty economics to protect EBITDA. Evaluate dynamic pricing for rooms, events and F&B to capture demand, while pursuing procurement efficiencies and energy savings to offset cost creep.

Tourism, conventions, and local economic health
Assess feeder market airlift (IATA: 2024 global pax ~90–95% of 2019) and convention calendars; US hotel occupancy ran about 63% in 2024 (STR), with city-specific spikes tied to major conventions. Link local GDP growth (US real GDP ~2.4% in 2024, BEA) and population growth (~0.4% in 2023, Census) to property demand and RevPAR. Monitor currency moves (DXY up ~5% in 2024) for inbound international spend and align marketing to seasonality and event-driven spikes.
Digital growth and competitive intensity
- state-rollout: 38+ states + DC live (mid-2025)
- market-size: US GGR ~12B–15B (2024–25)
- marketing-metrics: CPA $200–$600; LTV $500–$1,500
- promo-burden: 20–40% of revenue
- cross-sell-lift: +10–30% unit economics
- margins: normalize to ~10–20% EBITDA
Political volatility forces flexible gaming site and capex plans amid fragmented licensing
Consumer spend tied to labor: US unemployment ~3.7% (2024) and avg hourly earnings +4% YoY boost gaming/F&B; recessions can cut revenue 10–25%. Fed funds 5.25–5.50% (mid‑2024–25) raises WACC and refinancing risk; prioritize <3yr paybacks or JV/sale‑leasebacks. Input inflation eased (CPI ~3.4% Dec‑2024) but wages +5% in leisure; focus dynamic pricing and procurement.
| Metric | Value |
|---|---|
| Unemployment | ~3.7% (2024) |
| Fed funds | 5.25–5.50% |
| CPI | ~3.4% Dec‑2024 |
| Hotel occ. | ~63% (2024) |
Full Version Awaits
Rush Street PESTLE Analysis
The Rush Street PESTLE Analysis preview shown here is the exact document you’ll receive after purchase—fully formatted and ready to use. The layout, content, and structure visible are identical to the downloadable file, with no placeholders or teasers. After payment you’ll get this same professionally structured report immediately, exactly as displayed.

Product Information
Product Information
Shipping & Returns
Shipping & Returns
Description
Plan Smarter. Present Sharper. Compete Stronger.
Gain a strategic edge with our focused PESTLE analysis of Rush Street, revealing how political, economic, social, technological, legal and environmental forces shape its prospects. Packed with actionable insights for investors, consultants, and strategists, this concise briefing highlights key risks and opportunities. Purchase the full PESTLE analysis now to access the complete, ready-to-use intelligence and forecasting you need.
Political factors
State gaming policy volatility
Shifts in state legislatures and governors can rapidly change casino licensing, tax rates (ranging from single digits to over 40%) and allowable formats, creating a patchwork U.S. market where ballot initiatives open or close opportunities; with U.S. commercial gaming revenue near $54 billion in 2023, Rush Street must adapt capital planning and site selection, and maintain contingency plans for moratoriums or defined expansion windows.
Taxation and incentives
Assess gaming taxes and promotional credit deductibility against the 21% federal corporate tax to model after-tax returns; state/local excise on table games, slots or online GGR (varies widely) can cut margins materially. Property tax regimes and availability of development incentives, TIF districts and infrastructure support tied to job creation (commonly used in 2024–25 projects) affect capex and IRR. Sensitivity analyses should model surtaxes on GGR and compare net yields to lower-tax neighboring states to gauge competitive positioning.
Interstate and cross-border online rules
As of July 2025, 34 states plus DC permit sports betting and roughly 10 states authorize full iGaming, creating a patchwork that fragments Rush Street Interactive’s market access and constrains shared-liquidity pools. Only New Jersey, Nevada and Delaware maintain a multi-state poker compact (MSIGA), limiting broader pool aggregation. Federal signals remain muted with no enacted online-wagering framework; industry lobbying topped about $25M in 2024, driving RSI into state coalitions and trade groups to press for compacts and harmonized rules.
Municipal relations and community approvals
City councils, referenda and local community boards control zoning and special‑use permits; Rush Street required Chicago City Council approval for Rivers Casino Chicago in 2011 as a precedent. Community benefits agreements commonly tie local hiring, minority contracting and neighborhood investment to approvals. Proactive stakeholder engagement mitigates NIMBY opposition and positive municipal relations accelerate timelines and reduce permitting risk.
- City council approvals
- Referenda/community boards
- Local hiring & minority contracting
- Stakeholder engagement to mitigate NIMBY
- Stronger municipal relations = faster permits
Public-private infrastructure alignment
Public-private alignment on transport, convention center upgrades and entertainment districts can unlock federal and state funds—eg IIJA's $1.2 trillion framework and major projects like the ~$980m Las Vegas Convention Center expansion—driving visitor and convention traffic into integrated resorts. Political backing raises traffic and revenue potential; administration changes risk funding shifts, so build phased, flexible scopes to adapt.
- Opportunity: leverage IIJA and state grants to boost access and footfall
- Impact: direct link between public projects and resort visitation/revenue
- Risk mitigation: phased designs, contingency budgets, policy-triggered pivots
Political volatility forces flexible gaming site and capex plans amid fragmented licensing
Political volatility drives fragmented licensing, taxes (state rates vary single digits to >40%) and formats; U.S. gaming revenue ~$54B in 2023 forces flexible site/capex plans. 34 states+DC allow sports betting and ~10 allow iGaming (Jul 2025), lobbying ~$25M in 2024 shapes state rules. Local approvals, CBAs and public infrastructure grants (IIJA) materially affect timelines and visitation.
| Tag | Metric | Value |
|---|---|---|
| Tax | Federal corp | 21% |
| Market | US gaming revenue | $54B (2023) |
| Access | Sports betting | 34 states + DC (Jul 2025) |
| Access | iGaming | ~10 states (Jul 2025) |
| Lobby | Industry spend | $25M (2024) |
What is included in the product
Detailed Word Document
Provides a concise PESTLE assessment of Rush Street across Political, Economic, Social, Technological, Environmental and Legal dimensions, each backed by current data and regional market/regulatory trends. Designed for executives and investors with forward‑looking insights to inform strategy, risk mitigation and funding narratives.
Customizable Excel Spreadsheet
Condenses Rush Street's full PESTLE into a clear, shareable snapshot that speeds stakeholder alignment and supports quick decision-making in meetings or pitch decks.
Economic factors
Consumer discretionary cycle
Gaming and F&B spend at Rush Street is highly sensitive to employment and wage growth—US unemployment averaged about 3.7% in 2024 (BLS) and average hourly earnings rose roughly 4% YoY—correlating with stronger spend when Conference Board consumer confidence (avg ~100 in 2024) is higher. Demand splits: local gamers provide steady weekday revenue while destination tourists drive weekends and premium spend (roughly 40–50% of premium gaming). In downturns consumers trade down to value F&B and increase promo responsiveness, raising promo intensity and lowering ADRs; scenario plans should model revenue declines of 10–25% in recessionary vs 5–15% CAGR upside in expansionary cases.
Interest rates and capital costs
Elevated Fed funds at 5.25–5.50% (mid‑2024–2025) raises cost of capital for Rush Street, reducing DSCR and covenant headroom and increasing refinancing risk on maturing loans. Prioritise projects with sub‑3 year paybacks and higher initial cash yield. Consider sale‑leasebacks or JV equity to lower WACC and shift refinancing exposure.
Inflation and operating margins
Track labor, utilities and food input inflation against pricing power as U.S. CPI eased to about 3.4% in Dec 2024 and leisure and hospitality wages rose roughly 5% year-on-year per BLS; calibrate promotional spend and loyalty economics to protect EBITDA. Evaluate dynamic pricing for rooms, events and F&B to capture demand, while pursuing procurement efficiencies and energy savings to offset cost creep.
Tourism, conventions, and local economic health
Assess feeder market airlift (IATA: 2024 global pax ~90–95% of 2019) and convention calendars; US hotel occupancy ran about 63% in 2024 (STR), with city-specific spikes tied to major conventions. Link local GDP growth (US real GDP ~2.4% in 2024, BEA) and population growth (~0.4% in 2023, Census) to property demand and RevPAR. Monitor currency moves (DXY up ~5% in 2024) for inbound international spend and align marketing to seasonality and event-driven spikes.
Digital growth and competitive intensity
- state-rollout: 38+ states + DC live (mid-2025)
- market-size: US GGR ~12B–15B (2024–25)
- marketing-metrics: CPA $200–$600; LTV $500–$1,500
- promo-burden: 20–40% of revenue
- cross-sell-lift: +10–30% unit economics
- margins: normalize to ~10–20% EBITDA
Political volatility forces flexible gaming site and capex plans amid fragmented licensing
Consumer spend tied to labor: US unemployment ~3.7% (2024) and avg hourly earnings +4% YoY boost gaming/F&B; recessions can cut revenue 10–25%. Fed funds 5.25–5.50% (mid‑2024–25) raises WACC and refinancing risk; prioritize <3yr paybacks or JV/sale‑leasebacks. Input inflation eased (CPI ~3.4% Dec‑2024) but wages +5% in leisure; focus dynamic pricing and procurement.
| Metric | Value |
|---|---|
| Unemployment | ~3.7% (2024) |
| Fed funds | 5.25–5.50% |
| CPI | ~3.4% Dec‑2024 |
| Hotel occ. | ~63% (2024) |
Full Version Awaits
Rush Street PESTLE Analysis
The Rush Street PESTLE Analysis preview shown here is the exact document you’ll receive after purchase—fully formatted and ready to use. The layout, content, and structure visible are identical to the downloadable file, with no placeholders or teasers. After payment you’ll get this same professionally structured report immediately, exactly as displayed.











