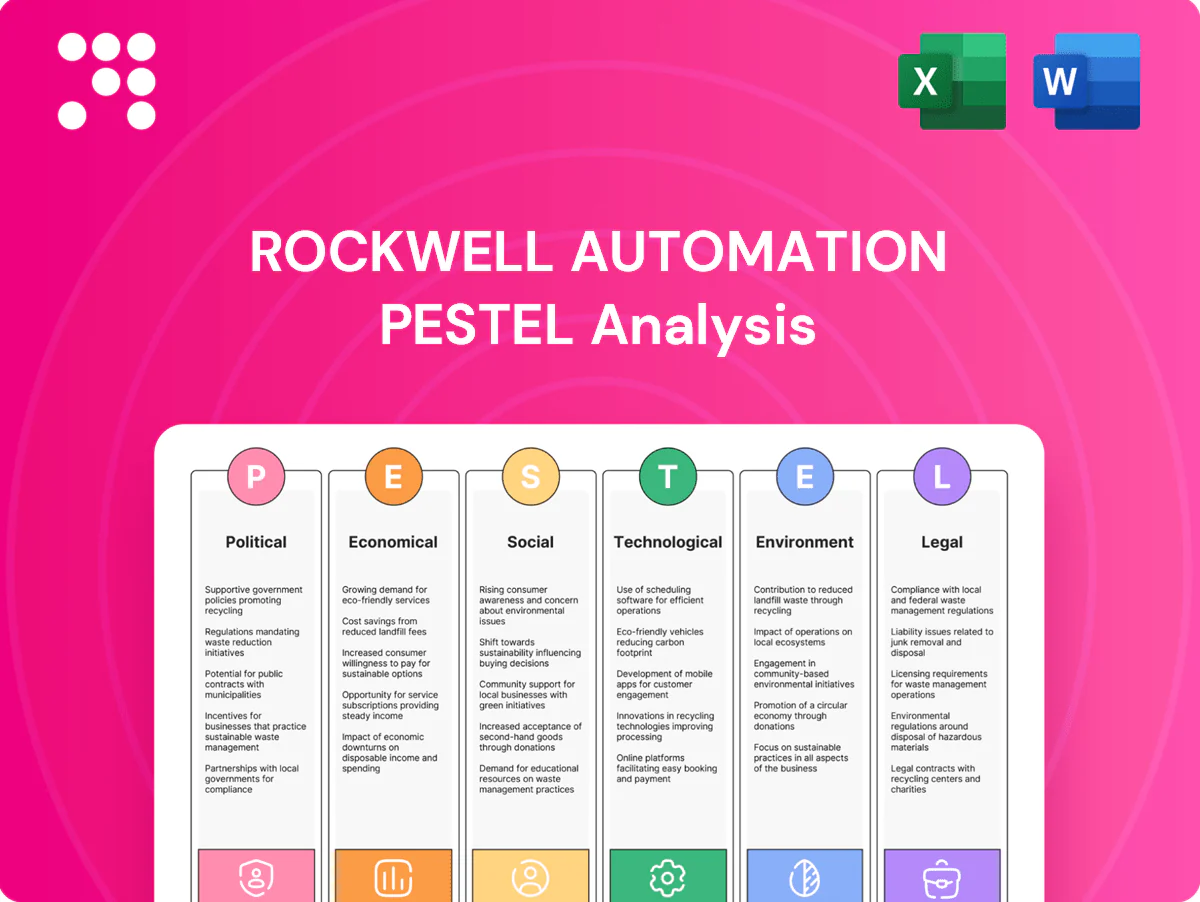
Rockwell Automation PESTLE Analysis

Make Smarter Strategic Decisions with a Complete PESTEL View
Discover how political shifts, economic cycles, regulatory changes, and rapid automation technologies are shaping Rockwell Automation’s strategic outlook. This concise PESTLE highlights risks and opportunity areas critical for investors and planners. Get expert-backed, ready-to-use insights to inform decisions. Purchase the full PESTLE now for the complete, downloadable analysis.
Political factors

Geopolitical tensions and trade policy
Shifts in US‑China and EU trade policy — including US Section 301 tariffs up to 25% and EU 2023 export controls on advanced semiconductors — constrain component access and slow market growth (WTO merchandise trade volume grew just 0.3% in 2023). Localization mandates forcing majority local production increase capex and partners. Sanctions regimes restrict customer eligibility and raise supply risk. Proactive supplier diversification and compliance tooling reduce disruption.
Industrial policy and incentives
IRA's roughly $370B clean‑energy package, CHIPS' ~$52B manufacturing subsidies and EU IPCEI programs mobilizing tens of billions EUR are accelerating reshoring and advanced‑manufacturing automation demand. These incentives steer Rockwell's sales focus and influence plant‑siting choices. Navigating complex grant and tax‑credit rules raises compliance and implementation costs. Rockwell can bundle controls, software and services to capture policy‑driven capex.

Public infrastructure and energy agendas
Government investments such as the US Bipartisan Infrastructure Law ($1.2 trillion total, $550 billion new) and EU NextGenerationEU (~€800 billion) are driving grid, water and transport modernizations that require SCADA and control upgrades, boosting Rockwell Automation addressable markets. Energy transition projects across utilities and hydrogen/EV infrastructure further expand demand for process automation. Procurement rules increasingly mandate standards, certification and robust cybersecurity postures, while long multi-year project cycles mean Rockwell must continuously monitor policy stability and funding timelines.

Cybersecurity directives for critical industries
NIS2 and CISA guidance tighten OT security for critical industries, forcing customers to demand compliant architectures, device hardening and continuous monitoring; this boosts demand for Rockwell Automation’s secure-by-design hardware, software and services. Noncompliance can delay deployments and incur penalties up to €10M or 2% of global turnover; IBM’s 2024 breach cost averaged $4.45M.
- Regulations: NIS2/CISA
- Customer needs: compliant architectures, hardening, monitoring
- Opportunity: secure-by-design products/services
- Risk: deployment delays, fines up to €10M/2%, avg breach cost $4.45M
Political stability and procurement risk
Political instability, elections and regime shifts reshape capital spending and can spike FX volatility, affecting Rockwell Automation’s project timing; Rockwell reported roughly $9.0B in 2024 revenue, increasing sensitivity to macro funding shifts. State-owned enterprise sourcing and localization rules restrict vendor access in key markets. Corruption and opaque procurement raise bid risk, so robust ethics and compliance programs protect eligibility and reputation.
- 2024 revenue: $9.0B
- Higher bid risk in opaque markets
- SOE/localization restricts access
- Ethics programs mitigate disqualification
Geopolitics, IRA/CHIPS/NextGenerationEU spur reshoring, automation; OT security risk rises
Geopolitical tensions, tariffs and export controls (US Section 301, EU 2023 rules) raise component risk and slow growth; WTO goods trade +0.3% in 2023. IRA ~$370B, CHIPS ~$52B and EU NextGenerationEU ~€800B drive reshoring and automation demand; Rockwell revenue ~$9.0B (2024) heightens exposure. NIS2/CISA raise OT security needs; fines up to €10M/2%.
| Item | Value |
|---|---|
| Rockwell rev (2024) | $9.0B |
| IRA | $370B |
| CHIPS | $52B |
| NextGenerationEU | ~€800B |
| NIS2 fine | €10M or 2% |
What is included in the product
 Detailed Word Document
Explores how Political, Economic, Social, Technological, Environmental and Legal forces uniquely impact Rockwell Automation — backed by current industry data, regulatory trends, and supply‑chain dynamics to identify risks and growth opportunities for executives and investors.

 Customizable Excel Spreadsheet
A concise, visually segmented PESTLE summary for Rockwell Automation that can be dropped into presentations, edited with region- or business-specific notes, and easily shared to align teams on external risks and market positioning.
Economic factors

Capex cycles and PMI sensitivity
Industrial automation demand closely tracks manufacturing PMIs and capacity utilization; Rockwell flagged in FY2024 revenue of about $8.4bn as project timing shifted with cyclical PMIs. Slowdowns defer capex projects while recoveries accelerate greenfield and retrofit spend. A diversified end-market mix and growing services/recurring revenue smooth cyclical swings.
Currency and interest rate dynamics
USD strength (DXY ~105 in mid‑2024) compresses Rockwell Automation reported revenue and can hurt price competitiveness in non‑USD markets. Higher interest rates (effective Fed funds ~5.25–5.50% in 2024) raise customer hurdle rates and reduce leasing appeal. Active hedging and regional pricing mitigate FX swings, while expanding Software/SaaS revenue reduces sensitivity to macro and financing cycles.

Supply chain costs and lead times
Component shortages and elevated logistics costs have pressured margins and delivery timelines for Rockwell Automation; the company reported FY2024 revenue of $8.7 billion, highlighting scale-sensitive supply risks. Multi-sourcing, component redesigns and increased safety stock remain pivotal to preserve fulfillment. Transparency tools and real-time tracking reassure customers on timelines and shifts. Preferential supplier status is increasingly tied to consistent on-time delivery and quality performance.

Labor productivity and reshoring
Wage inflation (US average hourly earnings rose about 4% year-over-year in 2024, BLS) and persistent skilled-labor gaps are increasing automation ROI, supporting Rockwell Automation’s value proposition; Rockwell reported FY2024 revenue near $8.0 billion, underscoring market scale. Reshoring and nearshoring in North America and Europe are expanding factory builds, and Rockwell can quantify payback to unlock capex; services and training drive recurring revenue and customer stickiness.
- Wage inflation: ~4% (BLS, 2024)
- Rockwell FY2024 revenue: ~$8.0B
- Reshoring trend: rising factory investments in NA/Europe
- Services/training: higher retention, recurring revenue
Recurring revenue and pricing power
Industrial software, subscriptions and services at Rockwell Automation help stabilize cash flows by shifting sales from one-time capital purchases to recurring streams; Rockwell reported fiscal 2024 revenue of $8.66 billion. Value-based pricing tied to uptime and energy savings supports higher margins and long-term contracts. Bundled solutions increase wallet share while KPIs move toward ARR and retention metrics.
- FY2024 revenue: $8.66B
- Focus: recurring software, subscriptions, services
- Pricing: value-based (uptime, energy savings)
- KPI shift: ARR, retention, wallet share
Geopolitics, IRA/CHIPS/NextGenerationEU spur reshoring, automation; OT security risk rises
Industrial automation demand follows PMIs and capex cycles; Rockwell flagged FY2024 revenue ~$8.66B as projects shifted. USD strength (DXY ~105) and Fed rates (~5.25–5.50%) compress reported growth and raise customer hurdle rates. Wage inflation (~4% in 2024) and reshoring boost automation ROI, favoring services/subscription mix.
| Metric | Value |
|---|---|
| FY2024 revenue | $8.66B |
| DXY (mid‑2024) | ~105 |
| Fed funds (2024) | 5.25–5.50% |
| Wage inflation (2024) | ~4% |
Same Document Delivered
Rockwell Automation PESTLE Analysis
This Rockwell Automation PESTLE Analysis provides a concise, market-ready assessment of Political, Economic, Social, Technological, Legal and Environmental factors affecting the company. The preview shown here is the exact document you’ll receive after purchase—fully formatted and ready to use. It includes charts, key findings and actionable insights tailored to Rockwell.

Product Information
Product Information
Shipping & Returns
Shipping & Returns
Description
Make Smarter Strategic Decisions with a Complete PESTEL View
Discover how political shifts, economic cycles, regulatory changes, and rapid automation technologies are shaping Rockwell Automation’s strategic outlook. This concise PESTLE highlights risks and opportunity areas critical for investors and planners. Get expert-backed, ready-to-use insights to inform decisions. Purchase the full PESTLE now for the complete, downloadable analysis.
Political factors
Geopolitical tensions and trade policy
Shifts in US‑China and EU trade policy — including US Section 301 tariffs up to 25% and EU 2023 export controls on advanced semiconductors — constrain component access and slow market growth (WTO merchandise trade volume grew just 0.3% in 2023). Localization mandates forcing majority local production increase capex and partners. Sanctions regimes restrict customer eligibility and raise supply risk. Proactive supplier diversification and compliance tooling reduce disruption.
Industrial policy and incentives
IRA's roughly $370B clean‑energy package, CHIPS' ~$52B manufacturing subsidies and EU IPCEI programs mobilizing tens of billions EUR are accelerating reshoring and advanced‑manufacturing automation demand. These incentives steer Rockwell's sales focus and influence plant‑siting choices. Navigating complex grant and tax‑credit rules raises compliance and implementation costs. Rockwell can bundle controls, software and services to capture policy‑driven capex.
Public infrastructure and energy agendas
Government investments such as the US Bipartisan Infrastructure Law ($1.2 trillion total, $550 billion new) and EU NextGenerationEU (~€800 billion) are driving grid, water and transport modernizations that require SCADA and control upgrades, boosting Rockwell Automation addressable markets. Energy transition projects across utilities and hydrogen/EV infrastructure further expand demand for process automation. Procurement rules increasingly mandate standards, certification and robust cybersecurity postures, while long multi-year project cycles mean Rockwell must continuously monitor policy stability and funding timelines.
Cybersecurity directives for critical industries
NIS2 and CISA guidance tighten OT security for critical industries, forcing customers to demand compliant architectures, device hardening and continuous monitoring; this boosts demand for Rockwell Automation’s secure-by-design hardware, software and services. Noncompliance can delay deployments and incur penalties up to €10M or 2% of global turnover; IBM’s 2024 breach cost averaged $4.45M.
- Regulations: NIS2/CISA
- Customer needs: compliant architectures, hardening, monitoring
- Opportunity: secure-by-design products/services
- Risk: deployment delays, fines up to €10M/2%, avg breach cost $4.45M
Political stability and procurement risk
Political instability, elections and regime shifts reshape capital spending and can spike FX volatility, affecting Rockwell Automation’s project timing; Rockwell reported roughly $9.0B in 2024 revenue, increasing sensitivity to macro funding shifts. State-owned enterprise sourcing and localization rules restrict vendor access in key markets. Corruption and opaque procurement raise bid risk, so robust ethics and compliance programs protect eligibility and reputation.
- 2024 revenue: $9.0B
- Higher bid risk in opaque markets
- SOE/localization restricts access
- Ethics programs mitigate disqualification
Geopolitics, IRA/CHIPS/NextGenerationEU spur reshoring, automation; OT security risk rises
Geopolitical tensions, tariffs and export controls (US Section 301, EU 2023 rules) raise component risk and slow growth; WTO goods trade +0.3% in 2023. IRA ~$370B, CHIPS ~$52B and EU NextGenerationEU ~€800B drive reshoring and automation demand; Rockwell revenue ~$9.0B (2024) heightens exposure. NIS2/CISA raise OT security needs; fines up to €10M/2%.
| Item | Value |
|---|---|
| Rockwell rev (2024) | $9.0B |
| IRA | $370B |
| CHIPS | $52B |
| NextGenerationEU | ~€800B |
| NIS2 fine | €10M or 2% |
What is included in the product
Detailed Word Document
Explores how Political, Economic, Social, Technological, Environmental and Legal forces uniquely impact Rockwell Automation — backed by current industry data, regulatory trends, and supply‑chain dynamics to identify risks and growth opportunities for executives and investors.
Customizable Excel Spreadsheet
A concise, visually segmented PESTLE summary for Rockwell Automation that can be dropped into presentations, edited with region- or business-specific notes, and easily shared to align teams on external risks and market positioning.
Economic factors
Capex cycles and PMI sensitivity
Industrial automation demand closely tracks manufacturing PMIs and capacity utilization; Rockwell flagged in FY2024 revenue of about $8.4bn as project timing shifted with cyclical PMIs. Slowdowns defer capex projects while recoveries accelerate greenfield and retrofit spend. A diversified end-market mix and growing services/recurring revenue smooth cyclical swings.
Currency and interest rate dynamics
USD strength (DXY ~105 in mid‑2024) compresses Rockwell Automation reported revenue and can hurt price competitiveness in non‑USD markets. Higher interest rates (effective Fed funds ~5.25–5.50% in 2024) raise customer hurdle rates and reduce leasing appeal. Active hedging and regional pricing mitigate FX swings, while expanding Software/SaaS revenue reduces sensitivity to macro and financing cycles.
Supply chain costs and lead times
Component shortages and elevated logistics costs have pressured margins and delivery timelines for Rockwell Automation; the company reported FY2024 revenue of $8.7 billion, highlighting scale-sensitive supply risks. Multi-sourcing, component redesigns and increased safety stock remain pivotal to preserve fulfillment. Transparency tools and real-time tracking reassure customers on timelines and shifts. Preferential supplier status is increasingly tied to consistent on-time delivery and quality performance.
Labor productivity and reshoring
Wage inflation (US average hourly earnings rose about 4% year-over-year in 2024, BLS) and persistent skilled-labor gaps are increasing automation ROI, supporting Rockwell Automation’s value proposition; Rockwell reported FY2024 revenue near $8.0 billion, underscoring market scale. Reshoring and nearshoring in North America and Europe are expanding factory builds, and Rockwell can quantify payback to unlock capex; services and training drive recurring revenue and customer stickiness.
- Wage inflation: ~4% (BLS, 2024)
- Rockwell FY2024 revenue: ~$8.0B
- Reshoring trend: rising factory investments in NA/Europe
- Services/training: higher retention, recurring revenue
Recurring revenue and pricing power
Industrial software, subscriptions and services at Rockwell Automation help stabilize cash flows by shifting sales from one-time capital purchases to recurring streams; Rockwell reported fiscal 2024 revenue of $8.66 billion. Value-based pricing tied to uptime and energy savings supports higher margins and long-term contracts. Bundled solutions increase wallet share while KPIs move toward ARR and retention metrics.
- FY2024 revenue: $8.66B
- Focus: recurring software, subscriptions, services
- Pricing: value-based (uptime, energy savings)
- KPI shift: ARR, retention, wallet share
Geopolitics, IRA/CHIPS/NextGenerationEU spur reshoring, automation; OT security risk rises
Industrial automation demand follows PMIs and capex cycles; Rockwell flagged FY2024 revenue ~$8.66B as projects shifted. USD strength (DXY ~105) and Fed rates (~5.25–5.50%) compress reported growth and raise customer hurdle rates. Wage inflation (~4% in 2024) and reshoring boost automation ROI, favoring services/subscription mix.
| Metric | Value |
|---|---|
| FY2024 revenue | $8.66B |
| DXY (mid‑2024) | ~105 |
| Fed funds (2024) | 5.25–5.50% |
| Wage inflation (2024) | ~4% |
Same Document Delivered
Rockwell Automation PESTLE Analysis
This Rockwell Automation PESTLE Analysis provides a concise, market-ready assessment of Political, Economic, Social, Technological, Legal and Environmental factors affecting the company. The preview shown here is the exact document you’ll receive after purchase—fully formatted and ready to use. It includes charts, key findings and actionable insights tailored to Rockwell.











