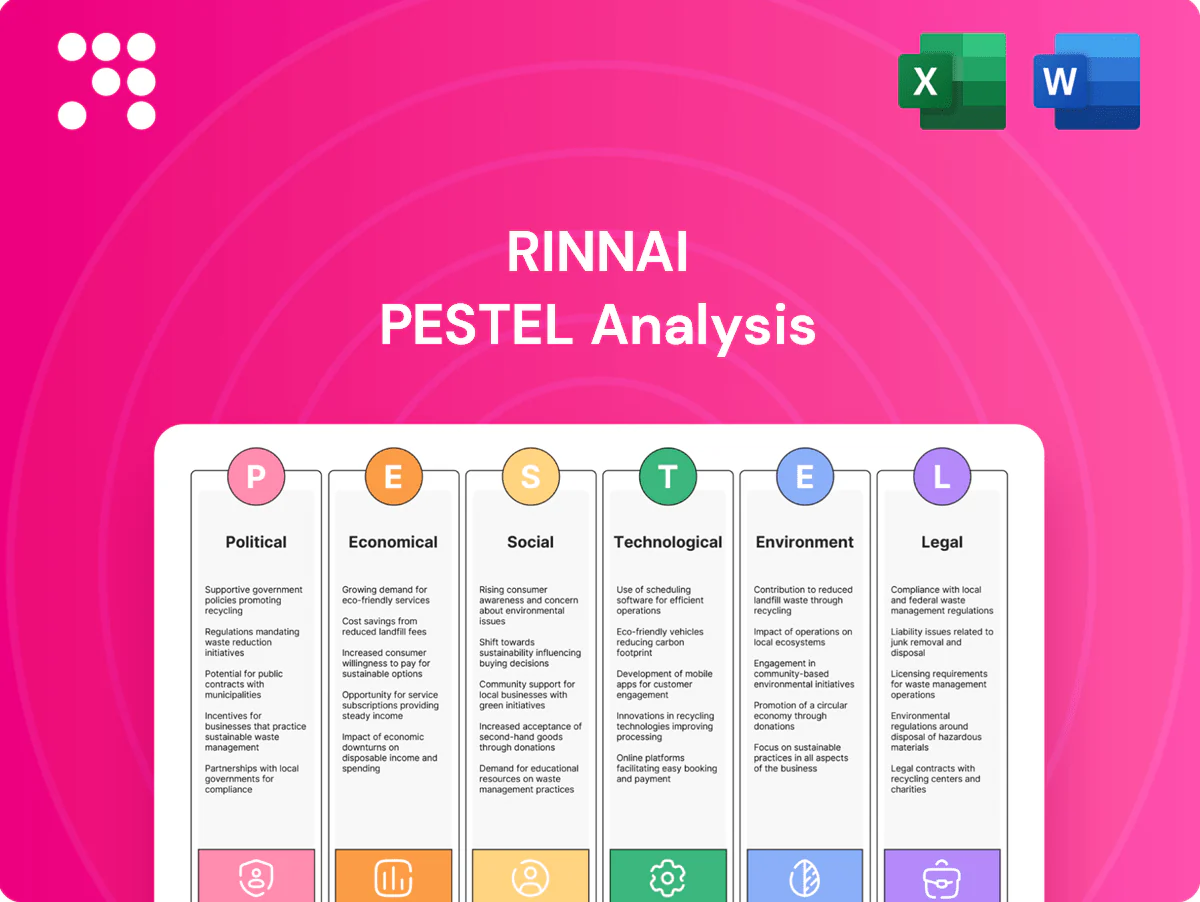
Rinnai PESTLE Analysis

Make Smarter Strategic Decisions with a Complete PESTEL View
Unlock strategic clarity with our PESTLE Analysis of Rinnai—three to five expert-level sentences that reveal how political, economic, social, technological, legal, and environmental forces shape the company’s trajectory. Ideal for investors and strategists, it’s concise yet actionable. Purchase the full report to get the complete, editable breakdown instantly.
Political factors

Decarbonization policies and energy transition
Governments accelerated net-zero roadmaps and tightened efficiency rules, with buildings responsible for roughly 30% of global energy‑related CO2 (IEA) and the US Inflation Reduction Act committing about 370 billion USD to clean energy incentives. This favors Rinnai’s high‑efficiency condensing and hybrid offerings (>90% seasonal efficiency). Abrupt policy shifts reallocating subsidies to full electrification could pressure gas‑centric lines. Proactive alignment with transition pathways unlocks funding and reduces regulatory risk.
Gas hookup restrictions and electrification mandates
Dozens of cities and regions (eg Berkeley, San Francisco, Vancouver) are limiting new gas hookups or setting electrification targets, curbing growth for traditional gas appliances. This shifts demand toward hybrid, hydrogen-ready and heat-pump-integrated systems, pushing Rinnai to develop jurisdiction-specific product mixes and go-to-market plans. Active advocacy and rigorous compliance planning are essential for market access and protecting revenue streams.

Trade policy, tariffs, and local content rules
Tariffs such as US steel tariffs of 25% and Section 301 tariffs up to 25% on some Chinese electronics raise BOM costs for heaters and boilers, especially as LME copper averaged about 9,800 USD/ton in 2024. Localization incentives and 20–40% local content rules in markets like India and Indonesia push Rinnai toward regional assembly. Trade tensions lengthen lead times and drive multi-sourcing strategies, while strategic footprint optimization buffers margin volatility.

Geopolitical supply chain risks
Geopolitical conflicts and sanctions since 2022 have intermittently disrupted component flows, logistics and pushed energy costs higher—energy shocks peaked ~30% in 2022 and remained about 10% above 2019 levels through 2024, raising manufacturing margins for appliance makers like Rinnai. Multi-region manufacturing and supplier diversification lower exposure, while maintaining critical inventory and flexible routing preserves output. Robust business continuity plans sustain service levels and warranty support across markets.
- Impact: energy ~+10% vs 2019 (2024)
- Mitigation: multi-region production, supplier diversification
- Operational: critical inventory, flexible routing, business continuity plans
Public procurement and stimulus programs
Government retrofit, resilience upgrade and efficiency rebate programs materially lift commercial and residential demand for high-efficiency water heating and HVAC; US Inflation Reduction Act programs totalled about 369 billion USD in clean energy tax credits and incentives, while the EU Recovery and Resilience Facility totals 723.8 billion EUR, both channeling funds into building upgrades. Spec alignment and pre-qualification unlock access to these tenders, and bids strengthened by quantified lifecycle savings win higher award rates; timely certification and documentation are often decisive.
- Programs: IRA 369 billion USD, RRF 723.8 billion EUR
- Key actions: spec alignment, pre-qualification
- Bid wins: demonstrate lifecycle savings
- Decisive: on-time certification/documentation
Net-zero incentives lift efficiency demand; tariffs and copper hikes squeeze costs
Net‑zero rules and incentives (IEA: buildings ~30% CO2; IRA ~370bn USD; EU RRF 723.8bn EUR) favor Rinnai’s high‑efficiency/hybrid lines, while gas‑ban ordinances and full‑electrification subsidy shifts threaten gas products. Tariffs (US steel/Section 301 up to 25%) and 2024 LME copper ~9,800 USD/ton raise BOM; energy costs ~+10% vs 2019. Localization, multi‑sourcing and compliance mitigate exposure.
| Factor | Metric | Implication |
|---|---|---|
| Incentives | IRA 370bn USD, RRF 723.8bn EUR | Demand for efficiency |
| Tariffs | Up to 25% | Higher BOM |
| Commodities | Copper ~9,800 USD/t (2024) | Cost pressure |
What is included in the product
 Detailed Word Document
Explores how Political, Economic, Social, Technological, Environmental and Legal forces uniquely impact Rinnai’s heating, water-heating and energy solutions, with each section backed by up-to-date data and industry trends; designed to help executives, consultants and investors identify risks, opportunities and strategic responses. The analysis includes detailed sub-points, forward-looking scenarios and practical implications for market positioning and regulatory compliance.

 Customizable Excel Spreadsheet
Provides a concise, shareable PESTLE summary of Rinnai's external risks and market positioning, ideal for quick alignment in planning sessions and presentations.
Economic factors

Commodity and energy price volatility
Steel (HRC ~US$700/t), aluminum (~US$2,300/t), copper (~US$9,000/t) and gas (Henry Hub ~US$3/MMBtu in 2024) swings directly lift Rinnai’s COGS and lengthen end-user payback periods. Active hedging and design-to-cost reduce input-cost exposure and preserve margins. Energy-efficient models gain share as gas/electric price spikes increase operating-cost savings, and transparent TCO messaging supports price realization.
Exchange rates and global revenue mix
With overseas sales around 60% of revenue (FY2023), Yen, USD, AUD and EUR swings materially affect translation and sourcing costs; USD/JPY hovered near 150 in 2024–mid‑2025, amplifying translation exposure. Natural hedges from local procurement and local currency pricing in markets like Australia and the US help stabilize earnings. Currency‑sensitive markets require tiered offerings and continuous FX monitoring to support agile pricing.

Housing cycles and capex sensitivity
New builds drive unit volumes while remodels and replacements steady aftermarket demand. Higher interest rates (US fed funds ~5.25–5.50% in 2024–25) can delay installations, shifting demand toward maintenance and service. US housing starts averaged about 1.4M in 2024 (U.S. Census), and commercial demand follows business investment and tourism (UNWTO: 2024 arrivals ~90% of 2019 levels). A balanced channel mix cushions downturns.

Inflation and consumer purchasing power
Inflation (US CPI 2024: 3.4%) compresses consumer discretionary spend and pressures installers to accept lower effective labor rates as households prioritize essentials.
Rinnai can protect throughput with value-engineered product lines and point-of-sale financing; premium high-efficiency models still compete on lifetime bill savings, often yielding payback in 2–5 years depending on fuel costs.
Clear ROI propositions and financing-backed offers accelerate purchase decisions, offsetting short-term demand softness.
- Inflation 2024: US CPI 3.4%
- Payback for premium units: typically 2–5 years
- Strategies: value-engineering, financing, ROI messaging
Service, parts, and recurring revenue
Rinnai's large installed base drives steady parts and maintenance income, supporting predictable aftermarket cash flow and margin resilience.
Predictive servicing and extended warranties improve retention by reducing unexpected failures, while reliable spare-part availability limits customer churn to competitors.
Digital platforms and connected diagnostics increase lifetime value through subscription services and remote troubleshooting.
- Installed base: stable aftermarket income
- Predictive service: higher retention
- Spares availability: lowers churn
- Digital platforms: boost LTV
Net-zero incentives lift efficiency demand; tariffs and copper hikes squeeze costs
Raw-material and gas swings (HRC ~US$700/t, Al ~US$2,300/t, Cu ~US$9,000/t, Henry Hub ~US$3/MMBtu in 2024) lift COGS and lengthen payback; hedging and design-to-cost protect margins. FX (USD/JPY ~150 in 2024–mid‑2025) and 60% overseas revenue amplify translation risk, offset by local sourcing. Higher rates (FFR ~5.25–5.50%) and CPI 3.4% curb new installs; financing and ROI messaging shorten buyer payback (2–5 yrs).
| Metric | 2024–25 |
|---|---|
| Overseas rev | ~60% (FY2023) |
| USD/JPY | ~150 |
| Fed funds | 5.25–5.50% |
| CPI (US) | 3.4% |
What You See Is What You Get
Rinnai PESTLE Analysis
The preview shown here is the exact Rinnai PESTLE Analysis you’ll receive after purchase—fully formatted and ready to use. It delivers detailed Political, Economic, Social, Technological, Legal and Environmental insights specific to Rinnai, with no placeholders or teasers. The layout, content and structure visible here are exactly what you’ll download immediately after checkout.

Original: $10.00
-65%$10.00
$3.50Product Information
Product Information
Shipping & Returns
Shipping & Returns
Description
Make Smarter Strategic Decisions with a Complete PESTEL View
Unlock strategic clarity with our PESTLE Analysis of Rinnai—three to five expert-level sentences that reveal how political, economic, social, technological, legal, and environmental forces shape the company’s trajectory. Ideal for investors and strategists, it’s concise yet actionable. Purchase the full report to get the complete, editable breakdown instantly.
Political factors
Decarbonization policies and energy transition
Governments accelerated net-zero roadmaps and tightened efficiency rules, with buildings responsible for roughly 30% of global energy‑related CO2 (IEA) and the US Inflation Reduction Act committing about 370 billion USD to clean energy incentives. This favors Rinnai’s high‑efficiency condensing and hybrid offerings (>90% seasonal efficiency). Abrupt policy shifts reallocating subsidies to full electrification could pressure gas‑centric lines. Proactive alignment with transition pathways unlocks funding and reduces regulatory risk.
Gas hookup restrictions and electrification mandates
Dozens of cities and regions (eg Berkeley, San Francisco, Vancouver) are limiting new gas hookups or setting electrification targets, curbing growth for traditional gas appliances. This shifts demand toward hybrid, hydrogen-ready and heat-pump-integrated systems, pushing Rinnai to develop jurisdiction-specific product mixes and go-to-market plans. Active advocacy and rigorous compliance planning are essential for market access and protecting revenue streams.
Trade policy, tariffs, and local content rules
Tariffs such as US steel tariffs of 25% and Section 301 tariffs up to 25% on some Chinese electronics raise BOM costs for heaters and boilers, especially as LME copper averaged about 9,800 USD/ton in 2024. Localization incentives and 20–40% local content rules in markets like India and Indonesia push Rinnai toward regional assembly. Trade tensions lengthen lead times and drive multi-sourcing strategies, while strategic footprint optimization buffers margin volatility.
Geopolitical supply chain risks
Geopolitical conflicts and sanctions since 2022 have intermittently disrupted component flows, logistics and pushed energy costs higher—energy shocks peaked ~30% in 2022 and remained about 10% above 2019 levels through 2024, raising manufacturing margins for appliance makers like Rinnai. Multi-region manufacturing and supplier diversification lower exposure, while maintaining critical inventory and flexible routing preserves output. Robust business continuity plans sustain service levels and warranty support across markets.
- Impact: energy ~+10% vs 2019 (2024)
- Mitigation: multi-region production, supplier diversification
- Operational: critical inventory, flexible routing, business continuity plans
Public procurement and stimulus programs
Government retrofit, resilience upgrade and efficiency rebate programs materially lift commercial and residential demand for high-efficiency water heating and HVAC; US Inflation Reduction Act programs totalled about 369 billion USD in clean energy tax credits and incentives, while the EU Recovery and Resilience Facility totals 723.8 billion EUR, both channeling funds into building upgrades. Spec alignment and pre-qualification unlock access to these tenders, and bids strengthened by quantified lifecycle savings win higher award rates; timely certification and documentation are often decisive.
- Programs: IRA 369 billion USD, RRF 723.8 billion EUR
- Key actions: spec alignment, pre-qualification
- Bid wins: demonstrate lifecycle savings
- Decisive: on-time certification/documentation
Net-zero incentives lift efficiency demand; tariffs and copper hikes squeeze costs
Net‑zero rules and incentives (IEA: buildings ~30% CO2; IRA ~370bn USD; EU RRF 723.8bn EUR) favor Rinnai’s high‑efficiency/hybrid lines, while gas‑ban ordinances and full‑electrification subsidy shifts threaten gas products. Tariffs (US steel/Section 301 up to 25%) and 2024 LME copper ~9,800 USD/ton raise BOM; energy costs ~+10% vs 2019. Localization, multi‑sourcing and compliance mitigate exposure.
| Factor | Metric | Implication |
|---|---|---|
| Incentives | IRA 370bn USD, RRF 723.8bn EUR | Demand for efficiency |
| Tariffs | Up to 25% | Higher BOM |
| Commodities | Copper ~9,800 USD/t (2024) | Cost pressure |
What is included in the product
Detailed Word Document
Explores how Political, Economic, Social, Technological, Environmental and Legal forces uniquely impact Rinnai’s heating, water-heating and energy solutions, with each section backed by up-to-date data and industry trends; designed to help executives, consultants and investors identify risks, opportunities and strategic responses. The analysis includes detailed sub-points, forward-looking scenarios and practical implications for market positioning and regulatory compliance.
Customizable Excel Spreadsheet
Provides a concise, shareable PESTLE summary of Rinnai's external risks and market positioning, ideal for quick alignment in planning sessions and presentations.
Economic factors
Commodity and energy price volatility
Steel (HRC ~US$700/t), aluminum (~US$2,300/t), copper (~US$9,000/t) and gas (Henry Hub ~US$3/MMBtu in 2024) swings directly lift Rinnai’s COGS and lengthen end-user payback periods. Active hedging and design-to-cost reduce input-cost exposure and preserve margins. Energy-efficient models gain share as gas/electric price spikes increase operating-cost savings, and transparent TCO messaging supports price realization.
Exchange rates and global revenue mix
With overseas sales around 60% of revenue (FY2023), Yen, USD, AUD and EUR swings materially affect translation and sourcing costs; USD/JPY hovered near 150 in 2024–mid‑2025, amplifying translation exposure. Natural hedges from local procurement and local currency pricing in markets like Australia and the US help stabilize earnings. Currency‑sensitive markets require tiered offerings and continuous FX monitoring to support agile pricing.
Housing cycles and capex sensitivity
New builds drive unit volumes while remodels and replacements steady aftermarket demand. Higher interest rates (US fed funds ~5.25–5.50% in 2024–25) can delay installations, shifting demand toward maintenance and service. US housing starts averaged about 1.4M in 2024 (U.S. Census), and commercial demand follows business investment and tourism (UNWTO: 2024 arrivals ~90% of 2019 levels). A balanced channel mix cushions downturns.
Inflation and consumer purchasing power
Inflation (US CPI 2024: 3.4%) compresses consumer discretionary spend and pressures installers to accept lower effective labor rates as households prioritize essentials.
Rinnai can protect throughput with value-engineered product lines and point-of-sale financing; premium high-efficiency models still compete on lifetime bill savings, often yielding payback in 2–5 years depending on fuel costs.
Clear ROI propositions and financing-backed offers accelerate purchase decisions, offsetting short-term demand softness.
- Inflation 2024: US CPI 3.4%
- Payback for premium units: typically 2–5 years
- Strategies: value-engineering, financing, ROI messaging
Service, parts, and recurring revenue
Rinnai's large installed base drives steady parts and maintenance income, supporting predictable aftermarket cash flow and margin resilience.
Predictive servicing and extended warranties improve retention by reducing unexpected failures, while reliable spare-part availability limits customer churn to competitors.
Digital platforms and connected diagnostics increase lifetime value through subscription services and remote troubleshooting.
- Installed base: stable aftermarket income
- Predictive service: higher retention
- Spares availability: lowers churn
- Digital platforms: boost LTV
Net-zero incentives lift efficiency demand; tariffs and copper hikes squeeze costs
Raw-material and gas swings (HRC ~US$700/t, Al ~US$2,300/t, Cu ~US$9,000/t, Henry Hub ~US$3/MMBtu in 2024) lift COGS and lengthen payback; hedging and design-to-cost protect margins. FX (USD/JPY ~150 in 2024–mid‑2025) and 60% overseas revenue amplify translation risk, offset by local sourcing. Higher rates (FFR ~5.25–5.50%) and CPI 3.4% curb new installs; financing and ROI messaging shorten buyer payback (2–5 yrs).
| Metric | 2024–25 |
|---|---|
| Overseas rev | ~60% (FY2023) |
| USD/JPY | ~150 |
| Fed funds | 5.25–5.50% |
| CPI (US) | 3.4% |
What You See Is What You Get
Rinnai PESTLE Analysis
The preview shown here is the exact Rinnai PESTLE Analysis you’ll receive after purchase—fully formatted and ready to use. It delivers detailed Political, Economic, Social, Technological, Legal and Environmental insights specific to Rinnai, with no placeholders or teasers. The layout, content and structure visible here are exactly what you’ll download immediately after checkout.











