Ribbon PESTLE Analysis

Your Competitive Advantage Starts with This Report
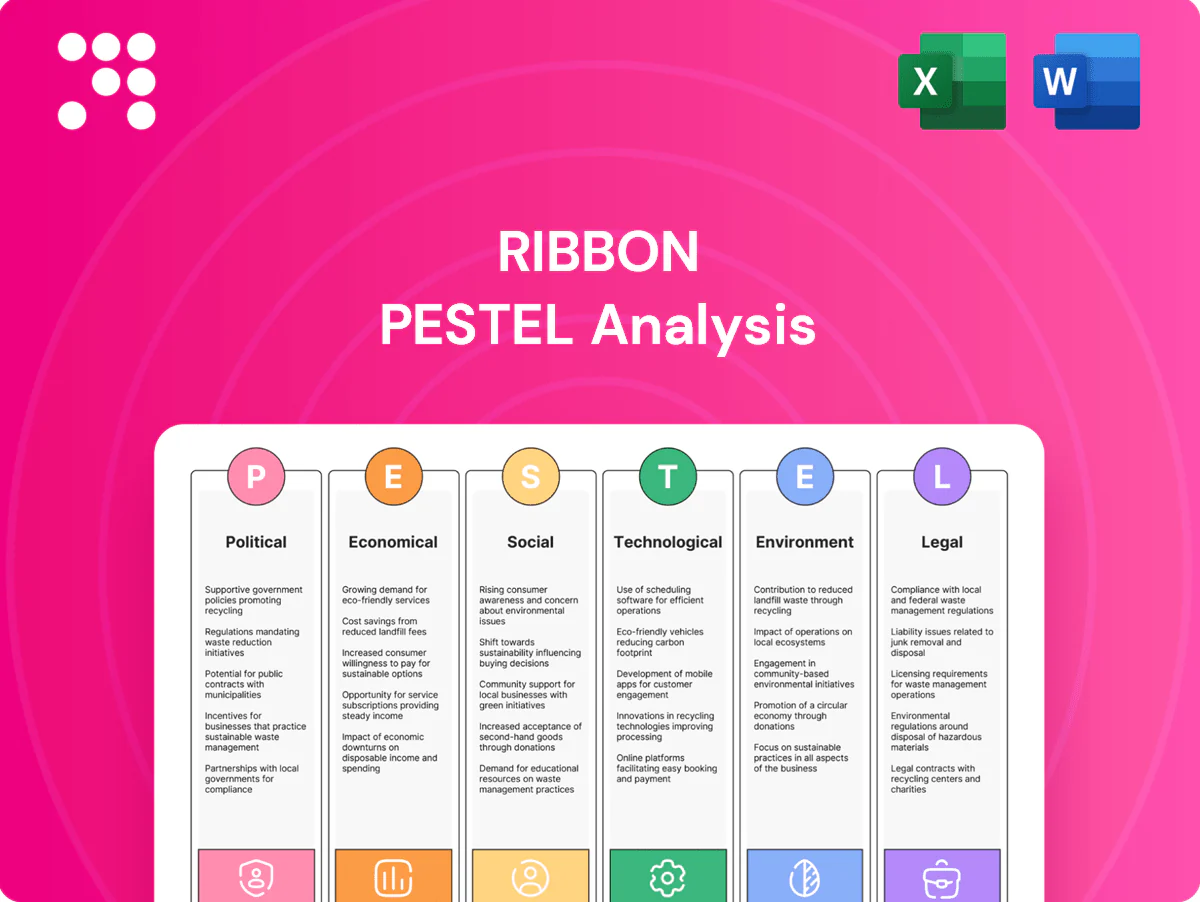
Unlock how political, economic, social, technological, legal, and environmental forces are shaping Ribbon's trajectory with our concise PESTLE overview. This snapshot reveals key risks and opportunities you can act on today. Purchase the full analysis for the complete, editable report and strategic recommendations.
Political factors

Spectrum and telecom policy
National spectrum allocation, net neutrality and universal service rules drive carriers’ investment timing—global telecom capex was about $260B in 2024 and major spectrum auctions (eg US C‑band $81B) redirect spend. Favorable policy can accelerate optical backbone and voice‑core upgrades deployable with Ribbon solutions; adverse regulation may delay procurements or force feature changes. Continuous monitoring of ITU (WRC‑23) and national telecom directives is essential.
Geopolitics and vendor trust
Geopolitical tensions shape approved vendor lists for critical infrastructure; by 2024 more than 30 countries had procurement restrictions targeting specific foreign telecom suppliers, reshaping market access. Government security vetting can open or close markets for real-time communications gear, while sanctions and country bans have rerouted supply chains and sales channels. Maintaining neutral, security-certified positioning (FIPS/NCSC/CSA attestations) reduces country risk and preserves contract eligibility.

Public sector modernization
Government funding for emergency services, defense and smart infrastructure—NATO defense spending hit about $1.3 trillion in 2023 and U.S. federal procurement exceeded $600 billion in 2023—drives demand for secure voice/video networks. Procurement cycles are long but sizable, favoring vendors with compliant, interoperable platforms. Ribbon can align to public safety standards and certifications to win tenders. The $65 billion IIJA broadband push expands addressable markets.

Trade and tariffs
Tariffs on electronics — including US Section 301 duties on roughly $370B of Chinese goods with rates up to 25% — and new cross-border software rules (EU DMA effective 2024) pressure pricing and margins; export documentation and customs delays (commonly 3–10 days) raise lead times for hardware platforms. Trade agreements (USMCA, CPTPP) lower friction for rollouts; diversified manufacturing and regional inventory buffers cut disruption risk.
- Tariffs: up to 25% on ~$370B
- Cross-border rules: EU DMA 2024
- Customs delays: 3–10 days
- Mitigation: diversified manufacturing, regional buffers
Data localization mandates
Governments increasingly require in-country handling for telecom traffic; over 60 countries had data localization rules by 2024. Cloud communications must deploy regional instances or sovereign cloud options, raising architecture complexity and partner reliance and likely increasing cost-to-serve ~10–25%. Compliance unlocks contracts in regulated sectors such as utilities and public safety.
- scope: 60+ countries (2024)
- cost impact: +10–25% TCO
- opportunity: utilities, public safety procurements
Spectrum, auctions & procurement drive carriers (global capex $260B)
Spectrum policy, net neutrality and auction timing (global telecom capex ~$260B in 2024; US C‑band ~$81B) drive carrier buy cycles and Ribbon deployment cadence. Vendor bans and security vetting (30+ countries restricting suppliers by 2024) plus sanctions reshape market access. Public procurement and defense spend (NATO ~$1.3T 2023; US federal ~$600B 2023) expand demand for compliant, secure comms; data localization (60+ countries) raises TCO +10–25%.
| Metric | Value |
|---|---|
| Global telecom capex (2024) | $260B |
| Major auction (US C‑band) | $81B |
| Countries with vendor restrictions (2024) | 30+ |
| NATO defense spend (2023) | $1.3T |
| US federal procurement (2023) | $600B |
| IIJA broadband | $65B |
| Tariffs (Section 301) | up to 25% on ~$370B |
| Data localization (2024) | 60+ countries; +10–25% TCO |
| Customs delays | 3–10 days |
What is included in the product
 Detailed Word Document
Provides a compact PESTLE evaluation of the Ribbon, examining Political, Economic, Social, Technological, Environmental and Legal forces and how they uniquely impact its industry and region. Data-backed and forward-looking, the analysis is tailored for executives, consultants and investors and delivered in clean, insert-ready format to support strategy, scenario planning and funding discussions.

 Customizable Excel Spreadsheet
Ribbon's PESTLE Analysis condenses complex external factors into a visually segmented, editable summary ideal for drop‑in slides or quick team alignment, letting users add context-specific notes and speed decision-making during planning and client discussions.
Economic factors

Carrier capex cycles
Service-provider capex in IP optical, 5G cores and voice modernization drives volatile demand; global operator capex runs roughly US$300–350B p.a. (2023–25) so macro slowdowns commonly defer upgrades while growth phases accelerate orders. Ribbon’s multi-year framework agreements help smooth revenue streams, and alignment with cost-saving TDM-to-IP migrations supports more resilient, recurring demand.
Interest rates and financing
Higher interest rates (Fed funds 5.25–5.50% in mid‑2025, 10‑yr Treasury ~4.2%) raise carriers’ WACC and project hurdle rates, delaying large network rollouts. Leasing and as‑a‑service models relieve upfront capex pressure and make projects financeable. Ribbon’s flexible pricing and cloud options let customers shift spend to opex, and rate stability improves visibility and backlog conversion.

FX and global exposure
Revenue and costs across currencies create translation and transaction risk for Ribbon, with the US dollar index (DXY) averaging about 105 in 2024, amplifying FX swings.
Dollar strength pressures international sales and price competitiveness, particularly in EMEA and LATAM markets where pricing elasticity is higher.
Active hedging programs and localized pricing strategies mitigate volatility, while regional supply and support centers reduce FX-driven cost exposure.

Price competition
Comms and optical markets face aggressive price competition from incumbents and low‑cost vendors; pluggable coherent transceiver ASPs declined about 20% year‑over‑year in 2023–24, compressing hardware margins. Differentiation through security, interoperability and automation offsets pure discounting and supports premium positioning. Bundled software and subscription models, with recurring revenue often 20–40% of vendor revenues in 2024, protect margins. Clear TCO proof pointsWin value‑based bids versus low‑price offers.
- Price pressure: transceiver ASPs -20% (2023–24)
- Recurring revenue: 20–40% of vendor revenue (2024)
- Differentiators: security, interoperability, automation
- Sales lever: TCO proof points for value bids
Industry consolidation
Industry consolidation among carriers and vendors is reshaping procurement and standards; 2024 telecom M&A deal value topped $100 billion, concentrating buying power and accelerating vendor rationalization. Fewer buyers often mean larger deal sizes, while integration phases can temporarily slow orders yet create refresh cycles and upgrade budgets.
- Fewer buyers → larger contracts
- Integration lag → short-term order dips, long-term refreshes
- Cross-ecosystem partners ensure continuity during transitions
Spectrum, auctions & procurement drive carriers (global capex $260B)
Operator capex ~US$300–350B (2023–25) drives lumpy demand; Ribbon’s multi‑year deals smooth revenue. Fed funds 5.25–5.50% (mid‑2025) and 10yr ~4.2% raise WACC, favoring opex models; DXY ~105 (2024) and FX hedges affect margins. Transceiver ASPs -20% (2023–24); recurring revenue 20–40% (2024) cushions price pressure; 2024 telecom M&A >US$100B concentrates procurement.
| Metric | Value |
|---|---|
| Operator capex | US$300–350B |
| Fed funds | 5.25–5.50% |
What You See Is What You Get
Ribbon PESTLE Analysis
The preview shown here is the exact Ribbon PESTLE Analysis you’ll receive after purchase—fully formatted, professionally structured, and ready to use. The content, layout, and insights visible in this sample are identical to the downloadable file delivered immediately upon payment. No placeholders or teasers—this is the real, finished document you’ll own after checkout.

Product Information
Product Information
Shipping & Returns
Shipping & Returns
Description
Your Competitive Advantage Starts with This Report
Unlock how political, economic, social, technological, legal, and environmental forces are shaping Ribbon's trajectory with our concise PESTLE overview. This snapshot reveals key risks and opportunities you can act on today. Purchase the full analysis for the complete, editable report and strategic recommendations.
Political factors
Spectrum and telecom policy
National spectrum allocation, net neutrality and universal service rules drive carriers’ investment timing—global telecom capex was about $260B in 2024 and major spectrum auctions (eg US C‑band $81B) redirect spend. Favorable policy can accelerate optical backbone and voice‑core upgrades deployable with Ribbon solutions; adverse regulation may delay procurements or force feature changes. Continuous monitoring of ITU (WRC‑23) and national telecom directives is essential.
Geopolitics and vendor trust
Geopolitical tensions shape approved vendor lists for critical infrastructure; by 2024 more than 30 countries had procurement restrictions targeting specific foreign telecom suppliers, reshaping market access. Government security vetting can open or close markets for real-time communications gear, while sanctions and country bans have rerouted supply chains and sales channels. Maintaining neutral, security-certified positioning (FIPS/NCSC/CSA attestations) reduces country risk and preserves contract eligibility.
Public sector modernization
Government funding for emergency services, defense and smart infrastructure—NATO defense spending hit about $1.3 trillion in 2023 and U.S. federal procurement exceeded $600 billion in 2023—drives demand for secure voice/video networks. Procurement cycles are long but sizable, favoring vendors with compliant, interoperable platforms. Ribbon can align to public safety standards and certifications to win tenders. The $65 billion IIJA broadband push expands addressable markets.
Trade and tariffs
Tariffs on electronics — including US Section 301 duties on roughly $370B of Chinese goods with rates up to 25% — and new cross-border software rules (EU DMA effective 2024) pressure pricing and margins; export documentation and customs delays (commonly 3–10 days) raise lead times for hardware platforms. Trade agreements (USMCA, CPTPP) lower friction for rollouts; diversified manufacturing and regional inventory buffers cut disruption risk.
- Tariffs: up to 25% on ~$370B
- Cross-border rules: EU DMA 2024
- Customs delays: 3–10 days
- Mitigation: diversified manufacturing, regional buffers
Data localization mandates
Governments increasingly require in-country handling for telecom traffic; over 60 countries had data localization rules by 2024. Cloud communications must deploy regional instances or sovereign cloud options, raising architecture complexity and partner reliance and likely increasing cost-to-serve ~10–25%. Compliance unlocks contracts in regulated sectors such as utilities and public safety.
- scope: 60+ countries (2024)
- cost impact: +10–25% TCO
- opportunity: utilities, public safety procurements
Spectrum, auctions & procurement drive carriers (global capex $260B)
Spectrum policy, net neutrality and auction timing (global telecom capex ~$260B in 2024; US C‑band ~$81B) drive carrier buy cycles and Ribbon deployment cadence. Vendor bans and security vetting (30+ countries restricting suppliers by 2024) plus sanctions reshape market access. Public procurement and defense spend (NATO ~$1.3T 2023; US federal ~$600B 2023) expand demand for compliant, secure comms; data localization (60+ countries) raises TCO +10–25%.
| Metric | Value |
|---|---|
| Global telecom capex (2024) | $260B |
| Major auction (US C‑band) | $81B |
| Countries with vendor restrictions (2024) | 30+ |
| NATO defense spend (2023) | $1.3T |
| US federal procurement (2023) | $600B |
| IIJA broadband | $65B |
| Tariffs (Section 301) | up to 25% on ~$370B |
| Data localization (2024) | 60+ countries; +10–25% TCO |
| Customs delays | 3–10 days |
What is included in the product
Detailed Word Document
Provides a compact PESTLE evaluation of the Ribbon, examining Political, Economic, Social, Technological, Environmental and Legal forces and how they uniquely impact its industry and region. Data-backed and forward-looking, the analysis is tailored for executives, consultants and investors and delivered in clean, insert-ready format to support strategy, scenario planning and funding discussions.
Customizable Excel Spreadsheet
Ribbon's PESTLE Analysis condenses complex external factors into a visually segmented, editable summary ideal for drop‑in slides or quick team alignment, letting users add context-specific notes and speed decision-making during planning and client discussions.
Economic factors
Carrier capex cycles
Service-provider capex in IP optical, 5G cores and voice modernization drives volatile demand; global operator capex runs roughly US$300–350B p.a. (2023–25) so macro slowdowns commonly defer upgrades while growth phases accelerate orders. Ribbon’s multi-year framework agreements help smooth revenue streams, and alignment with cost-saving TDM-to-IP migrations supports more resilient, recurring demand.
Interest rates and financing
Higher interest rates (Fed funds 5.25–5.50% in mid‑2025, 10‑yr Treasury ~4.2%) raise carriers’ WACC and project hurdle rates, delaying large network rollouts. Leasing and as‑a‑service models relieve upfront capex pressure and make projects financeable. Ribbon’s flexible pricing and cloud options let customers shift spend to opex, and rate stability improves visibility and backlog conversion.
FX and global exposure
Revenue and costs across currencies create translation and transaction risk for Ribbon, with the US dollar index (DXY) averaging about 105 in 2024, amplifying FX swings.
Dollar strength pressures international sales and price competitiveness, particularly in EMEA and LATAM markets where pricing elasticity is higher.
Active hedging programs and localized pricing strategies mitigate volatility, while regional supply and support centers reduce FX-driven cost exposure.
Price competition
Comms and optical markets face aggressive price competition from incumbents and low‑cost vendors; pluggable coherent transceiver ASPs declined about 20% year‑over‑year in 2023–24, compressing hardware margins. Differentiation through security, interoperability and automation offsets pure discounting and supports premium positioning. Bundled software and subscription models, with recurring revenue often 20–40% of vendor revenues in 2024, protect margins. Clear TCO proof pointsWin value‑based bids versus low‑price offers.
- Price pressure: transceiver ASPs -20% (2023–24)
- Recurring revenue: 20–40% of vendor revenue (2024)
- Differentiators: security, interoperability, automation
- Sales lever: TCO proof points for value bids
Industry consolidation
Industry consolidation among carriers and vendors is reshaping procurement and standards; 2024 telecom M&A deal value topped $100 billion, concentrating buying power and accelerating vendor rationalization. Fewer buyers often mean larger deal sizes, while integration phases can temporarily slow orders yet create refresh cycles and upgrade budgets.
- Fewer buyers → larger contracts
- Integration lag → short-term order dips, long-term refreshes
- Cross-ecosystem partners ensure continuity during transitions
Spectrum, auctions & procurement drive carriers (global capex $260B)
Operator capex ~US$300–350B (2023–25) drives lumpy demand; Ribbon’s multi‑year deals smooth revenue. Fed funds 5.25–5.50% (mid‑2025) and 10yr ~4.2% raise WACC, favoring opex models; DXY ~105 (2024) and FX hedges affect margins. Transceiver ASPs -20% (2023–24); recurring revenue 20–40% (2024) cushions price pressure; 2024 telecom M&A >US$100B concentrates procurement.
| Metric | Value |
|---|---|
| Operator capex | US$300–350B |
| Fed funds | 5.25–5.50% |
What You See Is What You Get
Ribbon PESTLE Analysis
The preview shown here is the exact Ribbon PESTLE Analysis you’ll receive after purchase—fully formatted, professionally structured, and ready to use. The content, layout, and insights visible in this sample are identical to the downloadable file delivered immediately upon payment. No placeholders or teasers—this is the real, finished document you’ll own after checkout.











