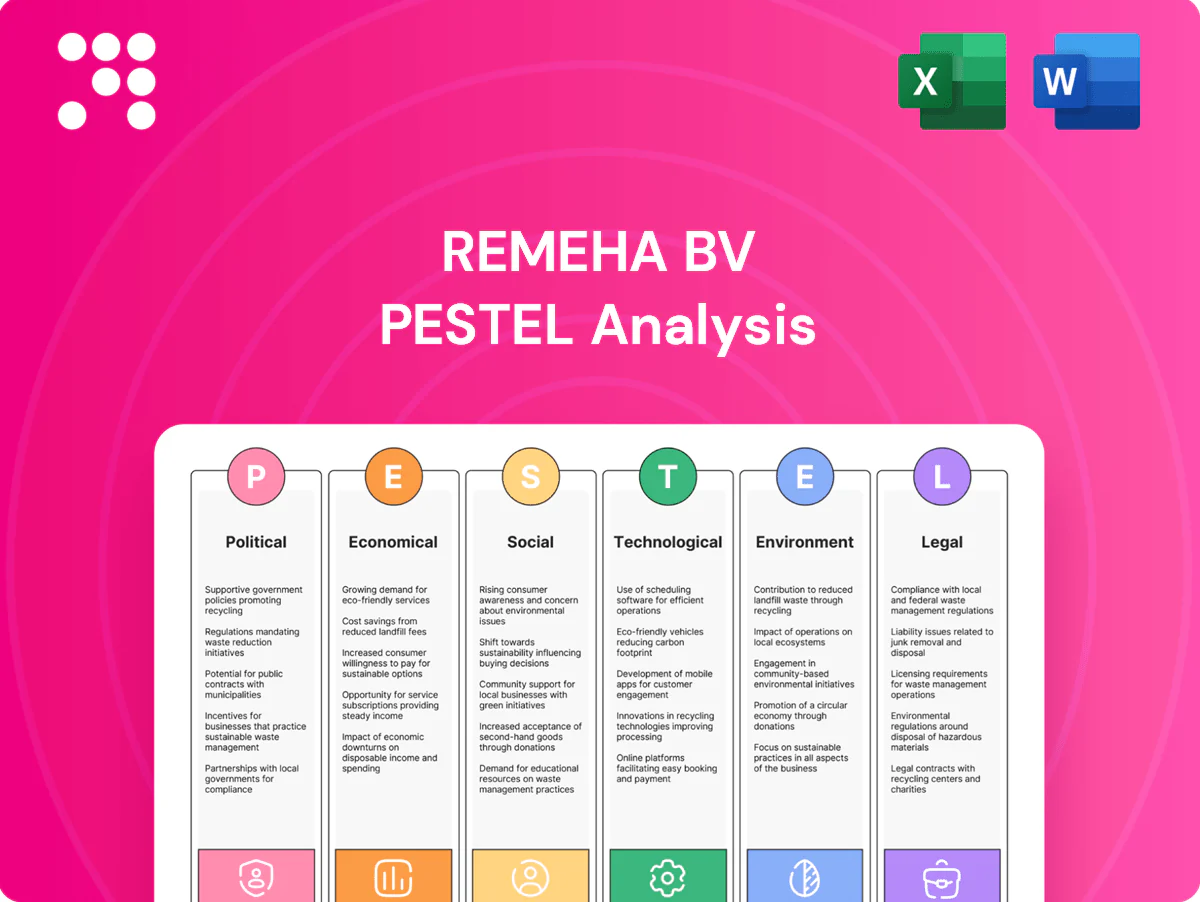
Remeha BV PESTLE Analysis

Your Competitive Advantage Starts with This Report
Unlock strategic foresight with our PESTLE Analysis of Remeha BV—concise, current, and tailored to real-world decision-making. Learn how political shifts, economic trends, and tech disruption affect growth and risk. Ideal for investors and strategists seeking actionable intelligence. Purchase the full report to download editable, board-ready insights instantly.
Political factors

EU Green Deal and national decarbonization targets
EU Green Deal and Fit for 55 (at least 55% GHG cut by 2030) plus Dutch decarbonisation commitments meaningfully shape Remeha’s portfolio, given buildings account for about 40% of EU energy use. Tightening targets accelerate demand for high‑efficiency boilers and heat pumps, supporting long‑term product roadmaps and R&D investments. Policy certainty (EU and NL roadmaps to 2030–2050) de‑risk multi‑year planning, while political shifts could change subsidy intensity and rollout timelines.
Subsidies and incentives for heat pumps and hybrids
Grant schemes and tax credits—for example the UK Boiler Upgrade Scheme offering £5,000 per heat pump—push customers toward low-carbon systems and make hybrid solutions commercially attractive for Remeha. EU policy targets (30 million heat pumps by 2030) increase market opportunity; incentive design shapes payback narratives and channel push. Complexity of programs demands strong sales enablement and installer guidance to capture uptake.

Public procurement and social housing policies
EU Renovation Wave aims to at least double renovation rates by 2030 and NextGenerationEU mobilises about €800 billion, creating sizable retrofit tenders for efficient heating. Dutch social housing stock of roughly 2.4 million homes often sets de facto technical baselines that favor compliant solutions. Remeha benefits from scalable, regulation-aligned heating systems, but public procurement cycles remain lengthy and politically sensitive, slowing order visibility.

Energy security and diversification priorities
- H2 target: EU aiming ~10 Mt hydrogen by 2030
- Gas import shift: Russia share ~8% in 2024
- Market sensitivity: TTF volatility drove rapid product reallocation
Building codes and municipal climate plans
Local building codes set minimum efficiency and technology choices at point of install; municipal heat planning drives district heating uptake versus individual systems, with around 12% of EU households on district heating (Eurostat 2022). Remeha must navigate heterogeneous rules across regions and prioritize early engagement to influence specifications and approvals.
- Local codes determine tech/efficiency
- Heat planning shapes district vs individual (≈12% EU)
- Heterogeneous regional rules increase compliance costs
- Early engagement improves approval odds
EU targets and grants accelerate heat pump, high-efficiency boiler and H2-ready demand
EU Fit for 55 and Dutch decarbonisation steer demand to high‑efficiency boilers, heat pumps and H2‑ready units as buildings account for ~40% of EU energy use. Grants (eg UK Boiler Upgrade Scheme £5,000) and EU 30M heat pump target by 2030 accelerate uptake but subsidy shifts and political cycles add execution risk. Public procurement and local heat plans (≈12% EU on district heating) create uneven demand visibility.
| Metric | Value |
|---|---|
| EU heat pump target 2030 | 30M |
| Russian gas share 2024 | ~8% |
| NGEU funding | €800B |
What is included in the product
 Detailed Word Document
Explores how political, economic, social, technological, environmental and legal forces uniquely affect Remeha BV, with each dimension backed by current data and industry trends to reveal specific risks and opportunities. Designed for executives and advisors, the analysis reflects regional market and regulatory dynamics and includes forward-looking insights ready for business plans, pitch decks, or scenario planning.

 Customizable Excel Spreadsheet
A concise, visually segmented PESTLE summary of Remeha BV that clarifies external risks and market drivers for quick alignment in meetings and presentations, editable for region- or product-specific notes and easily dropped into reports or slides.
Economic factors

Energy price volatility and customer payback
Gas and electricity price swings materially affect total cost of ownership for Remeha customers, highlighted by the Dutch TTF gas peak of about 345 €/MWh in Aug 2022 that drove steep payback variance. Remeha’s value case depends on stable or favorable energy spreads, so presenting scenario and sensitivity analyses (payback under +/-20% fuel price shifts) helps close deals. Hedging via hybrid contracts and fixed/floating mixes reduces buyer uncertainty and smooths projected returns.
Construction cycles and retrofit demand
New-build softness can be offset by deep retrofit programs as the EU estimates about 75% of building stock is energy-inefficient and current renovation rates (~1% pa) are targeted to double under the Renovation Wave. Aging European stock sustains replacement volumes, so Remeha should balance OEM builder channels with retrofit-focused installers to capture retrofit share. Counter-cyclical service and maintenance provide stable recurring revenue streams.

Interest rates and financing availability
Rising rates (ECB average lending rate to non-financial corporations ~4.2% in 2024) lengthen payback on boilers and heat-pump upgrades, slowing discretionary replacements. Vendor or partner financing can unlock projects stalled by higher capital costs. Remeha can partner with lenders and utilities to bundle capital + energy savings; simplified financing terms are a competitive B2C and B2B differentiator.

Supply chain costs and component availability
Compressor, electronics and metals pricing pressured margins—metals input costs rose about 10% YoY in 2023 while compressor OEM prices climbed ~6% in 2024; semiconductor lead times eased to ~12 weeks in 2024, softening electronics cost volatility. Dual-sourcing and localized inventory (EU warehousing +15% in 2024) improved resilience. Design-to-cost and modular platforms protect profitability; transparent lead times sustain installer loyalty and ~5pp higher win rates.
- metals +10% YoY (2023)
- semiconductor lead times ~12 weeks (2024)
- warehousing +15% EU (2024)
Currency and export dynamics
Euro strength (EUR/USD average ~1.09 in 2024) shifts pricing competitiveness in non-euro markets; weakness raises imported component costs and squeezes margins. Export growth diversifies demand beyond Dutch cycles, but Remeha must actively hedge FX in procurement and sales. Local partnerships and regional sourcing cut FX exposure and lower logistics costs.
- EUR/USD 2024 avg ~1.09
- Exports diversify demand
- Hedge procurement/sales FX
- Local partners reduce costs
EU targets and grants accelerate heat pump, high-efficiency boiler and H2-ready demand
Energy-price volatility (TTF peak ~345 €/MWh Aug 2022) and ECB-driven financing costs (avg lending ~4.2% 2024) lengthen paybacks; vendor financing and hedges improve project take-up. Input-costs (metals +10% 2023, semis lead ~12w 2024) and EUR/USD ~1.09 (2024) pressure margins; dual-sourcing, local warehousing +15% (2024) raise resilience.
| Metric | Value |
|---|---|
| TTF peak | ~345 €/MWh (Aug 2022) |
| ECB lending avg | ~4.2% (2024) |
| Metals | +10% YoY (2023) |
| Semis lead | ~12 weeks (2024) |
| Warehousing EU | +15% (2024) |
| EUR/USD | ~1.09 (2024 avg) |
Preview the Actual Deliverable
Remeha BV PESTLE Analysis
The preview shown here is the exact Remeha BV PESTLE Analysis you’ll receive after purchase—fully formatted and ready to use. The content, layout and strategic insights (political, economic, social, technological, legal and environmental) are final and professionally structured. No placeholders or teasers—this is the real file you’ll download instantly after payment.

Original: $10.00
-65%$10.00
$3.50Product Information
Product Information
Shipping & Returns
Shipping & Returns
Description
Your Competitive Advantage Starts with This Report
Unlock strategic foresight with our PESTLE Analysis of Remeha BV—concise, current, and tailored to real-world decision-making. Learn how political shifts, economic trends, and tech disruption affect growth and risk. Ideal for investors and strategists seeking actionable intelligence. Purchase the full report to download editable, board-ready insights instantly.
Political factors
EU Green Deal and national decarbonization targets
EU Green Deal and Fit for 55 (at least 55% GHG cut by 2030) plus Dutch decarbonisation commitments meaningfully shape Remeha’s portfolio, given buildings account for about 40% of EU energy use. Tightening targets accelerate demand for high‑efficiency boilers and heat pumps, supporting long‑term product roadmaps and R&D investments. Policy certainty (EU and NL roadmaps to 2030–2050) de‑risk multi‑year planning, while political shifts could change subsidy intensity and rollout timelines.
Subsidies and incentives for heat pumps and hybrids
Grant schemes and tax credits—for example the UK Boiler Upgrade Scheme offering £5,000 per heat pump—push customers toward low-carbon systems and make hybrid solutions commercially attractive for Remeha. EU policy targets (30 million heat pumps by 2030) increase market opportunity; incentive design shapes payback narratives and channel push. Complexity of programs demands strong sales enablement and installer guidance to capture uptake.
Public procurement and social housing policies
EU Renovation Wave aims to at least double renovation rates by 2030 and NextGenerationEU mobilises about €800 billion, creating sizable retrofit tenders for efficient heating. Dutch social housing stock of roughly 2.4 million homes often sets de facto technical baselines that favor compliant solutions. Remeha benefits from scalable, regulation-aligned heating systems, but public procurement cycles remain lengthy and politically sensitive, slowing order visibility.
Energy security and diversification priorities
- H2 target: EU aiming ~10 Mt hydrogen by 2030
- Gas import shift: Russia share ~8% in 2024
- Market sensitivity: TTF volatility drove rapid product reallocation
Building codes and municipal climate plans
Local building codes set minimum efficiency and technology choices at point of install; municipal heat planning drives district heating uptake versus individual systems, with around 12% of EU households on district heating (Eurostat 2022). Remeha must navigate heterogeneous rules across regions and prioritize early engagement to influence specifications and approvals.
- Local codes determine tech/efficiency
- Heat planning shapes district vs individual (≈12% EU)
- Heterogeneous regional rules increase compliance costs
- Early engagement improves approval odds
EU targets and grants accelerate heat pump, high-efficiency boiler and H2-ready demand
EU Fit for 55 and Dutch decarbonisation steer demand to high‑efficiency boilers, heat pumps and H2‑ready units as buildings account for ~40% of EU energy use. Grants (eg UK Boiler Upgrade Scheme £5,000) and EU 30M heat pump target by 2030 accelerate uptake but subsidy shifts and political cycles add execution risk. Public procurement and local heat plans (≈12% EU on district heating) create uneven demand visibility.
| Metric | Value |
|---|---|
| EU heat pump target 2030 | 30M |
| Russian gas share 2024 | ~8% |
| NGEU funding | €800B |
What is included in the product
Detailed Word Document
Explores how political, economic, social, technological, environmental and legal forces uniquely affect Remeha BV, with each dimension backed by current data and industry trends to reveal specific risks and opportunities. Designed for executives and advisors, the analysis reflects regional market and regulatory dynamics and includes forward-looking insights ready for business plans, pitch decks, or scenario planning.
Customizable Excel Spreadsheet
A concise, visually segmented PESTLE summary of Remeha BV that clarifies external risks and market drivers for quick alignment in meetings and presentations, editable for region- or product-specific notes and easily dropped into reports or slides.
Economic factors
Energy price volatility and customer payback
Gas and electricity price swings materially affect total cost of ownership for Remeha customers, highlighted by the Dutch TTF gas peak of about 345 €/MWh in Aug 2022 that drove steep payback variance. Remeha’s value case depends on stable or favorable energy spreads, so presenting scenario and sensitivity analyses (payback under +/-20% fuel price shifts) helps close deals. Hedging via hybrid contracts and fixed/floating mixes reduces buyer uncertainty and smooths projected returns.
Construction cycles and retrofit demand
New-build softness can be offset by deep retrofit programs as the EU estimates about 75% of building stock is energy-inefficient and current renovation rates (~1% pa) are targeted to double under the Renovation Wave. Aging European stock sustains replacement volumes, so Remeha should balance OEM builder channels with retrofit-focused installers to capture retrofit share. Counter-cyclical service and maintenance provide stable recurring revenue streams.
Interest rates and financing availability
Rising rates (ECB average lending rate to non-financial corporations ~4.2% in 2024) lengthen payback on boilers and heat-pump upgrades, slowing discretionary replacements. Vendor or partner financing can unlock projects stalled by higher capital costs. Remeha can partner with lenders and utilities to bundle capital + energy savings; simplified financing terms are a competitive B2C and B2B differentiator.
Supply chain costs and component availability
Compressor, electronics and metals pricing pressured margins—metals input costs rose about 10% YoY in 2023 while compressor OEM prices climbed ~6% in 2024; semiconductor lead times eased to ~12 weeks in 2024, softening electronics cost volatility. Dual-sourcing and localized inventory (EU warehousing +15% in 2024) improved resilience. Design-to-cost and modular platforms protect profitability; transparent lead times sustain installer loyalty and ~5pp higher win rates.
- metals +10% YoY (2023)
- semiconductor lead times ~12 weeks (2024)
- warehousing +15% EU (2024)
Currency and export dynamics
Euro strength (EUR/USD average ~1.09 in 2024) shifts pricing competitiveness in non-euro markets; weakness raises imported component costs and squeezes margins. Export growth diversifies demand beyond Dutch cycles, but Remeha must actively hedge FX in procurement and sales. Local partnerships and regional sourcing cut FX exposure and lower logistics costs.
- EUR/USD 2024 avg ~1.09
- Exports diversify demand
- Hedge procurement/sales FX
- Local partners reduce costs
EU targets and grants accelerate heat pump, high-efficiency boiler and H2-ready demand
Energy-price volatility (TTF peak ~345 €/MWh Aug 2022) and ECB-driven financing costs (avg lending ~4.2% 2024) lengthen paybacks; vendor financing and hedges improve project take-up. Input-costs (metals +10% 2023, semis lead ~12w 2024) and EUR/USD ~1.09 (2024) pressure margins; dual-sourcing, local warehousing +15% (2024) raise resilience.
| Metric | Value |
|---|---|
| TTF peak | ~345 €/MWh (Aug 2022) |
| ECB lending avg | ~4.2% (2024) |
| Metals | +10% YoY (2023) |
| Semis lead | ~12 weeks (2024) |
| Warehousing EU | +15% (2024) |
| EUR/USD | ~1.09 (2024 avg) |
Preview the Actual Deliverable
Remeha BV PESTLE Analysis
The preview shown here is the exact Remeha BV PESTLE Analysis you’ll receive after purchase—fully formatted and ready to use. The content, layout and strategic insights (political, economic, social, technological, legal and environmental) are final and professionally structured. No placeholders or teasers—this is the real file you’ll download instantly after payment.











