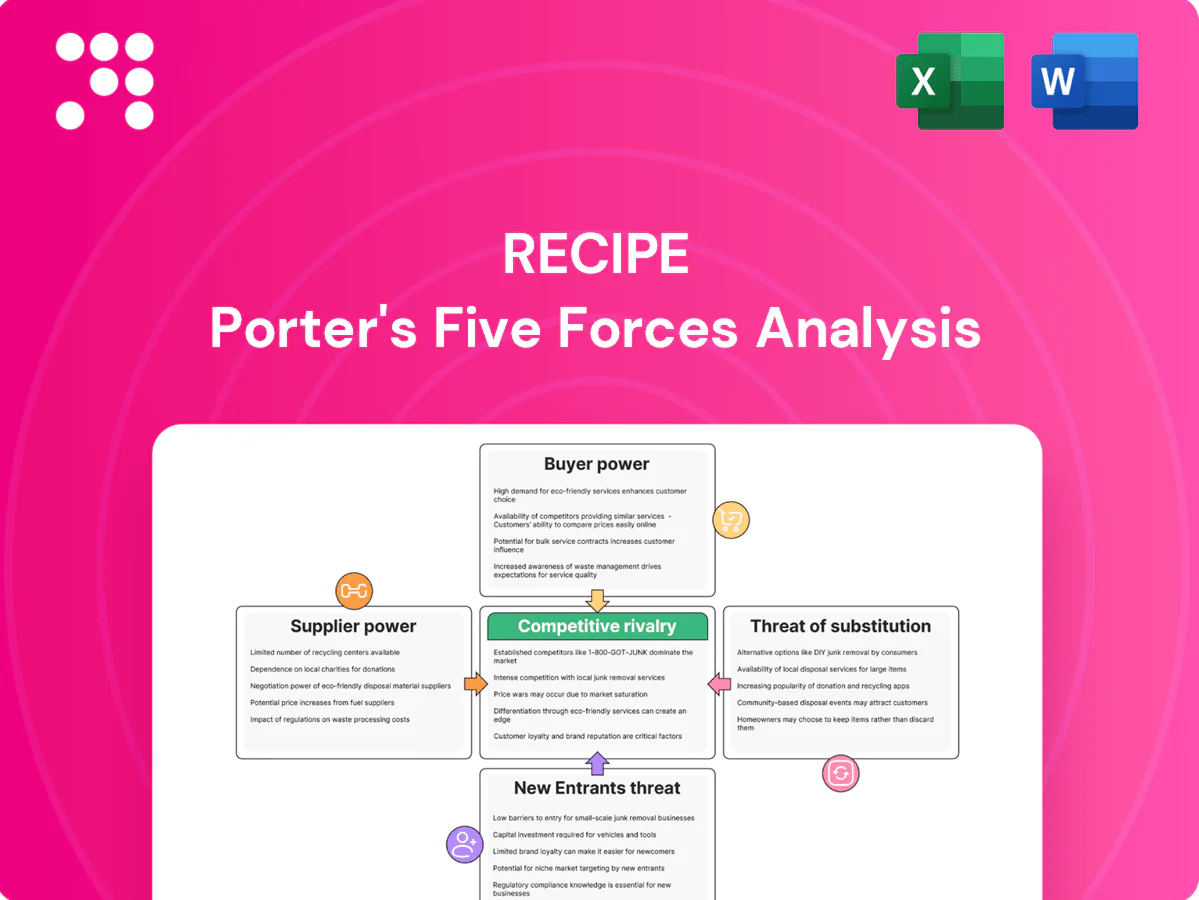
Recipe Porter's Five Forces Analysis

A Must-Have Tool for Decision-Makers
Recipe's Porter's Five Forces snapshot highlights buyer and supplier power, competitive rivalry, substitute threats, and barriers to entry shaping its market position. This brief shows core pressures but lacks force-by-force ratings and nuance. Unlock the full analysis for data-driven insights, visuals, and actionable strategy.
Suppliers Bargaining Power

Diverse agri-food inputs
Recipe Unlimited sources proteins, produce, grains and dairy from broad supplier bases, diluting single-supplier leverage and reducing spot exposure. Commodity cycles in 2024 tightened supplies for beef, chicken and wheat, pushing input cost pressure despite hedging and menu engineering. Passthrough to menu prices is constrained by intense restaurant competition and customer sensitivity. Scale contracts grant negotiating leverage but do not eliminate price volatility.
Branded beverages leverage
Cola, beer and spirits vendors exert moderate supplier power: Coca-Cola held about 43% of global CSD share in 2024 and AB InBev ~28% of beer, giving brand pull and leverage in exclusivity deals. Marketing funds/trade spend often run 8–12% of sales and rebates offset costs, but exclusivity can raise effective procurement costs by an estimated 2–5%. Negotiations typically hinge on portfolio-wide volume, unlocking 10–20% price/fee benefits across formats; favorable supply terms exist, yet lock-ins reduce channel flexibility.

Distribution and logistics dependence
National broadline distributors are few—Sysco (FY2024 revenue ~71B) and US Foods (~36.6B) together control roughly 60% of US foodservice distribution, giving them leverage on fees and service levels. Disruptions ripple across banners, raising supplier power. Multi-distributor strategies and dedicated DCs reduce single-source risk but add complexity and capex. Fuel surcharges and tight cold-chain capacity (vacancy ~4–5% in 2024) increase operating costs.

Specialty and seasonal items
Menu differentiation relies on niche suppliers for unique sauces, premium cuts and seasonal seafood, and 2024 foodservice ingredient inflation averaged about 6%, tightening margins and increasing supplier leverage. Limited alternates and strict QA/certification requirements (e.g., MSC, HACCP) raise switching costs and often force multi-year volume commitments to secure availability.
- High switching costs
- QA/certification bottlenecks
- Seasonal scarcity → higher leverage
- Volume commitments required
Equipment and technology vendors
Equipment and technology vendors (POS, kitchen gear, delivery-integration platforms) create strong lock-in through systems integration and staff training; by 2024 over 80% of full-service chains used integrated POS-to-delivery links, raising switching costs and vendor leverage. Upgrades and annual maintenance fees (commonly 10–20% of purchase/license value) grant pricing latitude, while standardized platforms scale bargaining power for vendors; downtime risks (lost sales per hour) further tilt negotiations toward suppliers.
- lock-in: >80% chain adoption (2024)
- maintenance fees: 10–20% annually
- standardization: increases vendor scale, raises switching costs
- downtime: amplifies vendor leverage in pricing/SLAs
Supplier power high: commodities up 6%, exclusivity 2–5%, POS lock-in >80%
Recipe faces moderate-to-high supplier power: broad commodity sourcing dilutes single-vendor risk but 2024 foodservice ingredient inflation ~6% and commodity tightness push input costs. Large branded beverage vendors (Coca‑Cola 43% CSD, AB InBev ~28% beer) and distributors (Sysco $71B, US Foods $36.6B) exert leverage via exclusivity and fees. Tech/equipment lock‑in (>80% chain POS integration) and QA/certifications raise switching costs.
| Supplier type | 2024 metric | Effect on Recipe |
|---|---|---|
| Commodities | Inflation ~6% | Margin pressure |
| Beverage brands | Coke 43% / AB InBev ~28% | Exclusivity costs 2–5% |
| Distributors | Sysco $71B / US Foods $36.6B | Fee/leverage on service |
| Tech/equipment | >80% POS integration | High switching costs |
What is included in the product
 Detailed Word Document
Comprehensive Porter’s Five Forces analysis tailored for Recipe, identifying competitive intensity, buyer and supplier power, entry barriers, substitutes and emerging disruptors, with strategic implications for pricing and profitability.

 Customizable Excel Spreadsheet
Recipe Porter's Five Forces Analysis relieves strategic pain by consolidating competitive pressure into a single, customizable sheet with instant radar visuals, easy integration into decks, and no complex macros—so teams can make faster, clearer decisions.
Customers Bargaining Power

High choice, low switching cost
Consumers shift among QSR, casual, independents and delivery with minimal friction, and US delivery consolidation (DoorDash ~53% share in 2024) plus delivery representing roughly 15% of restaurant sales in 2024 elevate buyer power and cap pricing. Differentiation and loyalty programs are essential to defend margins. Proximity and convenience remain decisive purchase drivers.
Price sensitivity and deals
Guests respond strongly to value menus, bundles and limited-time offers, which industry estimates show can drive roughly 10–20% incremental traffic and LTOs lift same-store sales about 1–3% in 2024. Discounting pressure rises in downturns, squeezing unit economics and compressing margins as consumers trade down. Check management via upsell must balance perceived value to avoid eroding spend per visit. Franchised sites, often ~60–70% of system units, feel localized price pressure acutely.

Delivery and platform influence
Aggregators shape discovery and comparison, amplifying buyer power; platform commissions typically range 15–30%, directly pressuring restaurant margins. Visible ratings, fees and delivery estimates intensify price and service competition, with studies in 2024 showing ratings significantly lift click-through rates. White-label delivery reduces platform dependence but shifts costs to marketing and logistics, often rising to 10–20% of order value. Menu parity and a surge in virtual brands compress differentiation and increase price elasticity.

Experience and quality expectations
Consistency, speed, and cleanliness are table stakes across formats; in 2024, 68% of diners report reviews strongly influence where they eat. Negative reviews can rapidly redirect demand to rivals, while investments in training and operations tech have shown up to a 15% reduction in churn for chains last year. Premium segments face higher expectations for ambiance and personalized service.
- Consistency/speed/cleanliness = baseline
- Negative reviews shift demand — 68% influence
- Training + ops tech → ~15% lower churn (2024)
- Premium diners expect elevated ambiance & service
Health and sustainability preferences
Customers increasingly demand transparency, healthier options and ethical sourcing, forcing reformulations and costlier inputs; in 2024 about 64% of surveyed consumers said sustainability influences purchase decisions, raising input cost pressure and R&D spend. Credible ESG communication can lower price sensitivity, while misalignment risks basket defection and churn.
- Demand: 64% 2024
- Impact: higher COGS/R&D
- Benefit: reduced price sensitivity
- Risk: basket defection
15–30% fees, 15% delivery cut margins; reviews 68%, sustainability 64%
Customers wield strong bargaining power: delivery (≈15% of sales) and DoorDash ≈53% (2024) amplify price sensitivity; platforms charge 15–30% commissions. LTOs drive ~10–20% incremental traffic and lift SSS ~1–3% (2024); 68% cite reviews as key and 64% value sustainability, pressuring COGS and differentiation.
| Metric | 2024 |
|---|---|
| Delivery share | 15% |
| DoorDash share | ≈53% |
| Platform fees | 15–30% |
| Review influence | 68% |
| Sustainability | 64% |
Preview the Actual Deliverable
Recipe Porter's Five Forces Analysis
This preview shows the exact Recipe Porter's Five Forces Analysis you'll receive after purchase—no placeholders, no mockups. The document is fully formatted, professionally written and ready for immediate download and use the moment you buy. It contains the complete competitive assessment and actionable insights included in the deliverable, so what you see is precisely what you'll get.

Original: $10.00
-65%$10.00
$3.50Product Information
Product Information
Shipping & Returns
Shipping & Returns
Description
A Must-Have Tool for Decision-Makers
Recipe's Porter's Five Forces snapshot highlights buyer and supplier power, competitive rivalry, substitute threats, and barriers to entry shaping its market position. This brief shows core pressures but lacks force-by-force ratings and nuance. Unlock the full analysis for data-driven insights, visuals, and actionable strategy.
Suppliers Bargaining Power
Diverse agri-food inputs
Recipe Unlimited sources proteins, produce, grains and dairy from broad supplier bases, diluting single-supplier leverage and reducing spot exposure. Commodity cycles in 2024 tightened supplies for beef, chicken and wheat, pushing input cost pressure despite hedging and menu engineering. Passthrough to menu prices is constrained by intense restaurant competition and customer sensitivity. Scale contracts grant negotiating leverage but do not eliminate price volatility.
Branded beverages leverage
Cola, beer and spirits vendors exert moderate supplier power: Coca-Cola held about 43% of global CSD share in 2024 and AB InBev ~28% of beer, giving brand pull and leverage in exclusivity deals. Marketing funds/trade spend often run 8–12% of sales and rebates offset costs, but exclusivity can raise effective procurement costs by an estimated 2–5%. Negotiations typically hinge on portfolio-wide volume, unlocking 10–20% price/fee benefits across formats; favorable supply terms exist, yet lock-ins reduce channel flexibility.
Distribution and logistics dependence
National broadline distributors are few—Sysco (FY2024 revenue ~71B) and US Foods (~36.6B) together control roughly 60% of US foodservice distribution, giving them leverage on fees and service levels. Disruptions ripple across banners, raising supplier power. Multi-distributor strategies and dedicated DCs reduce single-source risk but add complexity and capex. Fuel surcharges and tight cold-chain capacity (vacancy ~4–5% in 2024) increase operating costs.
Specialty and seasonal items
Menu differentiation relies on niche suppliers for unique sauces, premium cuts and seasonal seafood, and 2024 foodservice ingredient inflation averaged about 6%, tightening margins and increasing supplier leverage. Limited alternates and strict QA/certification requirements (e.g., MSC, HACCP) raise switching costs and often force multi-year volume commitments to secure availability.
- High switching costs
- QA/certification bottlenecks
- Seasonal scarcity → higher leverage
- Volume commitments required
Equipment and technology vendors
Equipment and technology vendors (POS, kitchen gear, delivery-integration platforms) create strong lock-in through systems integration and staff training; by 2024 over 80% of full-service chains used integrated POS-to-delivery links, raising switching costs and vendor leverage. Upgrades and annual maintenance fees (commonly 10–20% of purchase/license value) grant pricing latitude, while standardized platforms scale bargaining power for vendors; downtime risks (lost sales per hour) further tilt negotiations toward suppliers.
- lock-in: >80% chain adoption (2024)
- maintenance fees: 10–20% annually
- standardization: increases vendor scale, raises switching costs
- downtime: amplifies vendor leverage in pricing/SLAs
Supplier power high: commodities up 6%, exclusivity 2–5%, POS lock-in >80%
Recipe faces moderate-to-high supplier power: broad commodity sourcing dilutes single-vendor risk but 2024 foodservice ingredient inflation ~6% and commodity tightness push input costs. Large branded beverage vendors (Coca‑Cola 43% CSD, AB InBev ~28% beer) and distributors (Sysco $71B, US Foods $36.6B) exert leverage via exclusivity and fees. Tech/equipment lock‑in (>80% chain POS integration) and QA/certifications raise switching costs.
| Supplier type | 2024 metric | Effect on Recipe |
|---|---|---|
| Commodities | Inflation ~6% | Margin pressure |
| Beverage brands | Coke 43% / AB InBev ~28% | Exclusivity costs 2–5% |
| Distributors | Sysco $71B / US Foods $36.6B | Fee/leverage on service |
| Tech/equipment | >80% POS integration | High switching costs |
What is included in the product
Detailed Word Document
Comprehensive Porter’s Five Forces analysis tailored for Recipe, identifying competitive intensity, buyer and supplier power, entry barriers, substitutes and emerging disruptors, with strategic implications for pricing and profitability.
Customizable Excel Spreadsheet
Recipe Porter's Five Forces Analysis relieves strategic pain by consolidating competitive pressure into a single, customizable sheet with instant radar visuals, easy integration into decks, and no complex macros—so teams can make faster, clearer decisions.
Customers Bargaining Power
High choice, low switching cost
Consumers shift among QSR, casual, independents and delivery with minimal friction, and US delivery consolidation (DoorDash ~53% share in 2024) plus delivery representing roughly 15% of restaurant sales in 2024 elevate buyer power and cap pricing. Differentiation and loyalty programs are essential to defend margins. Proximity and convenience remain decisive purchase drivers.
Price sensitivity and deals
Guests respond strongly to value menus, bundles and limited-time offers, which industry estimates show can drive roughly 10–20% incremental traffic and LTOs lift same-store sales about 1–3% in 2024. Discounting pressure rises in downturns, squeezing unit economics and compressing margins as consumers trade down. Check management via upsell must balance perceived value to avoid eroding spend per visit. Franchised sites, often ~60–70% of system units, feel localized price pressure acutely.
Delivery and platform influence
Aggregators shape discovery and comparison, amplifying buyer power; platform commissions typically range 15–30%, directly pressuring restaurant margins. Visible ratings, fees and delivery estimates intensify price and service competition, with studies in 2024 showing ratings significantly lift click-through rates. White-label delivery reduces platform dependence but shifts costs to marketing and logistics, often rising to 10–20% of order value. Menu parity and a surge in virtual brands compress differentiation and increase price elasticity.
Experience and quality expectations
Consistency, speed, and cleanliness are table stakes across formats; in 2024, 68% of diners report reviews strongly influence where they eat. Negative reviews can rapidly redirect demand to rivals, while investments in training and operations tech have shown up to a 15% reduction in churn for chains last year. Premium segments face higher expectations for ambiance and personalized service.
- Consistency/speed/cleanliness = baseline
- Negative reviews shift demand — 68% influence
- Training + ops tech → ~15% lower churn (2024)
- Premium diners expect elevated ambiance & service
Health and sustainability preferences
Customers increasingly demand transparency, healthier options and ethical sourcing, forcing reformulations and costlier inputs; in 2024 about 64% of surveyed consumers said sustainability influences purchase decisions, raising input cost pressure and R&D spend. Credible ESG communication can lower price sensitivity, while misalignment risks basket defection and churn.
- Demand: 64% 2024
- Impact: higher COGS/R&D
- Benefit: reduced price sensitivity
- Risk: basket defection
15–30% fees, 15% delivery cut margins; reviews 68%, sustainability 64%
Customers wield strong bargaining power: delivery (≈15% of sales) and DoorDash ≈53% (2024) amplify price sensitivity; platforms charge 15–30% commissions. LTOs drive ~10–20% incremental traffic and lift SSS ~1–3% (2024); 68% cite reviews as key and 64% value sustainability, pressuring COGS and differentiation.
| Metric | 2024 |
|---|---|
| Delivery share | 15% |
| DoorDash share | ≈53% |
| Platform fees | 15–30% |
| Review influence | 68% |
| Sustainability | 64% |
Preview the Actual Deliverable
Recipe Porter's Five Forces Analysis
This preview shows the exact Recipe Porter's Five Forces Analysis you'll receive after purchase—no placeholders, no mockups. The document is fully formatted, professionally written and ready for immediate download and use the moment you buy. It contains the complete competitive assessment and actionable insights included in the deliverable, so what you see is precisely what you'll get.