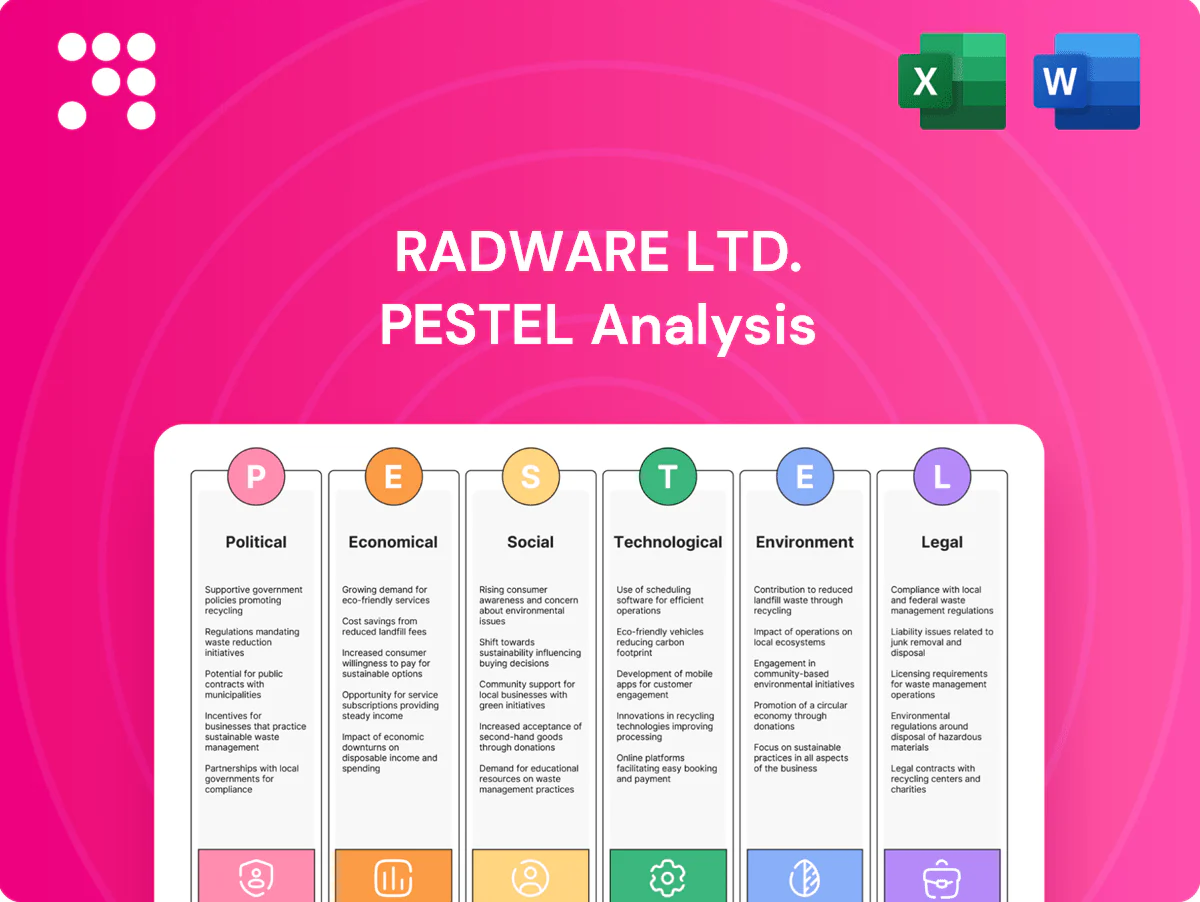
Radware Ltd. PESTLE Analysis

Your Shortcut to Market Insight Starts Here
Our PESTLE analysis pinpoints how political regulation, macroeconomic cycles, cyber‑security trends and rapid tech shifts shape Radware Ltd.'s competitive outlook, highlighting regulatory risks and market opportunities investors must track. Ready-made and actionable, this briefing helps you build strategy or investment cases—buy the full analysis for the complete, editable deep-dive.
Political factors

Geopolitical risk and regional stability
As an Israel-headquartered cybersecurity vendor (traded on NASDAQ as RDWR as of 2024), Radware faces exposure to regional tensions that can disrupt operations, workforce safety, and customer confidence. Distributed R&D and support centers reduce concentration risk and enable faster failover. Strong government relations and formal business continuity plans are critical to maintain uninterrupted service delivery. Insurance and supply-chain diversification further mitigate shock impact.
Government cyber policies and mandates
National cybersecurity strategies and critical infrastructure mandates, exemplified by EU NIS2 and US Executive Order 14028, expand demand for DDoS protection and application security; over 150 countries now maintain national cyber strategies, broadening addressable markets for Radware. Public-sector procurement cycles are often lengthy but can yield multi-year, stable revenues. Compliance with sectoral standards such as PCI DSS and HIPAA directly influences product roadmaps. Local certifications like CE or Singapore CSA STAR can unlock specific national markets.

Export controls and cross-border restrictions
Cyber tools face export licensing, encryption controls and bans to sensitive jurisdictions, with US, EU and Israeli regimes (BIS, EU Dual‑Use and Israel MOD controls) governing transfers and 30+ restricted jurisdictions. Clear compliance processes reduce risks of fines, seizures and shipment delays. Product design may require configurable crypto and feature‑flagging to meet country rules and enable global sales.

US–China tech decoupling and market access
US–China tech bifurcation limits access to customers, components and cloud ecosystems (public cloud market $591B in 2023 per Gartner) and has been reinforced by 2022–2024 US export controls on advanced semiconductors and AI-related technologies. Vendor selection is increasingly politicized in strategic sectors. Dual-supply strategies and regional hosting can sustain growth while partnerships must align with national security expectations.
- Limit market access: politicized procurement in telecom, defense
- Supply risk: export controls on advanced chips (2022–2024)
- Mitigation: dual sourcing, regional cloud hosting
- Partnering: compliance with national security standards
Public funding and incentives for cyber resilience
Grants and subsidies such as the EU Digital Europe Programme’s €1.9B cybersecurity allocation (2021–27) can accelerate Radware’s solution uptake; alignment with national resilience programs increases competitiveness in tenders; co-investment in local SOCs or training strengthens market presence; tracking public budget cycles improves sales pipeline timing.
- Grants catalyze adoption
- Program alignment aids tenders
- Co-investment deepens presence
- Budget-cycle tracking refines pipeline
Cybersecurity vendor navigates geopolitical risk as EU funding boosts DDoS demand
Radware (HQ Israel; NASDAQ RDWR) faces geopolitical risk from regional tensions, US–China tech bifurcation and export controls that limit market access and components. National cyber mandates (NIS2, EO14028) and €1.9B EU Digital Europe funding (2021–27) boost demand for DDoS/app security. Mitigations: dual sourcing, regional hosting, certifications and compliance programs.
| Item | Metric |
|---|---|
| HQ/Listing | Israel / NASDAQ RDWR |
| Cloud market | $591B (2023) |
| EU funding | €1.9B (2021–27) |
| Restricted jurisdictions | 30+ |
What is included in the product
 Detailed Word Document
Explores how external macro-environmental factors uniquely affect Radware Ltd. across six dimensions—Political, Economic, Social, Technological, Environmental and Legal—linking industry trends, threat landscape and regional regulation to strategic risks and opportunities; each section is data‑backed, forward‑looking and designed to help executives, investors and advisors integrate PESTLE insights into planning and risk mitigation.

 Customizable Excel Spreadsheet
Visually segmented by PESTEL categories, allowing quick interpretation at a glance to support Radware Ltd.'s strategic decisions and risk mitigation during planning sessions.
Economic factors

IT spending cycles and macro sensitivity
Cybersecurity shows resilience but can face deal delays during IT spending slowdowns; Gartner forecast global IT spending at about $4.8 trillion in 2024, making large procurements macro-sensitive. Mission-critical DDoS protection is often prioritized. Flexible pricing and ROI proof points help defend budgets, while land-and-expand motions capture deferred demand.
Shift to subscriptions and ARR
Radware’s shift from hardware to SaaS and managed services has smoothed revenue, with reported ARR rising to $224 million in FY2024 as subscription and services replaced lumpier appliance sales. Recurring contracts now boost visibility and support higher valuation multiples, while usage-based pricing ties fees to traffic and attack intensity for more accurate monetization. Strong renewal rates and upsell programs increased customer lifetime value and reduced churn.

Currency fluctuations
Global billings of $292.8m in FY2024 expose Radware to FX volatility that can compress margins and force frequent price resets across USD, EUR and ILS corridors. Natural hedging via multicurrency revenues and local cost bases, plus hedging instruments, have stabilized earnings historically and reduced reported FX P&L swings of roughly 6% in 2024. Multicurrency pricing and local invoicing cut customer friction while aligning costs with revenue regions dampens future swings.

Component and cloud infrastructure costs
Component costs hinge on semiconductor supply and logistics; Radware reported FY2024 revenue of about $318 million, while semiconductor lead times eased in 2024 versus 2021–22 peaks.
Cloud-delivered scrubbing and PoPs create recurring opex—public cloud spending reached roughly $667 billion in 2024 (Gartner), increasing unit opex pressure.
Economies of scale, multi-cloud procurement and capacity planning for peak attacks (multi-Tbps threats recorded in recent years) optimize unit economics and resilience.
- semiconductor availability: eased lead times vs 2021–22
- Radware FY2024 revenue: ~318 million
- public cloud spend 2024 (Gartner): ~667 billion
- plan for multi-Tbps peak-attack scenarios
Industry consolidation and competitive pricing
Industry consolidation and competitive pricing pressure Radware as large cloud and platform providers bundle security into suites, compressing standalone appliance ASPs; Radware sustains margins by differentiating on attack mitigation efficacy, low latency and automated orchestration, while strategic partnerships and OEM agreements grow reach with lower customer acquisition cost. M&A remains a fast route to broaden capabilities and channel access.
- Bundled platform pressure
- Differentiation: efficacy, latency, automation
- Partnerships/OEMs reduce CAC
- M&A accelerates portfolio & channels
Cybersecurity vendor navigates geopolitical risk as EU funding boosts DDoS demand
Macro IT spend (~$4.8T in 2024) makes large procurements cyclical; Radware’s ARR rose to $224M and FY2024 revenue ~318M aiding predictability. Public cloud spend (~$667B in 2024) raises opex; FX swings ~6% affect margins. SaaS shift and economies of scale mitigate volatility and support higher multiples.
| Metric | Value |
|---|---|
| Global IT spend 2024 | $4.8T |
| Radware ARR FY2024 | $224M |
| Radware Revenue FY2024 | $318M |
| Public cloud spend 2024 | $667B |
| FX P&L swing 2024 | ~6% |
Same Document Delivered
Radware Ltd. PESTLE Analysis
The preview shown here is the exact Radware Ltd. PESTLE Analysis document you’ll receive after purchase—fully formatted and ready to use. It covers political, economic, social, technological, legal and environmental factors tailored to Radware’s market position and risks. No placeholders or teasers—this is the final, download-ready file delivered exactly as displayed.

Original: $10.00
-65%$10.00
$3.50Product Information
Product Information
Shipping & Returns
Shipping & Returns
Description
Your Shortcut to Market Insight Starts Here
Our PESTLE analysis pinpoints how political regulation, macroeconomic cycles, cyber‑security trends and rapid tech shifts shape Radware Ltd.'s competitive outlook, highlighting regulatory risks and market opportunities investors must track. Ready-made and actionable, this briefing helps you build strategy or investment cases—buy the full analysis for the complete, editable deep-dive.
Political factors
Geopolitical risk and regional stability
As an Israel-headquartered cybersecurity vendor (traded on NASDAQ as RDWR as of 2024), Radware faces exposure to regional tensions that can disrupt operations, workforce safety, and customer confidence. Distributed R&D and support centers reduce concentration risk and enable faster failover. Strong government relations and formal business continuity plans are critical to maintain uninterrupted service delivery. Insurance and supply-chain diversification further mitigate shock impact.
Government cyber policies and mandates
National cybersecurity strategies and critical infrastructure mandates, exemplified by EU NIS2 and US Executive Order 14028, expand demand for DDoS protection and application security; over 150 countries now maintain national cyber strategies, broadening addressable markets for Radware. Public-sector procurement cycles are often lengthy but can yield multi-year, stable revenues. Compliance with sectoral standards such as PCI DSS and HIPAA directly influences product roadmaps. Local certifications like CE or Singapore CSA STAR can unlock specific national markets.
Export controls and cross-border restrictions
Cyber tools face export licensing, encryption controls and bans to sensitive jurisdictions, with US, EU and Israeli regimes (BIS, EU Dual‑Use and Israel MOD controls) governing transfers and 30+ restricted jurisdictions. Clear compliance processes reduce risks of fines, seizures and shipment delays. Product design may require configurable crypto and feature‑flagging to meet country rules and enable global sales.
US–China tech decoupling and market access
US–China tech bifurcation limits access to customers, components and cloud ecosystems (public cloud market $591B in 2023 per Gartner) and has been reinforced by 2022–2024 US export controls on advanced semiconductors and AI-related technologies. Vendor selection is increasingly politicized in strategic sectors. Dual-supply strategies and regional hosting can sustain growth while partnerships must align with national security expectations.
- Limit market access: politicized procurement in telecom, defense
- Supply risk: export controls on advanced chips (2022–2024)
- Mitigation: dual sourcing, regional cloud hosting
- Partnering: compliance with national security standards
Public funding and incentives for cyber resilience
Grants and subsidies such as the EU Digital Europe Programme’s €1.9B cybersecurity allocation (2021–27) can accelerate Radware’s solution uptake; alignment with national resilience programs increases competitiveness in tenders; co-investment in local SOCs or training strengthens market presence; tracking public budget cycles improves sales pipeline timing.
- Grants catalyze adoption
- Program alignment aids tenders
- Co-investment deepens presence
- Budget-cycle tracking refines pipeline
Cybersecurity vendor navigates geopolitical risk as EU funding boosts DDoS demand
Radware (HQ Israel; NASDAQ RDWR) faces geopolitical risk from regional tensions, US–China tech bifurcation and export controls that limit market access and components. National cyber mandates (NIS2, EO14028) and €1.9B EU Digital Europe funding (2021–27) boost demand for DDoS/app security. Mitigations: dual sourcing, regional hosting, certifications and compliance programs.
| Item | Metric |
|---|---|
| HQ/Listing | Israel / NASDAQ RDWR |
| Cloud market | $591B (2023) |
| EU funding | €1.9B (2021–27) |
| Restricted jurisdictions | 30+ |
What is included in the product
Detailed Word Document
Explores how external macro-environmental factors uniquely affect Radware Ltd. across six dimensions—Political, Economic, Social, Technological, Environmental and Legal—linking industry trends, threat landscape and regional regulation to strategic risks and opportunities; each section is data‑backed, forward‑looking and designed to help executives, investors and advisors integrate PESTLE insights into planning and risk mitigation.
Customizable Excel Spreadsheet
Visually segmented by PESTEL categories, allowing quick interpretation at a glance to support Radware Ltd.'s strategic decisions and risk mitigation during planning sessions.
Economic factors
IT spending cycles and macro sensitivity
Cybersecurity shows resilience but can face deal delays during IT spending slowdowns; Gartner forecast global IT spending at about $4.8 trillion in 2024, making large procurements macro-sensitive. Mission-critical DDoS protection is often prioritized. Flexible pricing and ROI proof points help defend budgets, while land-and-expand motions capture deferred demand.
Shift to subscriptions and ARR
Radware’s shift from hardware to SaaS and managed services has smoothed revenue, with reported ARR rising to $224 million in FY2024 as subscription and services replaced lumpier appliance sales. Recurring contracts now boost visibility and support higher valuation multiples, while usage-based pricing ties fees to traffic and attack intensity for more accurate monetization. Strong renewal rates and upsell programs increased customer lifetime value and reduced churn.
Currency fluctuations
Global billings of $292.8m in FY2024 expose Radware to FX volatility that can compress margins and force frequent price resets across USD, EUR and ILS corridors. Natural hedging via multicurrency revenues and local cost bases, plus hedging instruments, have stabilized earnings historically and reduced reported FX P&L swings of roughly 6% in 2024. Multicurrency pricing and local invoicing cut customer friction while aligning costs with revenue regions dampens future swings.
Component and cloud infrastructure costs
Component costs hinge on semiconductor supply and logistics; Radware reported FY2024 revenue of about $318 million, while semiconductor lead times eased in 2024 versus 2021–22 peaks.
Cloud-delivered scrubbing and PoPs create recurring opex—public cloud spending reached roughly $667 billion in 2024 (Gartner), increasing unit opex pressure.
Economies of scale, multi-cloud procurement and capacity planning for peak attacks (multi-Tbps threats recorded in recent years) optimize unit economics and resilience.
- semiconductor availability: eased lead times vs 2021–22
- Radware FY2024 revenue: ~318 million
- public cloud spend 2024 (Gartner): ~667 billion
- plan for multi-Tbps peak-attack scenarios
Industry consolidation and competitive pricing
Industry consolidation and competitive pricing pressure Radware as large cloud and platform providers bundle security into suites, compressing standalone appliance ASPs; Radware sustains margins by differentiating on attack mitigation efficacy, low latency and automated orchestration, while strategic partnerships and OEM agreements grow reach with lower customer acquisition cost. M&A remains a fast route to broaden capabilities and channel access.
- Bundled platform pressure
- Differentiation: efficacy, latency, automation
- Partnerships/OEMs reduce CAC
- M&A accelerates portfolio & channels
Cybersecurity vendor navigates geopolitical risk as EU funding boosts DDoS demand
Macro IT spend (~$4.8T in 2024) makes large procurements cyclical; Radware’s ARR rose to $224M and FY2024 revenue ~318M aiding predictability. Public cloud spend (~$667B in 2024) raises opex; FX swings ~6% affect margins. SaaS shift and economies of scale mitigate volatility and support higher multiples.
| Metric | Value |
|---|---|
| Global IT spend 2024 | $4.8T |
| Radware ARR FY2024 | $224M |
| Radware Revenue FY2024 | $318M |
| Public cloud spend 2024 | $667B |
| FX P&L swing 2024 | ~6% |
Same Document Delivered
Radware Ltd. PESTLE Analysis
The preview shown here is the exact Radware Ltd. PESTLE Analysis document you’ll receive after purchase—fully formatted and ready to use. It covers political, economic, social, technological, legal and environmental factors tailored to Radware’s market position and risks. No placeholders or teasers—this is the final, download-ready file delivered exactly as displayed.











