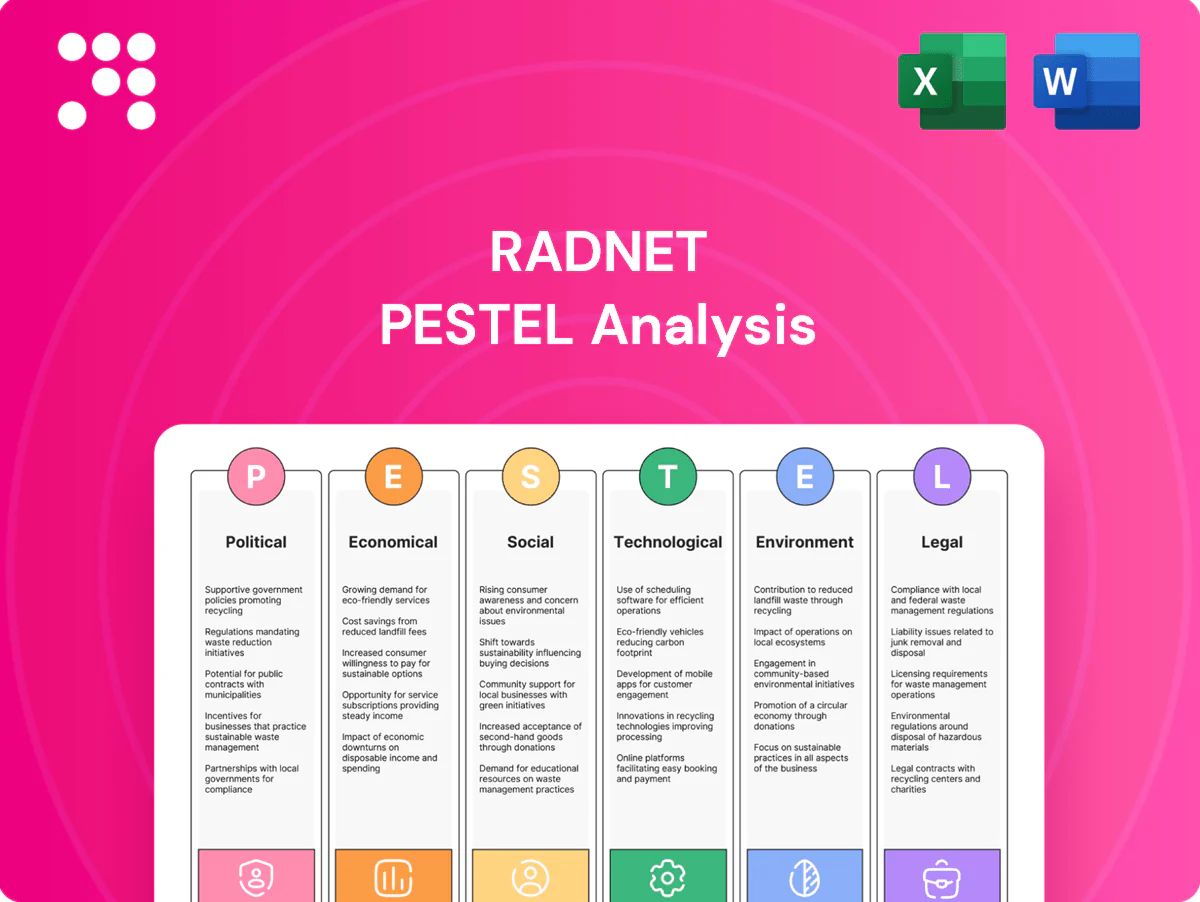
RadNet PESTLE Analysis

Make Smarter Strategic Decisions with a Complete PESTEL View
Gain a competitive edge with our PESTLE analysis of RadNet, revealing how political regulation, reimbursement trends, and tech adoption shape strategy. Ready-made and research-backed, it’s ideal for investors and strategists. Purchase the full report for detailed, actionable insights to guide decisions.
Political factors

Medicare and Medicaid policy direction
Medicare (about 65 million beneficiaries) and Medicaid/CHIP (≈84 million enrollees) reimbursement policy under CMS directly shapes imaging volumes and margins for RadNet. Annual CMS rulemaking (PFS/OPPS proposed in July, final in November) and site-neutral payment proposals can shift volume from hospitals to outpatient centers, altering revenue mix. Election outcomes influence expansion, prior authorization and screening coverage, so RadNet must track rule cycles to adapt pricing and access strategies.
Prior authorization and utilization management
Payer-driven pressure to curb imaging costs has increased prior authorization and utilization management, creating authorization hurdles that can slow throughput and lower patient satisfaction. RadNet, operating roughly 350 imaging centers, must adapt as federal or state interventions (including potential gold-card legislation favoring high-quality providers) could standardize or relax these processes. Operational agility is required to navigate wide state-by-state policy variability.

State certificate-of-need (CON) regimes
State certificate-of-need (CON) regimes, in place in 35 states per NCSL (2024), constrain entry, expansion and high-cost equipment deployment for imaging providers and raise barriers to new RadNet centers. Political shifts that repeal, tighten or reinterpret CON materially change competitive dynamics and M&A timelines. Favorable rollbacks accelerate market growth; restrictive regimes entrench incumbents, so RadNet’s planning rests on regulatory intelligence and active advocacy.

Preventive care and cancer screening agendas
Public health policy emphasizing mammography and lung cancer screening can raise imaging volumes; USPSTF updated lung-screening criteria in 2021 to start at age 50 with 20 pack-years, and federal initiatives like the 2022 Cancer Moonshot target major mortality reductions, supporting funding and uptake that benefit RadNet’s growth.
- USPSTF lung-screen 2021: age 50, 20 pack-years
- Cancer Moonshot 2022: aggressive federal support
- Political backing boosts women’s health funding and screening volumes
- Consistent public messaging aligns with RadNet’s patient-centered brand
Public funding for AI and health innovation
Government grants and pilot programs accelerate AI adoption in imaging; NIH and HHS digital-health initiatives (NIH FY2024 budget ~49.6 billion) expand funding and pilot channels, while TEFCA and federal interoperability drives since 2023 improve data liquidity. Procurement and CMS recognition/pathways for AI tools would catalyze scale; RadNet can join consortia to shape standards and access grants.
- Grants: access NIH/HHS pilots
- Interoperability: TEFCA-driven data liquidity
- Reimbursement: CMS pathways enable scale
- Consortia: influence standards, unlock funding
Medicare 65M & Medicaid/CHIP 84M reshape imaging margins, CMS rulemaking
Medicare ~65M and Medicaid/CHIP ≈84M beneficiaries shape imaging volumes; CMS annual rulemaking (PFS/OPPS cycle) and site-neutral payment shifts alter margins. State CON regimes exist in 35 states (NCSL 2024), affecting RadNet’s ~350 centers expansion and M&A timing. NIH FY2024 budget ~$49.6B and CMS AI pathways drive digital adoption; elections affect prior auth and screening coverage.
| Factor | 2024-25 Metric | Impact |
|---|---|---|
| Payers/CMS | Medicare 65M; Medicaid 84M | Volume + margin shifts via rulemaking |
| CON | 35 states | Constrains expansion, alters M&A |
| Funding/AI | NIH $49.6B (FY2024) | Enables AI pilots, interoperability |
What is included in the product
 Detailed Word Document
Explores how macro-environmental factors uniquely affect RadNet across six dimensions—Political, Economic, Social, Technological, Environmental, and Legal—each supported by data and current trends to reveal threats and opportunities. Designed for executives and investors, it delivers forward-looking insights for scenario planning and strategic action.

 Customizable Excel Spreadsheet
A concise, visually segmented RadNet PESTLE summary that simplifies external risk assessment for meetings and presentations, is easily editable for regional or business-line notes, and conveniently shareable across teams for quick alignment.
Economic factors

Interest rates and capital intensity
Imaging relies on expensive equipment and center build-outs—MRI $1–3 million, PET/CT $2–6 million—making cost of capital critical as the federal funds rate stood around 5.25–5.50% in mid‑2025.
Higher rates raise hurdle returns and slow expansion or upgrades by lengthening payback periods.
Leasing strategies and vendor financing mitigate cash outlays but compress margins, so disciplined capital allocation across markets is essential.
Payer mix and reimbursement pressure
Payer mix materially shifts yields: commercial payers typically reimburse imaging at roughly 1.5–3.0x Medicare rates, so a swing toward Medicare/Medicaid compresses average realized price and margins.
Rising patient cost‑sharing from high‑deductible employer plans increases demand elasticity and boosts bad‑debt exposure; collection risk grows as patient-pay portions climb.
RadNet’s contracting leverage with large regional payers determines rate sustainability and promotion of higher commercial mixes through value arrangements.
Geographic mix matters: centers concentrated in higher‑Medicare or Medicaid states face amplified reimbursement downside versus centers in commercially dense markets.

Labor market for technologists and radiologists
Wage inflation and staffing shortages are driving higher operating costs and scheduling bottlenecks for RadNet; employment of radiologic technologists is projected to grow about 6% from 2022–32 (BLS), signaling persistent demand. Workflow redesign and AI-driven reading tools can raise productivity and partially offset labor pressure. Competition for subspecialists lengthens turnaround and can reduce quality; retention programs and accredited training pipelines are becoming clear strategic differentiators.

Utilization cycles and macro demand
Economic slowdowns can defer elective imaging, while RadNet’s mix of preventive programs helps sustain baseline volumes; RadNet operates roughly 340 outpatient centers and reported about $1.7B revenue in 2023, making local demand swings material. Post‑pandemic normalization continues to rebalance modality mix toward MRI and CT. Employer screening programs and value‑based contracts can stabilize utilization amid macro weakness. Local demographics drive market-level variability.
- Elective deferrals risk volume dips
- Preventive programs = baseline resilience
- Modality rebalance: MRI/CT recovery
- Employer/value contracts stabilize demand
- Local demographics cause variability
Equipment supply chain and service costs
OEM lead times and parts shortages, often 3–9 months for imaging equipment, plus service contract expenses materially affect RadNet uptime and cash flow; currency and commodity swings change imported equipment prices. Multi-vendor strategies and predictive maintenance reduce disruptions and service spend, while bulk purchasing captures scale economies.
- OEM lead times 3–9 months
- Parts/service impact uptime & cash flow
- Currency/commodity volatility alters pricing
- Multi-vendor + predictive maintenance reduce risk
- Bulk purchasing lowers unit cost
Medicare 65M & Medicaid/CHIP 84M reshape imaging margins, CMS rulemaking
High capital intensity (MRI $1–3M; PET/CT $2–6M) with fed funds ~5.25–5.50% mid‑2025 lengthens payback and constrains expansion. Commercial reimbursements ~1.5–3.0x Medicare drive margins; Medicare/Medicaid mix and high‑deductible plans raise collection risk. Labor inflation and technologist demand (+6% 2022–32) and OEM lead times (3–9 months) pressure costs and uptime; RadNet: ~340 centers, $1.7B revenue (2023).
| Metric | Value |
|---|---|
| Fed funds (mid‑2025) | 5.25–5.50% |
| MRI cost | $1–3M |
| PET/CT cost | $2–6M |
| Reimbursement ratio | Commercial 1.5–3.0x Medicare |
| Technologist growth (BLS) | +6% (2022–32) |
| OEM lead times | 3–9 months |
| RadNet scale | ~340 centers; $1.7B (2023) |
Preview Before You Purchase
RadNet PESTLE Analysis
The RadNet PESTLE Analysis preview shown here is the exact document you’ll receive after purchase—fully formatted and ready to use. It includes the complete political, economic, social, technological, legal, and environmental assessment with charts and actionable insights. No placeholders or teasers—this is the final file, ready to download and apply in your analysis.

Original: $10.00
-65%$10.00
$3.50Product Information
Product Information
Shipping & Returns
Shipping & Returns
Description
Make Smarter Strategic Decisions with a Complete PESTEL View
Gain a competitive edge with our PESTLE analysis of RadNet, revealing how political regulation, reimbursement trends, and tech adoption shape strategy. Ready-made and research-backed, it’s ideal for investors and strategists. Purchase the full report for detailed, actionable insights to guide decisions.
Political factors
Medicare and Medicaid policy direction
Medicare (about 65 million beneficiaries) and Medicaid/CHIP (≈84 million enrollees) reimbursement policy under CMS directly shapes imaging volumes and margins for RadNet. Annual CMS rulemaking (PFS/OPPS proposed in July, final in November) and site-neutral payment proposals can shift volume from hospitals to outpatient centers, altering revenue mix. Election outcomes influence expansion, prior authorization and screening coverage, so RadNet must track rule cycles to adapt pricing and access strategies.
Prior authorization and utilization management
Payer-driven pressure to curb imaging costs has increased prior authorization and utilization management, creating authorization hurdles that can slow throughput and lower patient satisfaction. RadNet, operating roughly 350 imaging centers, must adapt as federal or state interventions (including potential gold-card legislation favoring high-quality providers) could standardize or relax these processes. Operational agility is required to navigate wide state-by-state policy variability.
State certificate-of-need (CON) regimes
State certificate-of-need (CON) regimes, in place in 35 states per NCSL (2024), constrain entry, expansion and high-cost equipment deployment for imaging providers and raise barriers to new RadNet centers. Political shifts that repeal, tighten or reinterpret CON materially change competitive dynamics and M&A timelines. Favorable rollbacks accelerate market growth; restrictive regimes entrench incumbents, so RadNet’s planning rests on regulatory intelligence and active advocacy.
Preventive care and cancer screening agendas
Public health policy emphasizing mammography and lung cancer screening can raise imaging volumes; USPSTF updated lung-screening criteria in 2021 to start at age 50 with 20 pack-years, and federal initiatives like the 2022 Cancer Moonshot target major mortality reductions, supporting funding and uptake that benefit RadNet’s growth.
- USPSTF lung-screen 2021: age 50, 20 pack-years
- Cancer Moonshot 2022: aggressive federal support
- Political backing boosts women’s health funding and screening volumes
- Consistent public messaging aligns with RadNet’s patient-centered brand
Public funding for AI and health innovation
Government grants and pilot programs accelerate AI adoption in imaging; NIH and HHS digital-health initiatives (NIH FY2024 budget ~49.6 billion) expand funding and pilot channels, while TEFCA and federal interoperability drives since 2023 improve data liquidity. Procurement and CMS recognition/pathways for AI tools would catalyze scale; RadNet can join consortia to shape standards and access grants.
- Grants: access NIH/HHS pilots
- Interoperability: TEFCA-driven data liquidity
- Reimbursement: CMS pathways enable scale
- Consortia: influence standards, unlock funding
Medicare 65M & Medicaid/CHIP 84M reshape imaging margins, CMS rulemaking
Medicare ~65M and Medicaid/CHIP ≈84M beneficiaries shape imaging volumes; CMS annual rulemaking (PFS/OPPS cycle) and site-neutral payment shifts alter margins. State CON regimes exist in 35 states (NCSL 2024), affecting RadNet’s ~350 centers expansion and M&A timing. NIH FY2024 budget ~$49.6B and CMS AI pathways drive digital adoption; elections affect prior auth and screening coverage.
| Factor | 2024-25 Metric | Impact |
|---|---|---|
| Payers/CMS | Medicare 65M; Medicaid 84M | Volume + margin shifts via rulemaking |
| CON | 35 states | Constrains expansion, alters M&A |
| Funding/AI | NIH $49.6B (FY2024) | Enables AI pilots, interoperability |
What is included in the product
Detailed Word Document
Explores how macro-environmental factors uniquely affect RadNet across six dimensions—Political, Economic, Social, Technological, Environmental, and Legal—each supported by data and current trends to reveal threats and opportunities. Designed for executives and investors, it delivers forward-looking insights for scenario planning and strategic action.
Customizable Excel Spreadsheet
A concise, visually segmented RadNet PESTLE summary that simplifies external risk assessment for meetings and presentations, is easily editable for regional or business-line notes, and conveniently shareable across teams for quick alignment.
Economic factors
Interest rates and capital intensity
Imaging relies on expensive equipment and center build-outs—MRI $1–3 million, PET/CT $2–6 million—making cost of capital critical as the federal funds rate stood around 5.25–5.50% in mid‑2025.
Higher rates raise hurdle returns and slow expansion or upgrades by lengthening payback periods.
Leasing strategies and vendor financing mitigate cash outlays but compress margins, so disciplined capital allocation across markets is essential.
Payer mix and reimbursement pressure
Payer mix materially shifts yields: commercial payers typically reimburse imaging at roughly 1.5–3.0x Medicare rates, so a swing toward Medicare/Medicaid compresses average realized price and margins.
Rising patient cost‑sharing from high‑deductible employer plans increases demand elasticity and boosts bad‑debt exposure; collection risk grows as patient-pay portions climb.
RadNet’s contracting leverage with large regional payers determines rate sustainability and promotion of higher commercial mixes through value arrangements.
Geographic mix matters: centers concentrated in higher‑Medicare or Medicaid states face amplified reimbursement downside versus centers in commercially dense markets.
Labor market for technologists and radiologists
Wage inflation and staffing shortages are driving higher operating costs and scheduling bottlenecks for RadNet; employment of radiologic technologists is projected to grow about 6% from 2022–32 (BLS), signaling persistent demand. Workflow redesign and AI-driven reading tools can raise productivity and partially offset labor pressure. Competition for subspecialists lengthens turnaround and can reduce quality; retention programs and accredited training pipelines are becoming clear strategic differentiators.
Utilization cycles and macro demand
Economic slowdowns can defer elective imaging, while RadNet’s mix of preventive programs helps sustain baseline volumes; RadNet operates roughly 340 outpatient centers and reported about $1.7B revenue in 2023, making local demand swings material. Post‑pandemic normalization continues to rebalance modality mix toward MRI and CT. Employer screening programs and value‑based contracts can stabilize utilization amid macro weakness. Local demographics drive market-level variability.
- Elective deferrals risk volume dips
- Preventive programs = baseline resilience
- Modality rebalance: MRI/CT recovery
- Employer/value contracts stabilize demand
- Local demographics cause variability
Equipment supply chain and service costs
OEM lead times and parts shortages, often 3–9 months for imaging equipment, plus service contract expenses materially affect RadNet uptime and cash flow; currency and commodity swings change imported equipment prices. Multi-vendor strategies and predictive maintenance reduce disruptions and service spend, while bulk purchasing captures scale economies.
- OEM lead times 3–9 months
- Parts/service impact uptime & cash flow
- Currency/commodity volatility alters pricing
- Multi-vendor + predictive maintenance reduce risk
- Bulk purchasing lowers unit cost
Medicare 65M & Medicaid/CHIP 84M reshape imaging margins, CMS rulemaking
High capital intensity (MRI $1–3M; PET/CT $2–6M) with fed funds ~5.25–5.50% mid‑2025 lengthens payback and constrains expansion. Commercial reimbursements ~1.5–3.0x Medicare drive margins; Medicare/Medicaid mix and high‑deductible plans raise collection risk. Labor inflation and technologist demand (+6% 2022–32) and OEM lead times (3–9 months) pressure costs and uptime; RadNet: ~340 centers, $1.7B revenue (2023).
| Metric | Value |
|---|---|
| Fed funds (mid‑2025) | 5.25–5.50% |
| MRI cost | $1–3M |
| PET/CT cost | $2–6M |
| Reimbursement ratio | Commercial 1.5–3.0x Medicare |
| Technologist growth (BLS) | +6% (2022–32) |
| OEM lead times | 3–9 months |
| RadNet scale | ~340 centers; $1.7B (2023) |
Preview Before You Purchase
RadNet PESTLE Analysis
The RadNet PESTLE Analysis preview shown here is the exact document you’ll receive after purchase—fully formatted and ready to use. It includes the complete political, economic, social, technological, legal, and environmental assessment with charts and actionable insights. No placeholders or teasers—this is the final file, ready to download and apply in your analysis.











