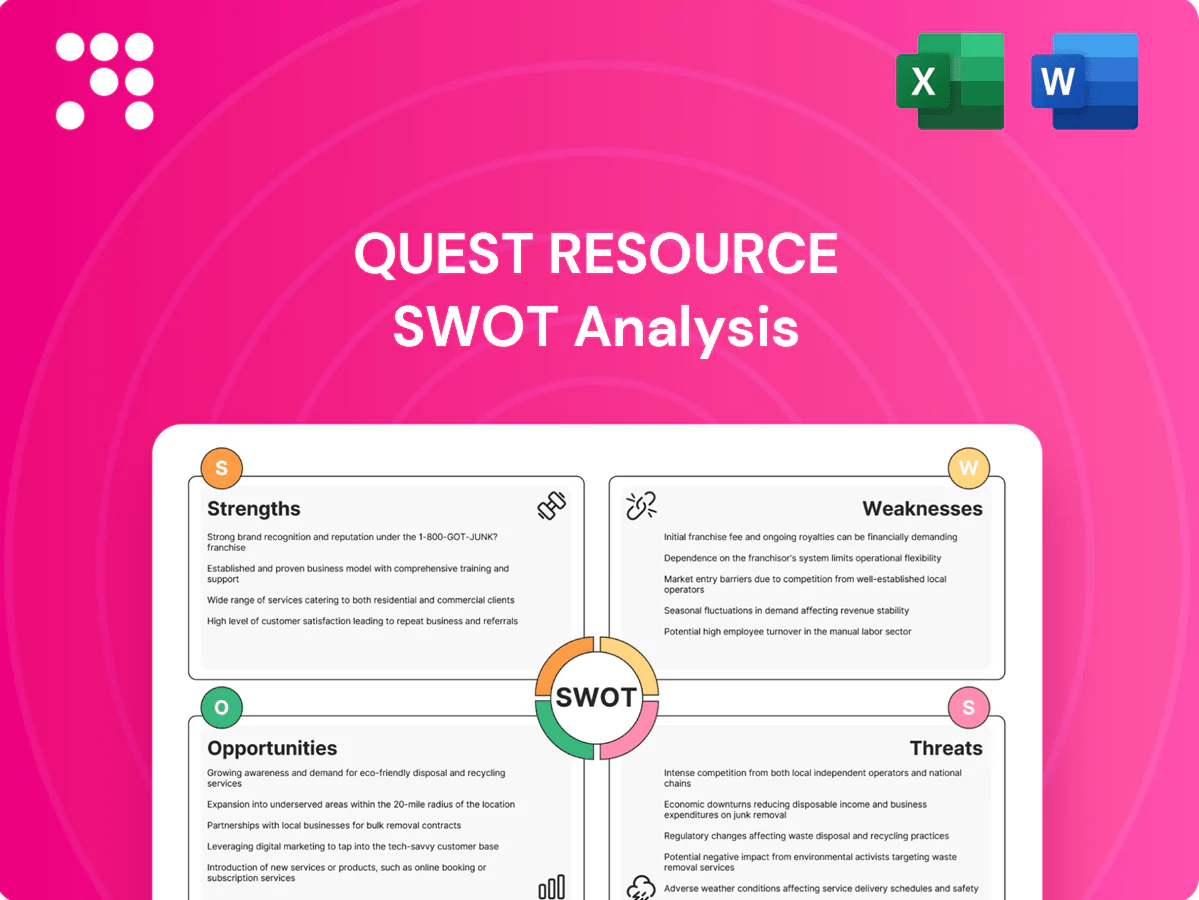
Quest Resource SWOT Analysis

Go Beyond the Preview—Access the Full Strategic Report
Explore Quest Resource’s strategic position with our concise SWOT snapshot—spot strengths like asset depth, along with market risks and growth levers. Want the full picture with actionable insights, financial context, and editable tools? Purchase the complete SWOT analysis to plan, pitch, and invest with confidence.
Strengths

Integrated waste solutions
Quest Resource’s end-to-end programs span collection, recycling and resource recovery across municipal, commercial and industrial streams, simplifying vendor management and increasing client share of wallet. Comprehensive offerings enable cross-selling and more durable client relationships. Consistent service delivery supports better outcomes in a sector where US recycling rate was 32.1% in 2020 (EPA).
Tailored, data-driven programs
Tailored, data-driven programs align services to client cost and sustainability goals. Analytics identify diversion opportunities and optimize routes—industry studies show route-mile reductions up to 20%. Performance tracking documents ROI and compliance, with many clients reporting payback in under 18 months. This consultative model differentiates from commodity haulers.

Multi-industry footprint
Serving multiple verticals reduces sector-specific cyclicality, historically improving revenue resilience by roughly 10–15% during downturns according to cross-industry analyses. Knowledge transfer across industries accelerates solution design and execution, cutting time-to-market for new offerings by weeks to months. Diversification broadens the sales funnel and upsell potential while enhancing brand credibility as a cross-sector specialist.

Cost reduction and revenue uplift
Quest Resource programs cut disposal costs by up to 30% while lifting recycling revenue through improved material recovery; clients report tangible P&L impact with waste-to-value streams adding measurable EBITDA uplift. Clear financial benefits boost win rates, retention and justify outcome-based premium pricing and multi-year contracts, with some customers extending terms by 12–36 months.
- cost-savings: up to 30% lower disposal
- revenue-uplift: higher material recovery
- client-impact: measurable P&L/EBITDA gains
- commercial: higher win rates, 12–36 month contract extensions
Sustainability enablement
Quest enables clients to meet ESG targets and regulatory regimes such as the EU CSRD (in scope for ~50,000 firms), while standardized diversion and emissions reporting (GHG Protocol-aligned) strengthens auditability and governance. Alignment with corporate sustainability strategies increases executive sponsorship and positions Quest as a strategic partner rather than a vendor.
- ESG compliance: CSRD ~50,000 firms
- Reporting: diversion, Scope 1–3 emissions
- Governance: audit-ready data
- Positioning: strategic partner, executive buy-in
Smart recycling: route miles down 20%, payback 18 months
Quest Resource delivers end-to-end recycling and recovery across municipal, commercial and industrial streams, improving client retention and cross-sell; US recycling rate was 32.1% in 2020 (EPA). Data-driven routing cuts route miles up to 20% and client payback often under 18 months. Programs reduce disposal costs up to 30% and support CSRD-aligned reporting for ~50,000 firms.
| Metric | Value |
|---|---|
| US recycling rate (2020) | 32.1% (EPA) |
| Route-mile reduction | up to 20% |
| Disposal cost savings | up to 30% |
| Typical payback | <18 months |
| CSRD in-scope firms | ~50,000 |
What is included in the product
 Detailed Word Document
Provides a concise strategic overview of Quest Resource’s internal strengths and weaknesses and external opportunities and threats to inform competitive positioning and growth decisions.

 Customizable Excel Spreadsheet
Provides a clear, actionable SWOT matrix for Quest Resource to quickly identify and address operational bottlenecks and strategic risks. Editable format enables rapid updates so teams can realign priorities and relieve pain points faster.
Weaknesses

Scale versus national majors
Large national haulers such as Waste Management, Republic and Waste Connections leverage network density and pricing power, leaving smaller operators like Quest Resource with higher unit costs and margin pressure; the three majors generated combined 2024 revenues exceeding $50 billion, illustrating scale advantages. Reliance on third‑party transfer stations or landfill access can limit pricing and operational control. In tight regional markets this constrains service levels and bidding competitiveness.
Asset-light dependence
Asset-light dependence means Quest relies on partner facilities and carriers, introducing service variability that has historically increased SLA breaches and client complaints. Vendor performance and availability directly affect on-time delivery and satisfaction metrics. Limited ownership of infrastructure constrains margin capture and exposes Quest to rising switching and coordination costs across its network.

Complex program delivery
Multi-stream, multi-site programs are operationally intricate, driving coordination overhead and raising execution risk as scope and geography expand. Designing bespoke solutions prolongs onboarding, often increasing upfront delivery costs; McKinsey/Oxford research found large IT projects run 45% over budget and deliver 56% less value. Variability complicates standardization and automation, amplifying cost and timeline volatility across sites.

Client concentration risk
A portfolio skewed to large enterprise accounts amplifies revenue volatility, since losing a single contract or volume decline can materially dent quarterly results. Pricing concessions at renewals compress margins and erode profitability on legacy deals. Dependence on a few sectors magnifies downturn effects and increases cash‑flow and execution risk.
- High single-customer exposure
- Contract loss → sharp revenue drop
- Renewal price pressure
- Sector concentration risk
Technology investment needs
Advanced routing, tracking, and reporting demand continuous capex and opex, and lagging analytics or customer portals erode differentiation. Cybersecurity and data quality pressures are escalating, with cybercrime costs projected at 10.5 trillion USD by 2025 and average breach costs about 4.45 million USD per IBM 2023; limited engineering resources can delay roadmap delivery.
- Capex/opex burden
- Analytics gap weakens differentiation
- Rising cyber/data costs
- Resource-driven roadmap delays
Scale gap to Big-3 >50B squeezes margins; asset-light raises SLA and cyber risk
Scale disadvantage vs national haulers: Waste Management, Republic and Waste Connections posted combined 2024 revenues >50 billion USD, pressuring Quest’s unit costs and margins.
Asset-light model raises SLA breaches and service variability; limited owned infrastructure constrains margin capture.
Tech/cyber spend gap: cybercrime costs projected 10.5 trillion USD by 2025; average breach cost ~4.45 million USD (IBM 2023).
| Metric | Value |
|---|---|
| Big-3 2024 revs | >50B USD |
| Cybercrime 2025 | 10.5T USD |
| Avg breach cost | 4.45M USD |
Same Document Delivered
Quest Resource SWOT Analysis
This is the actual Quest Resource SWOT analysis document you’ll receive upon purchase—no surprises, just professional quality. The preview below is taken directly from the full report and reflects the same structured, editable file you’ll download after payment. Purchase unlocks the complete, detailed version ready for immediate use.

Original: $10.00
-65%$10.00
$3.50Product Information
Product Information
Shipping & Returns
Shipping & Returns
Description
Go Beyond the Preview—Access the Full Strategic Report
Explore Quest Resource’s strategic position with our concise SWOT snapshot—spot strengths like asset depth, along with market risks and growth levers. Want the full picture with actionable insights, financial context, and editable tools? Purchase the complete SWOT analysis to plan, pitch, and invest with confidence.
Strengths
Integrated waste solutions
Quest Resource’s end-to-end programs span collection, recycling and resource recovery across municipal, commercial and industrial streams, simplifying vendor management and increasing client share of wallet. Comprehensive offerings enable cross-selling and more durable client relationships. Consistent service delivery supports better outcomes in a sector where US recycling rate was 32.1% in 2020 (EPA).
Tailored, data-driven programs
Tailored, data-driven programs align services to client cost and sustainability goals. Analytics identify diversion opportunities and optimize routes—industry studies show route-mile reductions up to 20%. Performance tracking documents ROI and compliance, with many clients reporting payback in under 18 months. This consultative model differentiates from commodity haulers.
Multi-industry footprint
Serving multiple verticals reduces sector-specific cyclicality, historically improving revenue resilience by roughly 10–15% during downturns according to cross-industry analyses. Knowledge transfer across industries accelerates solution design and execution, cutting time-to-market for new offerings by weeks to months. Diversification broadens the sales funnel and upsell potential while enhancing brand credibility as a cross-sector specialist.
Cost reduction and revenue uplift
Quest Resource programs cut disposal costs by up to 30% while lifting recycling revenue through improved material recovery; clients report tangible P&L impact with waste-to-value streams adding measurable EBITDA uplift. Clear financial benefits boost win rates, retention and justify outcome-based premium pricing and multi-year contracts, with some customers extending terms by 12–36 months.
- cost-savings: up to 30% lower disposal
- revenue-uplift: higher material recovery
- client-impact: measurable P&L/EBITDA gains
- commercial: higher win rates, 12–36 month contract extensions
Sustainability enablement
Quest enables clients to meet ESG targets and regulatory regimes such as the EU CSRD (in scope for ~50,000 firms), while standardized diversion and emissions reporting (GHG Protocol-aligned) strengthens auditability and governance. Alignment with corporate sustainability strategies increases executive sponsorship and positions Quest as a strategic partner rather than a vendor.
- ESG compliance: CSRD ~50,000 firms
- Reporting: diversion, Scope 1–3 emissions
- Governance: audit-ready data
- Positioning: strategic partner, executive buy-in
Smart recycling: route miles down 20%, payback 18 months
Quest Resource delivers end-to-end recycling and recovery across municipal, commercial and industrial streams, improving client retention and cross-sell; US recycling rate was 32.1% in 2020 (EPA). Data-driven routing cuts route miles up to 20% and client payback often under 18 months. Programs reduce disposal costs up to 30% and support CSRD-aligned reporting for ~50,000 firms.
| Metric | Value |
|---|---|
| US recycling rate (2020) | 32.1% (EPA) |
| Route-mile reduction | up to 20% |
| Disposal cost savings | up to 30% |
| Typical payback | <18 months |
| CSRD in-scope firms | ~50,000 |
What is included in the product
Detailed Word Document
Provides a concise strategic overview of Quest Resource’s internal strengths and weaknesses and external opportunities and threats to inform competitive positioning and growth decisions.
Customizable Excel Spreadsheet
Provides a clear, actionable SWOT matrix for Quest Resource to quickly identify and address operational bottlenecks and strategic risks. Editable format enables rapid updates so teams can realign priorities and relieve pain points faster.
Weaknesses
Scale versus national majors
Large national haulers such as Waste Management, Republic and Waste Connections leverage network density and pricing power, leaving smaller operators like Quest Resource with higher unit costs and margin pressure; the three majors generated combined 2024 revenues exceeding $50 billion, illustrating scale advantages. Reliance on third‑party transfer stations or landfill access can limit pricing and operational control. In tight regional markets this constrains service levels and bidding competitiveness.
Asset-light dependence
Asset-light dependence means Quest relies on partner facilities and carriers, introducing service variability that has historically increased SLA breaches and client complaints. Vendor performance and availability directly affect on-time delivery and satisfaction metrics. Limited ownership of infrastructure constrains margin capture and exposes Quest to rising switching and coordination costs across its network.
Complex program delivery
Multi-stream, multi-site programs are operationally intricate, driving coordination overhead and raising execution risk as scope and geography expand. Designing bespoke solutions prolongs onboarding, often increasing upfront delivery costs; McKinsey/Oxford research found large IT projects run 45% over budget and deliver 56% less value. Variability complicates standardization and automation, amplifying cost and timeline volatility across sites.
Client concentration risk
A portfolio skewed to large enterprise accounts amplifies revenue volatility, since losing a single contract or volume decline can materially dent quarterly results. Pricing concessions at renewals compress margins and erode profitability on legacy deals. Dependence on a few sectors magnifies downturn effects and increases cash‑flow and execution risk.
- High single-customer exposure
- Contract loss → sharp revenue drop
- Renewal price pressure
- Sector concentration risk
Technology investment needs
Advanced routing, tracking, and reporting demand continuous capex and opex, and lagging analytics or customer portals erode differentiation. Cybersecurity and data quality pressures are escalating, with cybercrime costs projected at 10.5 trillion USD by 2025 and average breach costs about 4.45 million USD per IBM 2023; limited engineering resources can delay roadmap delivery.
- Capex/opex burden
- Analytics gap weakens differentiation
- Rising cyber/data costs
- Resource-driven roadmap delays
Scale gap to Big-3 >50B squeezes margins; asset-light raises SLA and cyber risk
Scale disadvantage vs national haulers: Waste Management, Republic and Waste Connections posted combined 2024 revenues >50 billion USD, pressuring Quest’s unit costs and margins.
Asset-light model raises SLA breaches and service variability; limited owned infrastructure constrains margin capture.
Tech/cyber spend gap: cybercrime costs projected 10.5 trillion USD by 2025; average breach cost ~4.45 million USD (IBM 2023).
| Metric | Value |
|---|---|
| Big-3 2024 revs | >50B USD |
| Cybercrime 2025 | 10.5T USD |
| Avg breach cost | 4.45M USD |
Same Document Delivered
Quest Resource SWOT Analysis
This is the actual Quest Resource SWOT analysis document you’ll receive upon purchase—no surprises, just professional quality. The preview below is taken directly from the full report and reflects the same structured, editable file you’ll download after payment. Purchase unlocks the complete, detailed version ready for immediate use.











