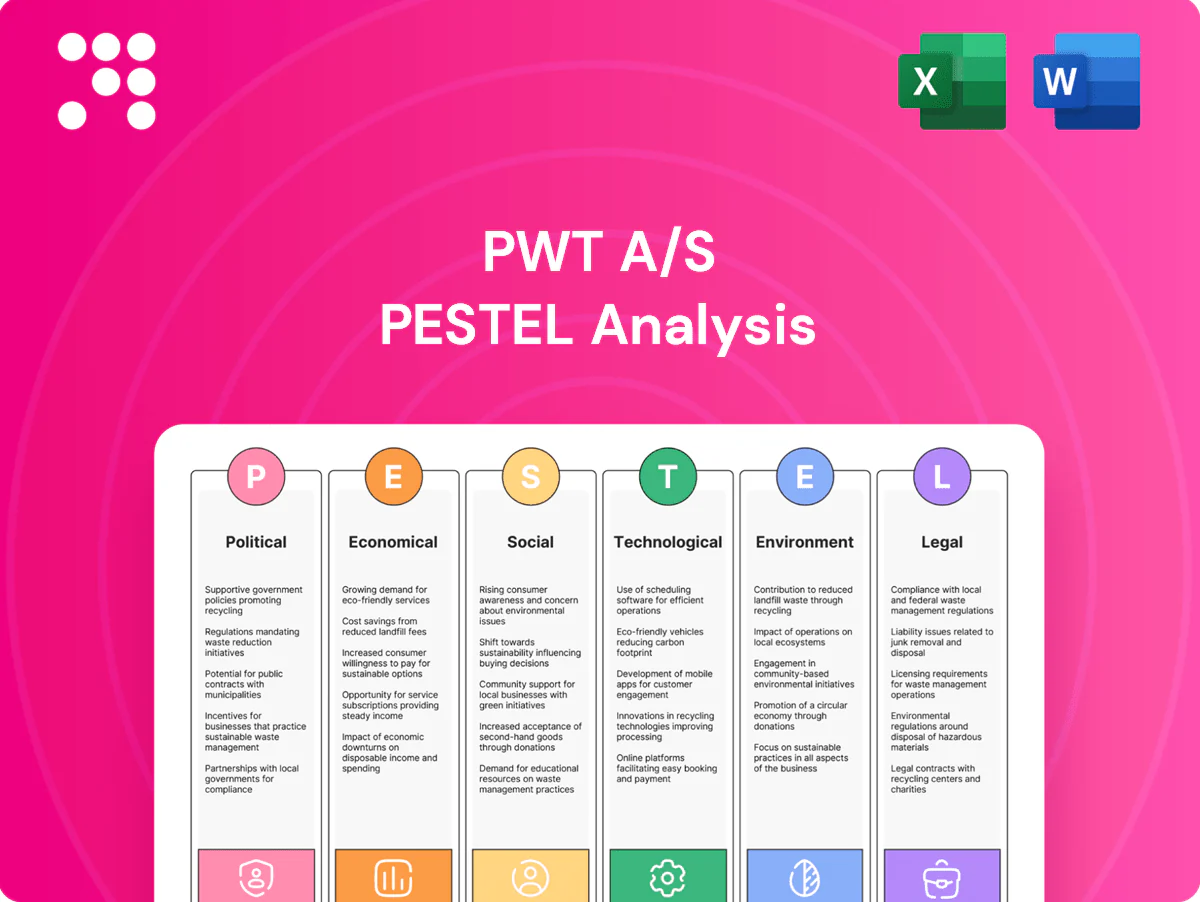
PWT A/S PESTLE Analysis

Your Competitive Advantage Starts with This Report
Unlock how political, economic, social, technological, legal and environmental forces are reshaping PWT A/S and identify downside risks and strategic opportunities in minutes. This concise PESTLE snapshot primes investors and strategists for deeper analysis. Purchase the full report to get exhaustive, ready-to-use insights and actionable recommendations.
Political factors

EU trade and customs policy
The EU’s common external tariff and customs procedures materially affect PWT’s landed costs for apparel, with EU MFN tariffs on clothing averaging roughly 11% (WTO 2023) and customs clearance adding days and fees that raise unit costs. Changes to EU-Vietnam EVFTA (tariffs largely eliminated for 99% of goods since 2020) or GSP terms for Bangladesh/others would shift sourcing economics. Harmonized rules of origin force strict vendor documentation; PWT must diversify suppliers and model tariff scenarios to protect margins.
Geopolitical supply chain risk
Instability in key sourcing regions can sharply disrupt lead times and availability. Sanctions and export controls on specific fibers or regions, for example US restrictions on cotton from Xinjiang since 2021, constrain compliance and sourcing options. Shipping route disruptions raise freight costs and uncertainty; about 80% of global trade by volume moves by sea (UNCTAD). Dual-sourcing and nearshoring improve resilience.

Nordic fiscal and labor policies
Denmark has no statutory minimum wage and funds social welfare largely through general taxation rather than high employer payroll taxes, while VAT is 25%, affecting retail margins. Changes to collective wage agreements, payroll-related levies like ATP/pension contributions, or retail opening rules will alter store economics. Government support for apprenticeships and green-investment grants can offset costs, and local procurement policies often favor regional suppliers. PWT should engage Danish policy programs to capture available subsidies.

VAT and cross-border ecommerce rules
EU VAT One-Stop Shop rules in force since July 2021 directly shape PWT A/S pricing and checkout flows; rate changes alter final consumer prices and margins with the EU average standard VAT at 21.7% (Eurostat 2024). Incorrect VAT handling drives cart abandonment—global average 69.8% (Baymard Institute 2023)—and triggers audits/penalties, so robust tax engines and geolocation pricing are required.
- OSS effective July 2021
- EU avg standard VAT 21.7% (Eurostat 2024)
- Global cart abandonment 69.8% (Baymard 2023)
Sustainability-driven policy push
EU and Denmark climate targets (EU -55% GHG by 2030; Denmark -70% by 2030) channel funding and penalties toward greener operations, raising costs for non-compliant textile players. Public procurement—about 14% of EU GDP—plus labelling rules steer demand to certified products. Tightening EU textile rules and circularity targets, amid roughly 5.8 Mt/yr EU textile waste, make early compliance a clear competitive differentiator for PWT brands.
- Policy pressure: EU -55% by 2030; Denmark -70% by 2030
- Procurement pull: public procurement ~14% of EU GDP
- Waste metric: ~5.8 Mt textile waste/yr in EU
- Advantage: early compliance = market/branding edge
EU tariffs, VAT and climate targets push up landed costs and sourcing risk
Political factors raise landed costs via EU MFN tariffs ~11% (WTO 2023) and VAT complexity (EU avg 21.7% Eurostat 2024), while trade agreements (EVFTA) and rules of origin shift sourcing economics. Sanctions/export controls (eg Xinjiang cotton restrictions since 2021) and shipping disruptions increase compliance and freight risk. Denmark/EU climate targets (DK -70% by 2030; EU -55% by 2030) and public procurement (~14% of EU GDP) push green investments; OSS VAT rules affect e-commerce conversion.
| Factor | Impact | Key data |
|---|---|---|
| Tariffs & VAT | Higher landed & retail prices | Tariff ~11%; VAT 21.7% |
| Trade rules & sanctions | Sourcing constraints | Xinjiang cotton curbs since 2021 |
| Climate policy | CapEx/Opex for compliance | DK -70% / EU -55% by 2030 |
| Public procurement | Market pull for certified goods | ~14% of EU GDP |
What is included in the product
 Detailed Word Document
Explores how macro-environmental forces — Political, Economic, Social, Technological, Environmental and Legal — uniquely affect PWT A/S, with data-backed trends, region- and industry-specific examples, forward-looking insights for scenario planning, and clean formatting tailored for executives, investors and strategists.

 Customizable Excel Spreadsheet
PWT A/S PESTLE delivers a clean, visually segmented summary of external risks and opportunities that’s editable for local context, easily dropped into presentations or shared across teams to speed strategic alignment.
Economic factors

Consumer spending cycles
Menswear demand tracks real income, employment and consumer confidence; the global apparel market was about 1.6 trillion USD in 2024, so shifts in disposable income materially impact volume. Downturns push consumers toward value and staple categories, while recovery phases favor wardrobe refreshes and occasion wear. PWT’s multi-brand tiering positions it to capture both value-led and mid-premium demand.
Inflation and input costs
Inflation in 2024 raised input costs—Brent averaged about $85/bbl and energy volatility plus cotton swings squeezed margins while freight (SCFI) remained >70% below the 2021 peak, compressing gross margins for PWT A/S. Pricing power is limited in wholesale but more flexible online, so cost engineering and fabric-mix optimization are vital. Early-season commitments and hedging (raw-material forwards, fuel contracts) reduce variance and protect margins.

FX and DKK-EUR dynamics
DKK’s peg to EUR at the official central rate of 7.46038 stabilizes euro-denominated sourcing and sales, reducing transactional FX risk for PWT A/S. Exposure remains where purchases are invoiced in USD or local Asian currencies, creating residual currency risk. Currency swings can offset or magnify cost inflation and margins. Natural hedging and use of forward contracts mitigate P&L shocks.

Channel mix and margin structure
Wholesale drives volume at ~20–25% gross margin with elevated sell-in/return risk; retail and ecommerce can yield ~45–55% gross margin but incur ~15–25% higher operating costs; omnichannel programs have been shown to raise full‑price sell‑through by about 7–12% and increase inventory turns, so PWT should reallocate by sell‑through data.
- Wholesale: volume, low margin (~20–25%)
- Retail/e‑commerce: higher gross margin (~45–55%), higher OPEX (+15–25%)
- Omnichannel: +7–12% full‑price sell‑through, better inventory turns
- Action: optimize allocation by sell‑through KPIs
Interest rates and working capital
Higher interest rates (Fed 5.25–5.50% and ECB ~4.00% mid‑2025) lift inventory financing and lease costs for PWT A/S, tightening margins. Longer supplier lead times can add 10–30 days to cash conversion cycles, increasing working capital needs. Tighter demand forecasting cuts excess stock and markdowns, while extended vendor terms and dynamic discounting (reducing DSO ~5 days, saving ~0.5–1.5%) improve liquidity.
- Rates: Fed 5.25–5.50%, ECB ~4.00% (mid‑2025)
- Lead time impact: +10–30 days CCC
- Forecasting: lowers stock/markdowns
- Vendor terms/dynamic discounting: −5 DSO; 0.5–1.5% savings
EU tariffs, VAT and climate targets push up landed costs and sourcing risk
Menswear ties to real income; global apparel ≈1.6T USD (2024) so disposable income swings drive volume. Inflation (Brent ≈85 USD/bbl 2024) and cotton/freight pressure margins; omnichannel (+7–12% full‑price sell‑through) and cost engineering protect profits. DKK peg 7.46038 stabilizes EUR flows; Fed 5.25–5.50% / ECB ~4.00% (mid‑2025) raise financing costs and WC needs.
| Metric | Value |
|---|---|
| Global apparel 2024 | 1.6T USD |
| Brent 2024 | ~85 USD/bbl |
| Wholesale GM | 20–25% |
| Retail/e‑com GM | 45–55% |
| Omnichannel uplift | +7–12% |
| DKK peg | 7.46038 |
| Rates mid‑2025 | Fed 5.25–5.50% / ECB ~4.00% |
What You See Is What You Get
PWT A/S PESTLE Analysis
The preview shown here is the exact PWT A/S PESTLE Analysis you’ll receive after purchase—fully formatted and ready to use. The content, layout, and professional structuring are identical to the downloadable file. No placeholders, no edits required.

Original: $10.00
-65%$10.00
$3.50Product Information
Product Information
Shipping & Returns
Shipping & Returns
Description
Your Competitive Advantage Starts with This Report
Unlock how political, economic, social, technological, legal and environmental forces are reshaping PWT A/S and identify downside risks and strategic opportunities in minutes. This concise PESTLE snapshot primes investors and strategists for deeper analysis. Purchase the full report to get exhaustive, ready-to-use insights and actionable recommendations.
Political factors
EU trade and customs policy
The EU’s common external tariff and customs procedures materially affect PWT’s landed costs for apparel, with EU MFN tariffs on clothing averaging roughly 11% (WTO 2023) and customs clearance adding days and fees that raise unit costs. Changes to EU-Vietnam EVFTA (tariffs largely eliminated for 99% of goods since 2020) or GSP terms for Bangladesh/others would shift sourcing economics. Harmonized rules of origin force strict vendor documentation; PWT must diversify suppliers and model tariff scenarios to protect margins.
Geopolitical supply chain risk
Instability in key sourcing regions can sharply disrupt lead times and availability. Sanctions and export controls on specific fibers or regions, for example US restrictions on cotton from Xinjiang since 2021, constrain compliance and sourcing options. Shipping route disruptions raise freight costs and uncertainty; about 80% of global trade by volume moves by sea (UNCTAD). Dual-sourcing and nearshoring improve resilience.
Nordic fiscal and labor policies
Denmark has no statutory minimum wage and funds social welfare largely through general taxation rather than high employer payroll taxes, while VAT is 25%, affecting retail margins. Changes to collective wage agreements, payroll-related levies like ATP/pension contributions, or retail opening rules will alter store economics. Government support for apprenticeships and green-investment grants can offset costs, and local procurement policies often favor regional suppliers. PWT should engage Danish policy programs to capture available subsidies.
VAT and cross-border ecommerce rules
EU VAT One-Stop Shop rules in force since July 2021 directly shape PWT A/S pricing and checkout flows; rate changes alter final consumer prices and margins with the EU average standard VAT at 21.7% (Eurostat 2024). Incorrect VAT handling drives cart abandonment—global average 69.8% (Baymard Institute 2023)—and triggers audits/penalties, so robust tax engines and geolocation pricing are required.
- OSS effective July 2021
- EU avg standard VAT 21.7% (Eurostat 2024)
- Global cart abandonment 69.8% (Baymard 2023)
Sustainability-driven policy push
EU and Denmark climate targets (EU -55% GHG by 2030; Denmark -70% by 2030) channel funding and penalties toward greener operations, raising costs for non-compliant textile players. Public procurement—about 14% of EU GDP—plus labelling rules steer demand to certified products. Tightening EU textile rules and circularity targets, amid roughly 5.8 Mt/yr EU textile waste, make early compliance a clear competitive differentiator for PWT brands.
- Policy pressure: EU -55% by 2030; Denmark -70% by 2030
- Procurement pull: public procurement ~14% of EU GDP
- Waste metric: ~5.8 Mt textile waste/yr in EU
- Advantage: early compliance = market/branding edge
EU tariffs, VAT and climate targets push up landed costs and sourcing risk
Political factors raise landed costs via EU MFN tariffs ~11% (WTO 2023) and VAT complexity (EU avg 21.7% Eurostat 2024), while trade agreements (EVFTA) and rules of origin shift sourcing economics. Sanctions/export controls (eg Xinjiang cotton restrictions since 2021) and shipping disruptions increase compliance and freight risk. Denmark/EU climate targets (DK -70% by 2030; EU -55% by 2030) and public procurement (~14% of EU GDP) push green investments; OSS VAT rules affect e-commerce conversion.
| Factor | Impact | Key data |
|---|---|---|
| Tariffs & VAT | Higher landed & retail prices | Tariff ~11%; VAT 21.7% |
| Trade rules & sanctions | Sourcing constraints | Xinjiang cotton curbs since 2021 |
| Climate policy | CapEx/Opex for compliance | DK -70% / EU -55% by 2030 |
| Public procurement | Market pull for certified goods | ~14% of EU GDP |
What is included in the product
Detailed Word Document
Explores how macro-environmental forces — Political, Economic, Social, Technological, Environmental and Legal — uniquely affect PWT A/S, with data-backed trends, region- and industry-specific examples, forward-looking insights for scenario planning, and clean formatting tailored for executives, investors and strategists.
Customizable Excel Spreadsheet
PWT A/S PESTLE delivers a clean, visually segmented summary of external risks and opportunities that’s editable for local context, easily dropped into presentations or shared across teams to speed strategic alignment.
Economic factors
Consumer spending cycles
Menswear demand tracks real income, employment and consumer confidence; the global apparel market was about 1.6 trillion USD in 2024, so shifts in disposable income materially impact volume. Downturns push consumers toward value and staple categories, while recovery phases favor wardrobe refreshes and occasion wear. PWT’s multi-brand tiering positions it to capture both value-led and mid-premium demand.
Inflation and input costs
Inflation in 2024 raised input costs—Brent averaged about $85/bbl and energy volatility plus cotton swings squeezed margins while freight (SCFI) remained >70% below the 2021 peak, compressing gross margins for PWT A/S. Pricing power is limited in wholesale but more flexible online, so cost engineering and fabric-mix optimization are vital. Early-season commitments and hedging (raw-material forwards, fuel contracts) reduce variance and protect margins.
FX and DKK-EUR dynamics
DKK’s peg to EUR at the official central rate of 7.46038 stabilizes euro-denominated sourcing and sales, reducing transactional FX risk for PWT A/S. Exposure remains where purchases are invoiced in USD or local Asian currencies, creating residual currency risk. Currency swings can offset or magnify cost inflation and margins. Natural hedging and use of forward contracts mitigate P&L shocks.
Channel mix and margin structure
Wholesale drives volume at ~20–25% gross margin with elevated sell-in/return risk; retail and ecommerce can yield ~45–55% gross margin but incur ~15–25% higher operating costs; omnichannel programs have been shown to raise full‑price sell‑through by about 7–12% and increase inventory turns, so PWT should reallocate by sell‑through data.
- Wholesale: volume, low margin (~20–25%)
- Retail/e‑commerce: higher gross margin (~45–55%), higher OPEX (+15–25%)
- Omnichannel: +7–12% full‑price sell‑through, better inventory turns
- Action: optimize allocation by sell‑through KPIs
Interest rates and working capital
Higher interest rates (Fed 5.25–5.50% and ECB ~4.00% mid‑2025) lift inventory financing and lease costs for PWT A/S, tightening margins. Longer supplier lead times can add 10–30 days to cash conversion cycles, increasing working capital needs. Tighter demand forecasting cuts excess stock and markdowns, while extended vendor terms and dynamic discounting (reducing DSO ~5 days, saving ~0.5–1.5%) improve liquidity.
- Rates: Fed 5.25–5.50%, ECB ~4.00% (mid‑2025)
- Lead time impact: +10–30 days CCC
- Forecasting: lowers stock/markdowns
- Vendor terms/dynamic discounting: −5 DSO; 0.5–1.5% savings
EU tariffs, VAT and climate targets push up landed costs and sourcing risk
Menswear ties to real income; global apparel ≈1.6T USD (2024) so disposable income swings drive volume. Inflation (Brent ≈85 USD/bbl 2024) and cotton/freight pressure margins; omnichannel (+7–12% full‑price sell‑through) and cost engineering protect profits. DKK peg 7.46038 stabilizes EUR flows; Fed 5.25–5.50% / ECB ~4.00% (mid‑2025) raise financing costs and WC needs.
| Metric | Value |
|---|---|
| Global apparel 2024 | 1.6T USD |
| Brent 2024 | ~85 USD/bbl |
| Wholesale GM | 20–25% |
| Retail/e‑com GM | 45–55% |
| Omnichannel uplift | +7–12% |
| DKK peg | 7.46038 |
| Rates mid‑2025 | Fed 5.25–5.50% / ECB ~4.00% |
What You See Is What You Get
PWT A/S PESTLE Analysis
The preview shown here is the exact PWT A/S PESTLE Analysis you’ll receive after purchase—fully formatted and ready to use. The content, layout, and professional structuring are identical to the downloadable file. No placeholders, no edits required.











