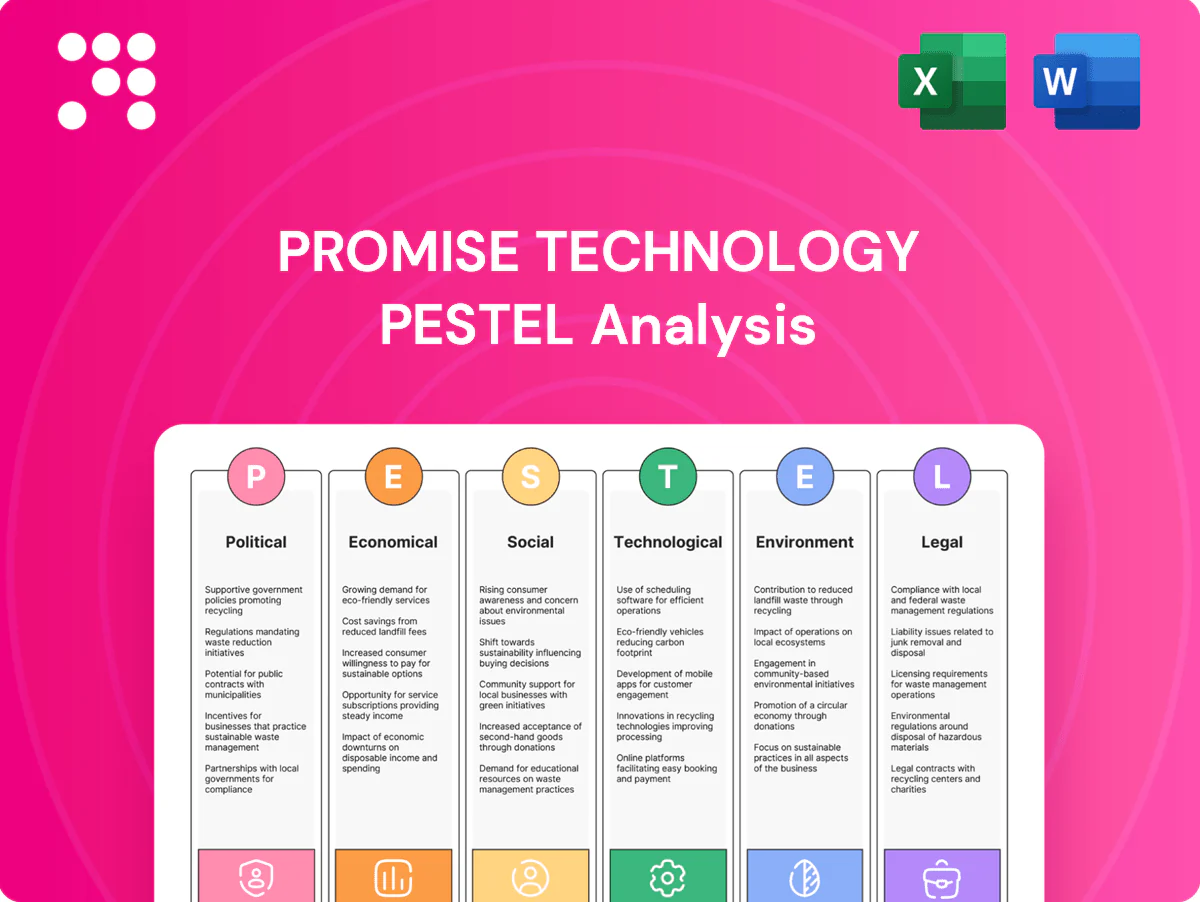
Promise Technology PESTLE Analysis

Your Competitive Advantage Starts with This Report
Unlock strategic clarity with our PESTLE Analysis of Promise Technology—three-to-five sentence snapshot reveals how political shifts, market economics, and tech trends impact growth and risk; perfect for investors and strategists. Purchase the full report for the complete, actionable external landscape and ready-to-use insights.
Political factors

Trade policy and tariffs
Shifting tariff regimes — notably US Section 301 duties on Chinese goods of up to 25% — raise component costs and pricing for global storage supply chains. US–China and EU–Asia frictions can compress margins and delay deliveries. Promise Technology should diversify sourcing, use tariff‑engineering and flexible contracts. Active monitoring and contract flexibility mitigate volatility.
Geopolitical tensions
Semiconductor and storage components are highly exposed to East Asia geopolitical risk: TSMC controls roughly 50–60% of global foundry revenue and about 90% of leading-edge (<7nm) capacity, concentrating supply. Escalation can disrupt logistics, foundry output or cross-border R&D, raising lead times and costs. Scenario planning and dual-sourcing into politically stable regions (ASEAN, US, EU) reduce exposure. Proactive customer communication of continuity plans preserves trust and contract stability.

Government incentives
CHIPS-like subsidies (US CHIPS Act authorizes $52 billion; EU mobilization ~€43 billion) plus local manufacturing grants and data-center incentives can reduce capex—analysts estimate up to 10–15% savings on facility costs. Aligning production or integration within eligible jurisdictions unlocks tax credits and sliding-scale grants. Promise can partner with local governments on surveillance and cloud projects, while bidding teams must track incentive timelines, caps and compliance obligations.

Public sector surveillance policy
National and municipal surveillance initiatives are driving steady storage demand, with the global video surveillance market near USD 45 billion in 2023 and public-sector projects accounting for an estimated 25% of deployments. Political shifts can expand or curtail funding for security infrastructure, changing procurement pipelines within 1–3 years. Promise should align offerings with public procurement standards and certifications (e.g., FIPS, Common Criteria). Long-cycle contracts reduce revenue cyclicality but require robust compliance and audit readiness.
- 25% public-sector share
- Align to FIPS/Common Criteria
- Long-cycle contracts → revenue stability
- Political risk alters 1–3 year funding
Export controls
Tighter U.S. and allied controls since 2022 on advanced semiconductors and encryption increasingly restrict Promise Technology shipment eligibility to certain customers and destinations.
Rigorous screening of customers and configurations is essential to avoid denial orders and fines that in recent enforcement cases have exceeded 1,000,000 USD.
Maintaining alternative SKUs for restricted markets preserves revenue while legal and sales operations must coordinate on license management and classification tracking.
- controls: expanded since 2022 to cover advanced chips & encryption
- risk: enforcement fines have exceeded 1,000,000 USD
- mitigation: alternative SKUs for restricted markets
- ops: tight legal–sales coordination for licensing
Tariffs, export controls and foundry concentration force dual-sourcing and strict license controls
Geopolitical tensions (US tariffs up to 25%) and export controls since 2022 constrain sourcing and sales; TSMC holds ~50–60% foundry revenue and ~90% <7nm capacity. CHIPS/EU funds (US $52B; EU ~€43B) and a ~$45B (2023) surveillance market with ~25% public share shape demand. Enforcement fines have exceeded 1,000,000 USD; dual‑sourcing, compliant SKUs and strict license controls are essential.
| Factor | Key metric | Implication | Mitigation |
|---|---|---|---|
| Tariffs | Up to 25% | Higher costs | Tariff engineering |
| Foundry concentration | TSMC ~50–60% rev; ~90% <7nm | Supply risk | Dual‑sourcing |
| Subsidies | US $52B; EU ~€43B | Capex relief | Local partnerships |
What is included in the product
 Detailed Word Document
Explores how Political, Economic, Social, Technological, Environmental, and Legal forces uniquely affect Promise Technology, linking each dimension to current market, regulatory, and regional dynamics; sections include data-backed subpoints, forward-looking insights, and practical implications to guide strategy, risk management, and investor-ready materials.

 Customizable Excel Spreadsheet
A concise, visually segmented PESTLE summary for Promise Technology that eases meeting prep and risk discussions; editable notes let teams adapt insights by region or product, and the shareable format drops straight into presentations or strategy packs.
Economic factors

Capex cycles
Data center and media customers shift storage spend with macro capex cycles; hyperscalers drove roughly two-thirds of global data center capex in 2024, so downturns prompt delayed projects and rising ASP pressure while upswings drive rapid capacity ramps. Promise can smooth demand by offering flexible financing and modular upgrades that convert large buys into phased deployments. Improved backlog visibility aids production planning and lowers lead-time risk.
Component cost volatility
NAND, DRAM and HDD prices move with supply-demand cycles, directly compressing or expanding Promise Technologys gross margins; Samsung held roughly 43% of the DRAM market and about 33% of NAND in 2024, concentrating price influence. Hedging, long-term vendor agreements and design optionality (supporting multiple memory/HDD suppliers) help stabilize COGS. Including transparent price-index clauses tied to industry spot indices has been shown to protect profitability during volatile quarters.

Currency fluctuations
With sales and sourcing across regions, FX moves affect Promise Technology revenue translation and input costs; as of July 2025 the US dollar index (DXY) sits near 104 and EUR/USD ≈1.10, pressuring non-US pricing competitiveness. Dollar strength compresses margins for international sales. Natural hedging and selective hedging instruments (forwards, options) reduce volatility, while multi-currency pricing mitigates customer friction.

Cloud and edge growth
Secular growth in cloud, AI, and edge expands storage TAM—global cloud services reached about $620B in 2024, AI infrastructure is growing ~27% CAGR (2024–28), and edge computing was ~60B in 2024 with ~20% CAGR, shifting budgets to high-performance, scalable architectures. Promise should pursue vertical SKUs and service-attach to capture recurring revenue and use integrator partnerships to accelerate channel reach.
- Market size: cloud $620B (2024)
- AI infra growth: ~27% CAGR (2024–28)
- Edge market: ~$60B (2024), ~20% CAGR
- Strategy: vertical SKUs, service attach, integrator partnerships
Inflation and interest rates
- Higher financing costs: tighter credit, elevated WACC
- Inflation impact: higher labor, logistics, materials
- Margin defense: value engineering, automation
- Pricing lever: TCO messaging enhances pricing power
Tariffs, export controls and foundry concentration force dual-sourcing and strict license controls
Hyperscaler-driven capex (≈66% of data‑center spend in 2024) causes lumpy demand and ASP pressure; flexible financing and modular SKUs smooth revenue. Component concentration (Samsung ≈43% DRAM, ≈33% NAND in 2024) and volatile NAND/DRAM/HDD pricing compress margins; hedging and multi‑vendor designs mitigate risk. Strong USD (DXY ≈104, Jul 2025) and mid‑2024 Fed funds 5.25–5.50 raise costs and depress non‑USD competitiveness.
| Metric | Value |
|---|---|
| Hyperscaler share (2024) | ≈66% |
| Cloud TAM (2024) | $620B |
| DXY (Jul 2025) | ≈104 |
| Fed funds (mid‑2024) | 5.25–5.50% |
| Samsung market share (2024) | DRAM ≈43%, NAND ≈33% |
Preview the Actual Deliverable
Promise Technology PESTLE Analysis
The preview shown here is the exact Promise Technology PESTLE Analysis you’ll receive after purchase—fully formatted and ready to use. It summarizes political, economic, social, technological, legal and environmental factors affecting Promise Technology with actionable insights. No placeholders or teasers—this is the final, downloadable file. Use it immediately after checkout.

Original: $10.00
-65%$10.00
$3.50Product Information
Product Information
Shipping & Returns
Shipping & Returns
Description
Your Competitive Advantage Starts with This Report
Unlock strategic clarity with our PESTLE Analysis of Promise Technology—three-to-five sentence snapshot reveals how political shifts, market economics, and tech trends impact growth and risk; perfect for investors and strategists. Purchase the full report for the complete, actionable external landscape and ready-to-use insights.
Political factors
Trade policy and tariffs
Shifting tariff regimes — notably US Section 301 duties on Chinese goods of up to 25% — raise component costs and pricing for global storage supply chains. US–China and EU–Asia frictions can compress margins and delay deliveries. Promise Technology should diversify sourcing, use tariff‑engineering and flexible contracts. Active monitoring and contract flexibility mitigate volatility.
Geopolitical tensions
Semiconductor and storage components are highly exposed to East Asia geopolitical risk: TSMC controls roughly 50–60% of global foundry revenue and about 90% of leading-edge (<7nm) capacity, concentrating supply. Escalation can disrupt logistics, foundry output or cross-border R&D, raising lead times and costs. Scenario planning and dual-sourcing into politically stable regions (ASEAN, US, EU) reduce exposure. Proactive customer communication of continuity plans preserves trust and contract stability.
Government incentives
CHIPS-like subsidies (US CHIPS Act authorizes $52 billion; EU mobilization ~€43 billion) plus local manufacturing grants and data-center incentives can reduce capex—analysts estimate up to 10–15% savings on facility costs. Aligning production or integration within eligible jurisdictions unlocks tax credits and sliding-scale grants. Promise can partner with local governments on surveillance and cloud projects, while bidding teams must track incentive timelines, caps and compliance obligations.
Public sector surveillance policy
National and municipal surveillance initiatives are driving steady storage demand, with the global video surveillance market near USD 45 billion in 2023 and public-sector projects accounting for an estimated 25% of deployments. Political shifts can expand or curtail funding for security infrastructure, changing procurement pipelines within 1–3 years. Promise should align offerings with public procurement standards and certifications (e.g., FIPS, Common Criteria). Long-cycle contracts reduce revenue cyclicality but require robust compliance and audit readiness.
- 25% public-sector share
- Align to FIPS/Common Criteria
- Long-cycle contracts → revenue stability
- Political risk alters 1–3 year funding
Export controls
Tighter U.S. and allied controls since 2022 on advanced semiconductors and encryption increasingly restrict Promise Technology shipment eligibility to certain customers and destinations.
Rigorous screening of customers and configurations is essential to avoid denial orders and fines that in recent enforcement cases have exceeded 1,000,000 USD.
Maintaining alternative SKUs for restricted markets preserves revenue while legal and sales operations must coordinate on license management and classification tracking.
- controls: expanded since 2022 to cover advanced chips & encryption
- risk: enforcement fines have exceeded 1,000,000 USD
- mitigation: alternative SKUs for restricted markets
- ops: tight legal–sales coordination for licensing
Tariffs, export controls and foundry concentration force dual-sourcing and strict license controls
Geopolitical tensions (US tariffs up to 25%) and export controls since 2022 constrain sourcing and sales; TSMC holds ~50–60% foundry revenue and ~90% <7nm capacity. CHIPS/EU funds (US $52B; EU ~€43B) and a ~$45B (2023) surveillance market with ~25% public share shape demand. Enforcement fines have exceeded 1,000,000 USD; dual‑sourcing, compliant SKUs and strict license controls are essential.
| Factor | Key metric | Implication | Mitigation |
|---|---|---|---|
| Tariffs | Up to 25% | Higher costs | Tariff engineering |
| Foundry concentration | TSMC ~50–60% rev; ~90% <7nm | Supply risk | Dual‑sourcing |
| Subsidies | US $52B; EU ~€43B | Capex relief | Local partnerships |
What is included in the product
Detailed Word Document
Explores how Political, Economic, Social, Technological, Environmental, and Legal forces uniquely affect Promise Technology, linking each dimension to current market, regulatory, and regional dynamics; sections include data-backed subpoints, forward-looking insights, and practical implications to guide strategy, risk management, and investor-ready materials.
Customizable Excel Spreadsheet
A concise, visually segmented PESTLE summary for Promise Technology that eases meeting prep and risk discussions; editable notes let teams adapt insights by region or product, and the shareable format drops straight into presentations or strategy packs.
Economic factors
Capex cycles
Data center and media customers shift storage spend with macro capex cycles; hyperscalers drove roughly two-thirds of global data center capex in 2024, so downturns prompt delayed projects and rising ASP pressure while upswings drive rapid capacity ramps. Promise can smooth demand by offering flexible financing and modular upgrades that convert large buys into phased deployments. Improved backlog visibility aids production planning and lowers lead-time risk.
Component cost volatility
NAND, DRAM and HDD prices move with supply-demand cycles, directly compressing or expanding Promise Technologys gross margins; Samsung held roughly 43% of the DRAM market and about 33% of NAND in 2024, concentrating price influence. Hedging, long-term vendor agreements and design optionality (supporting multiple memory/HDD suppliers) help stabilize COGS. Including transparent price-index clauses tied to industry spot indices has been shown to protect profitability during volatile quarters.
Currency fluctuations
With sales and sourcing across regions, FX moves affect Promise Technology revenue translation and input costs; as of July 2025 the US dollar index (DXY) sits near 104 and EUR/USD ≈1.10, pressuring non-US pricing competitiveness. Dollar strength compresses margins for international sales. Natural hedging and selective hedging instruments (forwards, options) reduce volatility, while multi-currency pricing mitigates customer friction.
Cloud and edge growth
Secular growth in cloud, AI, and edge expands storage TAM—global cloud services reached about $620B in 2024, AI infrastructure is growing ~27% CAGR (2024–28), and edge computing was ~60B in 2024 with ~20% CAGR, shifting budgets to high-performance, scalable architectures. Promise should pursue vertical SKUs and service-attach to capture recurring revenue and use integrator partnerships to accelerate channel reach.
- Market size: cloud $620B (2024)
- AI infra growth: ~27% CAGR (2024–28)
- Edge market: ~$60B (2024), ~20% CAGR
- Strategy: vertical SKUs, service attach, integrator partnerships
Inflation and interest rates
- Higher financing costs: tighter credit, elevated WACC
- Inflation impact: higher labor, logistics, materials
- Margin defense: value engineering, automation
- Pricing lever: TCO messaging enhances pricing power
Tariffs, export controls and foundry concentration force dual-sourcing and strict license controls
Hyperscaler-driven capex (≈66% of data‑center spend in 2024) causes lumpy demand and ASP pressure; flexible financing and modular SKUs smooth revenue. Component concentration (Samsung ≈43% DRAM, ≈33% NAND in 2024) and volatile NAND/DRAM/HDD pricing compress margins; hedging and multi‑vendor designs mitigate risk. Strong USD (DXY ≈104, Jul 2025) and mid‑2024 Fed funds 5.25–5.50 raise costs and depress non‑USD competitiveness.
| Metric | Value |
|---|---|
| Hyperscaler share (2024) | ≈66% |
| Cloud TAM (2024) | $620B |
| DXY (Jul 2025) | ≈104 |
| Fed funds (mid‑2024) | 5.25–5.50% |
| Samsung market share (2024) | DRAM ≈43%, NAND ≈33% |
Preview the Actual Deliverable
Promise Technology PESTLE Analysis
The preview shown here is the exact Promise Technology PESTLE Analysis you’ll receive after purchase—fully formatted and ready to use. It summarizes political, economic, social, technological, legal and environmental factors affecting Promise Technology with actionable insights. No placeholders or teasers—this is the final, downloadable file. Use it immediately after checkout.











