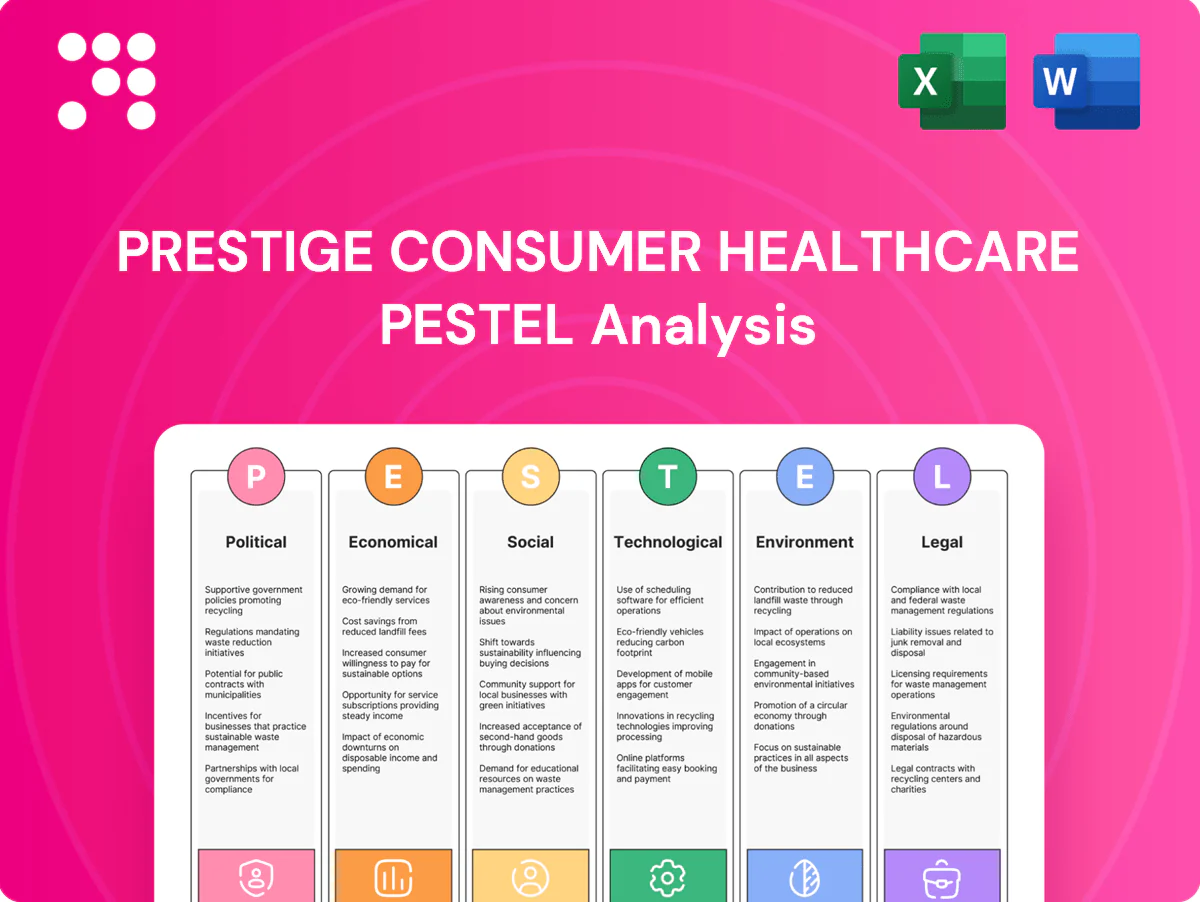
Prestige Consumer Healthcare PESTLE Analysis

Plan Smarter. Present Sharper. Compete Stronger.
Our PESTLE Analysis of Prestige Consumer Healthcare reveals how regulatory shifts, consumer trends, and technological advances will shape the company's growth and risk profile. Ideal for investors and strategists, this concise briefing highlights key external drivers and strategic implications. Purchase the full report to access actionable insights and detailed recommendations.
Political factors

OTC policy and regulator priorities
Shifts in FDA, Health Canada and TGA priorities in 2024–25 affect OTC monograph updates, approvals and enforcement intensity, altering time-to-market for line extensions. Faster or slower regulatory review cycles directly change launch timing and working capital needs. Public health agendas such as pain-relief misuse reviews have prompted tighter controls and reformulations. Policy stability supports planning; volatility raises compliance costs and risk-adjusted margins.
Trade and import dynamics
Tariffs (typically 2–10% on inputs) and customs bottlenecks that can add days to weeks to lead times materially raise input costs and working capital needs; geopolitical tensions have disrupted API flows and packaging in 2023–24. Stable North America–Australia lanes aid planning but any shock can ripple across packaging and APIs. Rising government manufacturing incentives and preferential trade agreements lower landed-cost risk and reshape sourcing.

Healthcare spending and public campaigns
Government promotion of self-care tends to shift demand from prescriptions to OTC, supporting Prestige’s OTC focus against a US health system that spent about 4.5 trillion dollars in 2022 (CMS); public funding of preventive campaigns increases demand in eye and oral care categories often targeted by $100s of millions in public programs; subsidized Rx alternatives can compress OTC volumes in specific segments, while policy-driven stockpiling causes temporary demand spikes seen in past crises.

Retail and pricing oversight
- Retailer concentration: CVS/Walgreens/Walmart ~60%
- Prestige FY2024 net sales ~1.1B USD
- 2024 state pricing/transparency laws rising — higher compliance costs
- Result: tighter promotion cadence, compressed vendor margins
Workforce and industrial policies
Immigration, labor and training policies shape availability of skilled manufacturing and QA staff for Prestige; US manufacturing employment ~12.5 million (BLS 2024), and tighter visa rules can raise hiring costs and time-to-fill critical roles.
Federal incentives for advanced manufacturing (eg CHIPS funding ~52 billion USD) encourage automation capex; the 21% US federal corporate tax rate affects after-tax cash for M&A, while local content rules can force supply‑chain or footprint adjustments.
- Immigration: affects skilled QA/manufacturing hires
- Incentives: CHIPS ~52B supports automation
- Tax: 21% federal rate alters M&A cash
- Local content: may require facility shifts
Regulation, tariffs and labor squeeze launches; retailer power ~60%, tax 21%
Political shifts (FDA/TGA enforcement, state pricing laws) alter launch timing and compliance costs; retailer concentration (CVS/Walgreens/Walmart ~60%) compresses margins vs Prestige FY2024 sales ~1.1B USD. Trade/tariff disruptions and visa limits raise input and labor costs. Federal tax 21% and CHIPS ~52B affect cash for automation and M&A.
| Metric | Value |
|---|---|
| Retailer concentration | ~60% |
| Prestige FY2024 sales | ~1.1B USD |
| US mfg employment (BLS 2024) | 12.5M |
| CHIPS funding | ~52B USD |
| Federal tax rate | 21% |
What is included in the product
 Detailed Word Document
Explores how macro-environmental forces uniquely affect Prestige Consumer Healthcare across Political, Economic, Social, Technological, Environmental, and Legal dimensions, with data-driven trends and sector-specific examples. Designed for executives and investors, it highlights actionable risks, opportunities, and forward-looking insights to support strategy and funding decisions.

 Customizable Excel Spreadsheet
A concise, visually segmented PESTLE summary of Prestige Consumer Healthcare that relieves pain by highlighting external risks, regulatory and market drivers for quick insertion into presentations or team planning; editable notes enable region- or product-specific context.
Economic factors

Consumer confidence and trading down
Macro slowdowns and a 2024 Conference Board consumer confidence average near 102.7 pushed shoppers toward value packs and private label (private-label share ~18.6% in 2024), pressuring branded OTCs. Branded OTCs must defend price-premium with efficacy claims and trusted heritage to justify MSRP. Managing promotional depth and elasticity is critical to protect margins, while 2025 recovery cycles permit premiumization and mix improvement.
Inflation and input costs
API, excipient and packaging inflation have compressed Prestige Consumer Healthcare margins amid 3.4% US CPI in 2024; category pricing power varies with differentiation and retailer shelf dynamics. Hedging and multi-sourcing strategies blunt input volatility, while ongoing efficiency programs have helped sustain margin resilience during recent cost spikes.

FX exposure (USD/AUD)
Revenue and cost mismatches between USD and AUD materially influence Prestige Consumer Healthcare reported results as USD/AUD moved roughly 7% year-over-year to about 1.60 by mid-2025, creating translation and transactional margin pressure. Currency swings compressed gross margins in Q2 2025 while natural hedges from offshore sourcing and financial hedging programs (forward contracts) reduced volatility. A geographically diversified portfolio mix, with key markets outside the US, helps buffer adverse moves.

Retailer consolidation and terms
Retailer consolidation gives large chains and e-commerce platforms outsized leverage over slotting, MDF and returns policies, squeezing net pricing and pressuring working capital; the top 4 US retailers still account for roughly 40% of grocery sales, concentrating buyer power. Omnichannel growth (online share near 15% for CPG in 2024) rewards reliable fill rates and high-quality digital content while return/MDF demands raise cost of trade. Diversifying channels reduces concentration risk and stabilizes margins.
- Slotting/MDF pressure: higher trade spend burden
- Net pricing: margin compression from tougher terms
- Omnichannel payoff: reliability + digital content = share gains
- Mitigation: diversify channels to lower concentration risk
Interest rates and M&A capacity
US policy rates at 5.25–5.50% (July 2025) raise debt service and compress M&A appetite, pushing acquirers to higher hurdle rates for brand deals and product launches. Deleveraging at target firms expands optionality during tightening, while effective synergy capture is pivotal to justify premiums and create post‑deal value.
- Fed funds 5.25–5.50% (Jul 2025)
- Higher cost of capital → higher hurdle rates
- Lower leverage → more M&A flexibility
- Synergies essential to unlock deal value
Regulation, tariffs and labor squeeze launches; retailer power ~60%, tax 21%
Consumer confidence averaged 102.7 in 2024, driving value pack/private‑label share (~18.6%) and pressuring branded OTCs; US CPI 3.4% in 2024 and input inflation compressed margins. Fed funds 5.25–5.50% (Jul 2025) raises cost of capital and slows M&A; USD/AUD ≈1.60 mid‑2025 added translation pressure while top‑4 retailers ~40% share and online CPG ~15% reshape trade dynamics.
| Metric | Value | Impact |
|---|---|---|
| Consumer confidence (2024) | 102.7 | Shift to value |
| Private‑label share (2024) | 18.6% | Branded pressure |
| US CPI (2024) | 3.4% | Input cost |
| Fed funds (Jul 2025) | 5.25–5.50% | Higher hurdle rates |
| USD/AUD (mid‑2025) | ≈1.60 | Translation drag |
| Top‑4 retailers | ≈40% | Buyer leverage |
| Online CPG share (2024) | ≈15% | Omnichannel importance |
What You See Is What You Get
Prestige Consumer Healthcare PESTLE Analysis
The preview shown is the exact Prestige Consumer Healthcare PESTLE Analysis you’ll receive after purchase, fully formatted and ready to use. It contains the complete political, economic, social, technological, legal, and environmental assessment. No placeholders or teasers—this is the final, downloadable file. You’ll get this identical document immediately after checkout.

Product Information
Product Information
Shipping & Returns
Shipping & Returns
Description
Plan Smarter. Present Sharper. Compete Stronger.
Our PESTLE Analysis of Prestige Consumer Healthcare reveals how regulatory shifts, consumer trends, and technological advances will shape the company's growth and risk profile. Ideal for investors and strategists, this concise briefing highlights key external drivers and strategic implications. Purchase the full report to access actionable insights and detailed recommendations.
Political factors
OTC policy and regulator priorities
Shifts in FDA, Health Canada and TGA priorities in 2024–25 affect OTC monograph updates, approvals and enforcement intensity, altering time-to-market for line extensions. Faster or slower regulatory review cycles directly change launch timing and working capital needs. Public health agendas such as pain-relief misuse reviews have prompted tighter controls and reformulations. Policy stability supports planning; volatility raises compliance costs and risk-adjusted margins.
Trade and import dynamics
Tariffs (typically 2–10% on inputs) and customs bottlenecks that can add days to weeks to lead times materially raise input costs and working capital needs; geopolitical tensions have disrupted API flows and packaging in 2023–24. Stable North America–Australia lanes aid planning but any shock can ripple across packaging and APIs. Rising government manufacturing incentives and preferential trade agreements lower landed-cost risk and reshape sourcing.
Healthcare spending and public campaigns
Government promotion of self-care tends to shift demand from prescriptions to OTC, supporting Prestige’s OTC focus against a US health system that spent about 4.5 trillion dollars in 2022 (CMS); public funding of preventive campaigns increases demand in eye and oral care categories often targeted by $100s of millions in public programs; subsidized Rx alternatives can compress OTC volumes in specific segments, while policy-driven stockpiling causes temporary demand spikes seen in past crises.
Retail and pricing oversight
- Retailer concentration: CVS/Walgreens/Walmart ~60%
- Prestige FY2024 net sales ~1.1B USD
- 2024 state pricing/transparency laws rising — higher compliance costs
- Result: tighter promotion cadence, compressed vendor margins
Workforce and industrial policies
Immigration, labor and training policies shape availability of skilled manufacturing and QA staff for Prestige; US manufacturing employment ~12.5 million (BLS 2024), and tighter visa rules can raise hiring costs and time-to-fill critical roles.
Federal incentives for advanced manufacturing (eg CHIPS funding ~52 billion USD) encourage automation capex; the 21% US federal corporate tax rate affects after-tax cash for M&A, while local content rules can force supply‑chain or footprint adjustments.
- Immigration: affects skilled QA/manufacturing hires
- Incentives: CHIPS ~52B supports automation
- Tax: 21% federal rate alters M&A cash
- Local content: may require facility shifts
Regulation, tariffs and labor squeeze launches; retailer power ~60%, tax 21%
Political shifts (FDA/TGA enforcement, state pricing laws) alter launch timing and compliance costs; retailer concentration (CVS/Walgreens/Walmart ~60%) compresses margins vs Prestige FY2024 sales ~1.1B USD. Trade/tariff disruptions and visa limits raise input and labor costs. Federal tax 21% and CHIPS ~52B affect cash for automation and M&A.
| Metric | Value |
|---|---|
| Retailer concentration | ~60% |
| Prestige FY2024 sales | ~1.1B USD |
| US mfg employment (BLS 2024) | 12.5M |
| CHIPS funding | ~52B USD |
| Federal tax rate | 21% |
What is included in the product
Detailed Word Document
Explores how macro-environmental forces uniquely affect Prestige Consumer Healthcare across Political, Economic, Social, Technological, Environmental, and Legal dimensions, with data-driven trends and sector-specific examples. Designed for executives and investors, it highlights actionable risks, opportunities, and forward-looking insights to support strategy and funding decisions.
Customizable Excel Spreadsheet
A concise, visually segmented PESTLE summary of Prestige Consumer Healthcare that relieves pain by highlighting external risks, regulatory and market drivers for quick insertion into presentations or team planning; editable notes enable region- or product-specific context.
Economic factors
Consumer confidence and trading down
Macro slowdowns and a 2024 Conference Board consumer confidence average near 102.7 pushed shoppers toward value packs and private label (private-label share ~18.6% in 2024), pressuring branded OTCs. Branded OTCs must defend price-premium with efficacy claims and trusted heritage to justify MSRP. Managing promotional depth and elasticity is critical to protect margins, while 2025 recovery cycles permit premiumization and mix improvement.
Inflation and input costs
API, excipient and packaging inflation have compressed Prestige Consumer Healthcare margins amid 3.4% US CPI in 2024; category pricing power varies with differentiation and retailer shelf dynamics. Hedging and multi-sourcing strategies blunt input volatility, while ongoing efficiency programs have helped sustain margin resilience during recent cost spikes.
FX exposure (USD/AUD)
Revenue and cost mismatches between USD and AUD materially influence Prestige Consumer Healthcare reported results as USD/AUD moved roughly 7% year-over-year to about 1.60 by mid-2025, creating translation and transactional margin pressure. Currency swings compressed gross margins in Q2 2025 while natural hedges from offshore sourcing and financial hedging programs (forward contracts) reduced volatility. A geographically diversified portfolio mix, with key markets outside the US, helps buffer adverse moves.
Retailer consolidation and terms
Retailer consolidation gives large chains and e-commerce platforms outsized leverage over slotting, MDF and returns policies, squeezing net pricing and pressuring working capital; the top 4 US retailers still account for roughly 40% of grocery sales, concentrating buyer power. Omnichannel growth (online share near 15% for CPG in 2024) rewards reliable fill rates and high-quality digital content while return/MDF demands raise cost of trade. Diversifying channels reduces concentration risk and stabilizes margins.
- Slotting/MDF pressure: higher trade spend burden
- Net pricing: margin compression from tougher terms
- Omnichannel payoff: reliability + digital content = share gains
- Mitigation: diversify channels to lower concentration risk
Interest rates and M&A capacity
US policy rates at 5.25–5.50% (July 2025) raise debt service and compress M&A appetite, pushing acquirers to higher hurdle rates for brand deals and product launches. Deleveraging at target firms expands optionality during tightening, while effective synergy capture is pivotal to justify premiums and create post‑deal value.
- Fed funds 5.25–5.50% (Jul 2025)
- Higher cost of capital → higher hurdle rates
- Lower leverage → more M&A flexibility
- Synergies essential to unlock deal value
Regulation, tariffs and labor squeeze launches; retailer power ~60%, tax 21%
Consumer confidence averaged 102.7 in 2024, driving value pack/private‑label share (~18.6%) and pressuring branded OTCs; US CPI 3.4% in 2024 and input inflation compressed margins. Fed funds 5.25–5.50% (Jul 2025) raises cost of capital and slows M&A; USD/AUD ≈1.60 mid‑2025 added translation pressure while top‑4 retailers ~40% share and online CPG ~15% reshape trade dynamics.
| Metric | Value | Impact |
|---|---|---|
| Consumer confidence (2024) | 102.7 | Shift to value |
| Private‑label share (2024) | 18.6% | Branded pressure |
| US CPI (2024) | 3.4% | Input cost |
| Fed funds (Jul 2025) | 5.25–5.50% | Higher hurdle rates |
| USD/AUD (mid‑2025) | ≈1.60 | Translation drag |
| Top‑4 retailers | ≈40% | Buyer leverage |
| Online CPG share (2024) | ≈15% | Omnichannel importance |
What You See Is What You Get
Prestige Consumer Healthcare PESTLE Analysis
The preview shown is the exact Prestige Consumer Healthcare PESTLE Analysis you’ll receive after purchase, fully formatted and ready to use. It contains the complete political, economic, social, technological, legal, and environmental assessment. No placeholders or teasers—this is the final, downloadable file. You’ll get this identical document immediately after checkout.











