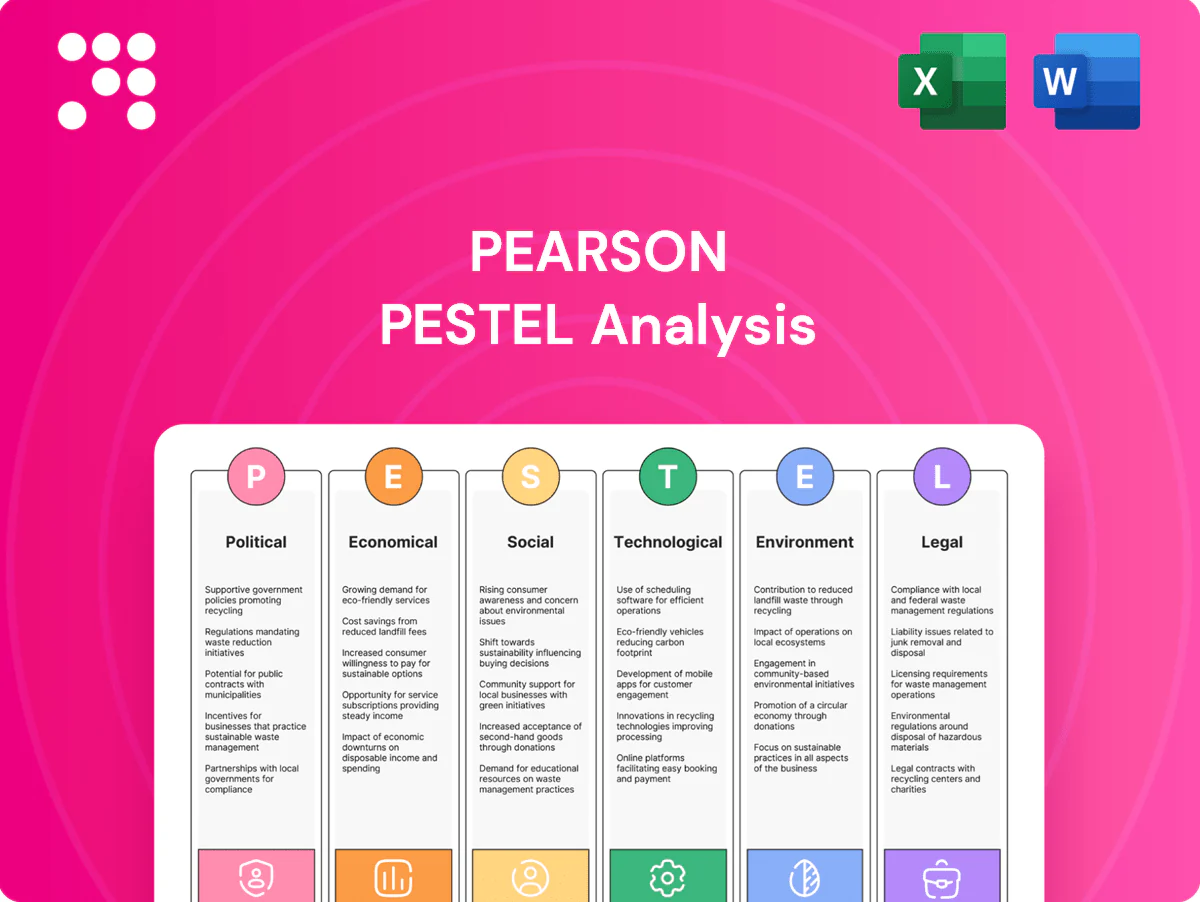
Pearson PESTLE Analysis

Your Shortcut to Market Insight Starts Here
Unlock strategic clarity with our Pearson PESTLE Analysis—concise, research-backed insights into political, economic, social, technological, legal, and environmental forces shaping the company. Ideal for investors and strategists; buy the full report to access actionable, editable findings instantly.
Political factors

Public education funding
Government budgets for K-12 (~US$830B public K-12 expenditure in the US, 2021–22) and higher education, plus stimulus pools like the ~US$190B ESSER COVID relief, directly shape demand for textbooks, assessments and digital licenses; fiscal tightening can delay adoptions while targeted grants accelerate platform uptake. Pearson must align pricing and ROI with shifting public spending (OECD average education spend ~4.7% of GDP) as elections and policy cycles create procurement volatility.
Curriculum and standards policy
National and state curricula, exam frameworks and competency standards determine product alignment and formal approval for market use, so Pearson must map content to these specifications. Curriculum review cycles are typically 3–5 years and regulatory lead times commonly range 6–24 months, requiring rapid content updates and localization to stay adopted in core markets. Pearson’s product roadmap therefore depends on these formal review windows, and early engagement with policymakers measurably reduces disruption risk.

Testing and accountability regimes
Standardized testing policies drive assessment volumes and service scope, directly affecting demand for Pearson’s assessment offerings and test delivery infrastructure.
Moves toward formative assessment and test-optional admissions are material: over 1,900 US colleges were test-optional by 2024, shifting revenue mix away from high-stakes exams.
Public scrutiny of high-stakes exams increases pressure for transparency and robustness, and Pearson must expand alternative credentials and continuous-assessment solutions such as Pearson Digital Credentials and adaptive assessment platforms.

Geopolitics and market access
- International students ~5.9M (UNESCO 2023)
- Pearson presence c.70 markets
- Localization mandates driving in-country hosting/partnerships
- Emerging market reforms boosting vocational demand
Public–private partnerships
Governments increasingly outsource digital learning and testing to private vendors, with large PPP contracts commonly exceeding £50m; procurement favors compliant, scalable providers with strong track records. Pearson competes on cost, reliability and equity outcomes and reported group revenue of £3.6bn in 2024, underpinning bid credibility. Transparent outcome measurement (standardized metrics, third‑party audits) strengthens PPP credibility and tender success.
- Procurement: compliance, scalability, track record
- Competition: cost, reliability, equity
- Pearson 2024: £3.6bn revenue
- PPP trust: transparent outcome metrics
Public budgets, stimulus and test-optional shifts fuel digital, localized assessment demand
Public budgets and stimulus (US K-12 ~$830B 2021–22; ESSER ~$190B) and OECD avg education spend ~4.7% GDP drive demand and procurement timing. Curriculum/exam cycles (3–5 years) and test-optional shifts (1,900+ US colleges by 2024) reallocate revenue to digital/continuous assessment. Trade, localization rules and 5.9M international students (UNESCO 2023) force local hosting and partnerships.
| Metric | Value |
|---|---|
| US public K-12 spend (2021–22) | $830B |
| ESSER COVID relief | $190B |
| Pearson revenue (2024) | £3.6B |
| International students (2023) | 5.9M |
What is included in the product
 Detailed Word Document
Explores how external macro-environmental factors uniquely affect Pearson across six dimensions—Political, Economic, Social, Technological, Environmental and Legal—backed by current data and trends to reflect real market and regulatory dynamics. Designed for executives, consultants and entrepreneurs, it’s forward-looking, report-ready and structured to reveal threats, opportunities and scenarios that support strategy, funding and decision-making.

 Customizable Excel Spreadsheet
Pearson PESTLE Analysis condenses complex external factors into a clean, visually segmented summary for quick interpretation and presentation, and allows easy customization and note-taking to align teams and streamline strategic planning.
Economic factors

Education spend across cycles
Recessions pressure institutional budgets, delaying adoptions and renewals and contributing to cyclical volatility even as Pearson reported FY2024 revenue of about £3.9bn. Counter‑cyclically, demand for upskilling/reskilling rose in 2023–24, supporting corporate and adult learning segments. Pearson’s diversified customer base across K‑12, higher education and professional markets buffers volatility, while pricing flexibility and modular digital offerings (digital mix ~60%) improve resilience.
Currency and international exposure
Multi-currency revenues and costs expose Pearson to FX risk; a stronger dollar in 2024 compressed reported sterling results and pressured price competitiveness in non-dollar markets. Robust hedging policies and a diversified geographic mix have been central to margin stability, while localized pricing strategies help sustain demand across regions.

Inflation and cost structure
Rising inflation—global consumer price inflation easing to roughly 3% in 2024 per OECD—pushes up content creation, cloud services and talent costs, while print input prices (paper, ink, freight) keep remaining physical margins under pressure. Efficiency from digital delivery and scalable platforms mitigates unit costs, and Pearson must use value-based pricing tied to measurable learning outcomes and retention to protect margins.

Subscription and recurring revenue
Shift from one-off textbook sales to subscriptions smooths Pearson's cash flow and drove FY2024 revenue to around £4.1bn with digital revenues ~70%; institutional licenses and SaaS models improve visibility, while churn management and engagement analytics are critical to sustain ARR and margins; bundling assessments, content and services lifts ARPU.
- Subscription smoothing: FY2024 ~£4.1bn revenue, digital ~70%
- Visibility: rise in institutional licenses/SaaS reduces revenue volatility
- Focus: churn reduction + engagement analytics to protect ARR; bundling raises ARPU
Emerging markets growth
Emerging-market middle classes expand demand for English, vocational and digital learning, with an estimated 1.5 billion English learners globally and rising tertiary enrollment in EMs. Price sensitivity forces tiered, mobile-first offerings; mobile internet reached about 5.3 billion users in 2024 and mobile-money accounts surpassed 1.2 billion, making payment and distribution partnerships critical. Localized, credentialed programs boost employability and adoption across markets.
- Demand: 1.5 billion English learners
- Access: ~5.3 billion mobile users (2024)
- Payments: >1.2 billion mobile-money accounts (2024)
- Strategy: tiered pricing, mobile-first, localized credentials
Public budgets, stimulus and test-optional shifts fuel digital, localized assessment demand
Recessions squeeze institutional budgets yet upskilling demand lifted corporate/adult learning, contributing to FY2024 revenue ~£4.1bn with digital mix ~70%. FX (strong dollar) and inflation (~3% OECD 2024) pressured sterling results and input costs; hedging and localized pricing mitigate impact. Subscription/SaaS shifts smooth cash flow but require churn control and engagement analytics to protect ARR.
| Metric | Value (2024) |
|---|---|
| Revenue | ~£4.1bn |
| Digital mix | ~70% |
| Global CPI | ~3% |
| English learners | 1.5bn |
Full Version Awaits
Pearson PESTLE Analysis
The preview shown here is the exact Pearson PESTLE Analysis document you’ll receive after purchase—fully formatted, professionally structured, and ready to use. No placeholders or teasers: the content, layout, and structure visible here are the final file you’ll download instantly after payment.

Original: $10.00
-65%$10.00
$3.50Product Information
Product Information
Shipping & Returns
Shipping & Returns
Description
Your Shortcut to Market Insight Starts Here
Unlock strategic clarity with our Pearson PESTLE Analysis—concise, research-backed insights into political, economic, social, technological, legal, and environmental forces shaping the company. Ideal for investors and strategists; buy the full report to access actionable, editable findings instantly.
Political factors
Public education funding
Government budgets for K-12 (~US$830B public K-12 expenditure in the US, 2021–22) and higher education, plus stimulus pools like the ~US$190B ESSER COVID relief, directly shape demand for textbooks, assessments and digital licenses; fiscal tightening can delay adoptions while targeted grants accelerate platform uptake. Pearson must align pricing and ROI with shifting public spending (OECD average education spend ~4.7% of GDP) as elections and policy cycles create procurement volatility.
Curriculum and standards policy
National and state curricula, exam frameworks and competency standards determine product alignment and formal approval for market use, so Pearson must map content to these specifications. Curriculum review cycles are typically 3–5 years and regulatory lead times commonly range 6–24 months, requiring rapid content updates and localization to stay adopted in core markets. Pearson’s product roadmap therefore depends on these formal review windows, and early engagement with policymakers measurably reduces disruption risk.
Testing and accountability regimes
Standardized testing policies drive assessment volumes and service scope, directly affecting demand for Pearson’s assessment offerings and test delivery infrastructure.
Moves toward formative assessment and test-optional admissions are material: over 1,900 US colleges were test-optional by 2024, shifting revenue mix away from high-stakes exams.
Public scrutiny of high-stakes exams increases pressure for transparency and robustness, and Pearson must expand alternative credentials and continuous-assessment solutions such as Pearson Digital Credentials and adaptive assessment platforms.
Geopolitics and market access
- International students ~5.9M (UNESCO 2023)
- Pearson presence c.70 markets
- Localization mandates driving in-country hosting/partnerships
- Emerging market reforms boosting vocational demand
Public–private partnerships
Governments increasingly outsource digital learning and testing to private vendors, with large PPP contracts commonly exceeding £50m; procurement favors compliant, scalable providers with strong track records. Pearson competes on cost, reliability and equity outcomes and reported group revenue of £3.6bn in 2024, underpinning bid credibility. Transparent outcome measurement (standardized metrics, third‑party audits) strengthens PPP credibility and tender success.
- Procurement: compliance, scalability, track record
- Competition: cost, reliability, equity
- Pearson 2024: £3.6bn revenue
- PPP trust: transparent outcome metrics
Public budgets, stimulus and test-optional shifts fuel digital, localized assessment demand
Public budgets and stimulus (US K-12 ~$830B 2021–22; ESSER ~$190B) and OECD avg education spend ~4.7% GDP drive demand and procurement timing. Curriculum/exam cycles (3–5 years) and test-optional shifts (1,900+ US colleges by 2024) reallocate revenue to digital/continuous assessment. Trade, localization rules and 5.9M international students (UNESCO 2023) force local hosting and partnerships.
| Metric | Value |
|---|---|
| US public K-12 spend (2021–22) | $830B |
| ESSER COVID relief | $190B |
| Pearson revenue (2024) | £3.6B |
| International students (2023) | 5.9M |
What is included in the product
Detailed Word Document
Explores how external macro-environmental factors uniquely affect Pearson across six dimensions—Political, Economic, Social, Technological, Environmental and Legal—backed by current data and trends to reflect real market and regulatory dynamics. Designed for executives, consultants and entrepreneurs, it’s forward-looking, report-ready and structured to reveal threats, opportunities and scenarios that support strategy, funding and decision-making.
Customizable Excel Spreadsheet
Pearson PESTLE Analysis condenses complex external factors into a clean, visually segmented summary for quick interpretation and presentation, and allows easy customization and note-taking to align teams and streamline strategic planning.
Economic factors
Education spend across cycles
Recessions pressure institutional budgets, delaying adoptions and renewals and contributing to cyclical volatility even as Pearson reported FY2024 revenue of about £3.9bn. Counter‑cyclically, demand for upskilling/reskilling rose in 2023–24, supporting corporate and adult learning segments. Pearson’s diversified customer base across K‑12, higher education and professional markets buffers volatility, while pricing flexibility and modular digital offerings (digital mix ~60%) improve resilience.
Currency and international exposure
Multi-currency revenues and costs expose Pearson to FX risk; a stronger dollar in 2024 compressed reported sterling results and pressured price competitiveness in non-dollar markets. Robust hedging policies and a diversified geographic mix have been central to margin stability, while localized pricing strategies help sustain demand across regions.
Inflation and cost structure
Rising inflation—global consumer price inflation easing to roughly 3% in 2024 per OECD—pushes up content creation, cloud services and talent costs, while print input prices (paper, ink, freight) keep remaining physical margins under pressure. Efficiency from digital delivery and scalable platforms mitigates unit costs, and Pearson must use value-based pricing tied to measurable learning outcomes and retention to protect margins.
Subscription and recurring revenue
Shift from one-off textbook sales to subscriptions smooths Pearson's cash flow and drove FY2024 revenue to around £4.1bn with digital revenues ~70%; institutional licenses and SaaS models improve visibility, while churn management and engagement analytics are critical to sustain ARR and margins; bundling assessments, content and services lifts ARPU.
- Subscription smoothing: FY2024 ~£4.1bn revenue, digital ~70%
- Visibility: rise in institutional licenses/SaaS reduces revenue volatility
- Focus: churn reduction + engagement analytics to protect ARR; bundling raises ARPU
Emerging markets growth
Emerging-market middle classes expand demand for English, vocational and digital learning, with an estimated 1.5 billion English learners globally and rising tertiary enrollment in EMs. Price sensitivity forces tiered, mobile-first offerings; mobile internet reached about 5.3 billion users in 2024 and mobile-money accounts surpassed 1.2 billion, making payment and distribution partnerships critical. Localized, credentialed programs boost employability and adoption across markets.
- Demand: 1.5 billion English learners
- Access: ~5.3 billion mobile users (2024)
- Payments: >1.2 billion mobile-money accounts (2024)
- Strategy: tiered pricing, mobile-first, localized credentials
Public budgets, stimulus and test-optional shifts fuel digital, localized assessment demand
Recessions squeeze institutional budgets yet upskilling demand lifted corporate/adult learning, contributing to FY2024 revenue ~£4.1bn with digital mix ~70%. FX (strong dollar) and inflation (~3% OECD 2024) pressured sterling results and input costs; hedging and localized pricing mitigate impact. Subscription/SaaS shifts smooth cash flow but require churn control and engagement analytics to protect ARR.
| Metric | Value (2024) |
|---|---|
| Revenue | ~£4.1bn |
| Digital mix | ~70% |
| Global CPI | ~3% |
| English learners | 1.5bn |
Full Version Awaits
Pearson PESTLE Analysis
The preview shown here is the exact Pearson PESTLE Analysis document you’ll receive after purchase—fully formatted, professionally structured, and ready to use. No placeholders or teasers: the content, layout, and structure visible here are the final file you’ll download instantly after payment.











