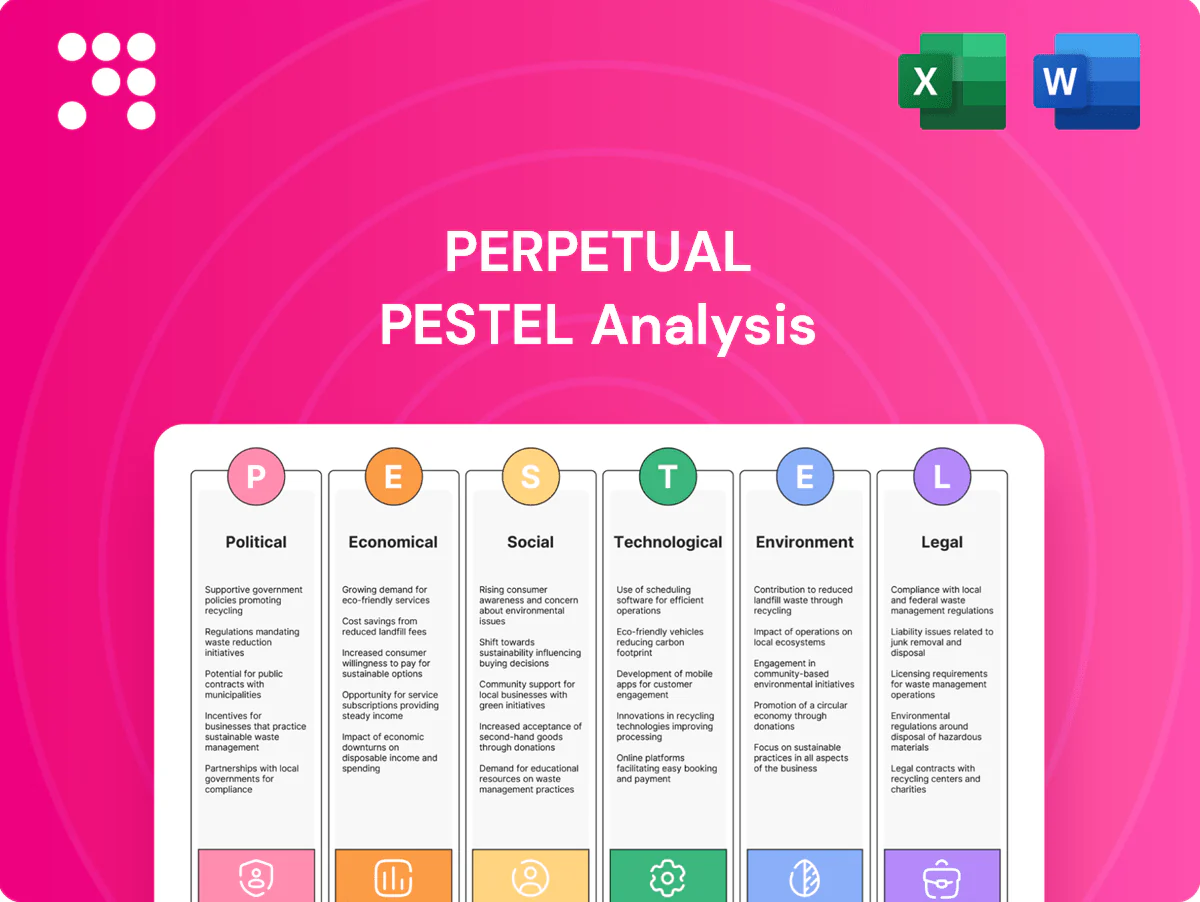
Perpetual PESTLE Analysis

Your Shortcut to Market Insight Starts Here
Discover how political shifts, economic trends, social dynamics, and regulatory changes are shaping Perpetual’s strategic outlook in our concise PESTLE snapshot—designed to inform investors and strategists. Dive deeper with the full, professionally researched PESTLE to unlock actionable risks and opportunities. Purchase now for instant access and ready-to-use insights.
Political factors

Regulatory posture and oversight
Perpetual’s businesses are highly sensitive to policy direction from Australian regulators and Treasury; with Australia’s superannuation pool near A$4.5 trillion (2024), regulatory shifts can materially alter flows. Changes in prudential or conduct priorities raise compliance costs and can constrain product design and margins. A stable, predictable regulatory agenda supports long-term planning and investment, while sudden inquiries or reforms create near-term volatility in flows and returns.
Superannuation and retirement policy
Changes to concessional contribution caps (currently A$27,500) and 15% super tax settings directly shift flows into an industry holding about A$3.8 trillion (APRA June 2024), while default MySuper rules steer large retail inflows. Policy support for retirement income products can expand addressable markets and advisor demand; tightening tax concessions or caps would likely reduce wealth accumulation and advisory revenue. Ongoing government reviews require agile product design and trust structures to capture shifting mandates and preserve net inflows.

Foreign investment and geopolitical settings
Rules limiting foreign investor participation and capital mobility shape custody, trust and asset management demand, as global foreign direct investment fell to about $1.2 trillion in 2023 (UNCTAD), concentrating opportunities in compliant jurisdictions. Geopolitical tensions—evident in shifting US-China trade measures—alter market sentiment and cross-border mandates, affecting allocation and hedging needs. Policy pushes for regional financial integration could open distribution channels while heightened regulatory scrutiny since 2022 has raised compliance focus amid global AUM exceeding $120 trillion in 2024 (BCG/EFAMA).

Government fiscal and infrastructure agendas
Public spending and long‑run infrastructure pipelines materially drive securitisation and trust administration volumes; Global Infrastructure Hub estimates US$94 trillion of infrastructure need to 2040, and Australia’s 2024–25 Budget earmarked about AUD 120 billion for transport/infrastructure over the forward decade. Stable project pipelines boost debt trustee and corporate trust activity, while fiscal consolidation can reduce new issuance; housing and SME finance incentives reshape underlying collateral pools.
- Public spending: US$94tn global need to 2040
- Australia 2024–25: ~AUD 120bn infrastructure forward funding
- Stable pipelines: higher trustee/corporate trust volumes
- Fiscal consolidation: fewer new issuance opportunities
- Policy incentives: shift collateral toward housing/SME loans
Political stability and policy continuity
Australia’s stable governance underpins investor confidence and long-term contracting, with the next federal election due by May 2025; 10-year government bond yields around 4% supporting predictable financing costs. Election cycles still create uncertainty on tax, ESG and finance reform, while policy continuity enables planning for fund launches and platform upgrades; abrupt reversals can disrupt distribution and investment strategies.
- Election timeline: federal poll by May 2025
- 10y gov yield: ~4% (2024–25)
- Continuity aids product launches/platform upgrades
- Policy reversals risk distribution and strategy
Regulatory, election risk to A$4.5tn super pool threatens flows, fees and product timing
Perpetual faces high policy sensitivity as Australia’s A$4.5tn super pool (2024) means regulatory shifts materially alter flows and margins. Changes to concessional cap (A$27,500) or tax settings can reduce accumulation and adviser revenues; prudential or conduct rulings raise compliance costs. Election by May 2025 and 10y bond ~4% add timing and funding uncertainty for product launches and infrastructure mandates.
| Metric | Value / Date |
|---|---|
| Superannuation pool | A$4.5tn (2024) |
| Concessional cap | A$27,500 (2024) |
| Federal election | By May 2025 |
What is included in the product
 Detailed Word Document
Explores how external macro-environmental factors uniquely affect the Perpetual across six dimensions—Political, Economic, Social, Technological, Environmental, and Legal—backed by relevant data and current trends. Designed for executives, consultants, and entrepreneurs, it highlights threats and opportunities with forward-looking insights ready for business plans, pitch decks, or scenario planning.

 Customizable Excel Spreadsheet
A concise, continuously updated Perpetual PESTLE summary that highlights shifting external risks and opportunities, visually segmented for rapid interpretation and easily dropped into presentations or shared across teams to streamline strategic planning.
Economic factors

Interest rate and inflation dynamics
RBA policy (cash rate 4.10% in June 2025) materially shifts portfolio returns, client risk appetite and securitisation spreads; higher rates boost trust revenue from cash but compress valuations and reduce equity inflows. Inflation at 3.5% y/y increases operating costs and erodes client real returns, while rate cycles drive credit performance and default risk in underlying asset pools.
Market performance and AUM sensitivity
Equity and credit moves directly shift fee-bearing AUM; global asset management AUM exceeded $120 trillion in 2024, amplifying revenue sensitivity to market swings. Bull markets (eg MSCI World ~15% in 2024) drove positive net flows and higher performance fees, while drawdowns compress management fees and fee-related revenue. Diversified multi-strategy lineups have reduced AUM volatility for many firms. Prolonged volatility raises client switching and liquidity needs, increasing redemption risk.

Credit cycle and housing conditions
Household leverage in advanced economies averaged roughly 80% of GDP in 2024 (IMF), while mortgage arrears remained low but rising—US mortgage delinquencies ticked toward 1.5% in early 2025—shaping securitisation issuance and trust risk by pressuring collateral quality.
Strong housing markets, with global house prices up ~5% in 2024 (OECD), supported investor demand and tighter spreads on RMBS; downturns raise default risk, widen spreads and increase trustee workloads.
SME and consumer credit cycles mirror this: consumer credit growth slowed to ~6% YoY in 2024, constraining ABS deal flow and elevating credit scrutiny.

FX and global capital flows
Movements in the AUD materially alter offshore returns and mandate attractiveness; the AUD depreciated roughly 6% vs USD in 2024, shifting realized returns for unhedged foreign investors. Global liquidity cycles drive institutional allocations to Australian assets—foreign ownership of ASX-listed equities was about 40% in 2024—while currency hedging needs add operational complexity and costs, and diversified currency exposure can blunt domestic shocks.
- FX moves: AUD -6% vs USD (2024)
- Allocations: ASX foreign ownership ~40% (2024)
- Costs: hedging raises implementation and basis risk
- Mitigation: multi-currency exposure reduces local shock risk
Employment, wages, and savings rates
Employment stability drives regular contributions and advice uptake; US unemployment averaged about 3.7% in 2024 and sustained payrolls supported steady inflows. Wage growth and a roughly 4% US personal saving rate in 2024 shaped retail inflows, while slowdowns raise redemptions and fee compression. HNW activity parallels business confidence and liquidity events; global M&A value in 2024 was ~2.3 trillion USD.
- Employment stability: 3.7% US unemployment (2024)
- Savings: ~4% US personal saving rate (2024)
- Retail flows: tied to wage growth
- HNW: tracks confidence and 2024 M&A ≈ $2.3T
Regulatory, election risk to A$4.5tn super pool threatens flows, fees and product timing
Higher RBA cash rate 4.10% (Jun 2025) and 3.5% y/y inflation compress valuations, lift cash revenues and raise credit/default risk; global AUM >$120T (2024) and MSCI World ~15% (2024) amplify fee sensitivity and flows. Household leverage ~80% GDP (2024) and US mortgage delinquencies ~1.5% (early 2025) pressure securitisation collateral; AUD -6% vs USD (2024) shifts offshore returns.
| Metric | Value |
|---|---|
| RBA cash rate | 4.10% (Jun 2025) |
| Inflation | 3.5% y/y |
| Global AUM | >$120T (2024) |
| AUD vs USD | -6% (2024) |
| US unemployment | 3.7% (2024) |
Same Document Delivered
Perpetual PESTLE Analysis
The preview shown here is the exact Perpetual PESTLE Analysis you’ll receive after purchase — fully formatted, professionally structured, and ready to use. This screenshot reflects the final content and layout with no placeholders or hidden sections. After checkout you’ll instantly download the identical document, complete and deliverable for immediate application.

Product Information
Product Information
Shipping & Returns
Shipping & Returns
Description
Your Shortcut to Market Insight Starts Here
Discover how political shifts, economic trends, social dynamics, and regulatory changes are shaping Perpetual’s strategic outlook in our concise PESTLE snapshot—designed to inform investors and strategists. Dive deeper with the full, professionally researched PESTLE to unlock actionable risks and opportunities. Purchase now for instant access and ready-to-use insights.
Political factors
Regulatory posture and oversight
Perpetual’s businesses are highly sensitive to policy direction from Australian regulators and Treasury; with Australia’s superannuation pool near A$4.5 trillion (2024), regulatory shifts can materially alter flows. Changes in prudential or conduct priorities raise compliance costs and can constrain product design and margins. A stable, predictable regulatory agenda supports long-term planning and investment, while sudden inquiries or reforms create near-term volatility in flows and returns.
Superannuation and retirement policy
Changes to concessional contribution caps (currently A$27,500) and 15% super tax settings directly shift flows into an industry holding about A$3.8 trillion (APRA June 2024), while default MySuper rules steer large retail inflows. Policy support for retirement income products can expand addressable markets and advisor demand; tightening tax concessions or caps would likely reduce wealth accumulation and advisory revenue. Ongoing government reviews require agile product design and trust structures to capture shifting mandates and preserve net inflows.
Foreign investment and geopolitical settings
Rules limiting foreign investor participation and capital mobility shape custody, trust and asset management demand, as global foreign direct investment fell to about $1.2 trillion in 2023 (UNCTAD), concentrating opportunities in compliant jurisdictions. Geopolitical tensions—evident in shifting US-China trade measures—alter market sentiment and cross-border mandates, affecting allocation and hedging needs. Policy pushes for regional financial integration could open distribution channels while heightened regulatory scrutiny since 2022 has raised compliance focus amid global AUM exceeding $120 trillion in 2024 (BCG/EFAMA).
Government fiscal and infrastructure agendas
Public spending and long‑run infrastructure pipelines materially drive securitisation and trust administration volumes; Global Infrastructure Hub estimates US$94 trillion of infrastructure need to 2040, and Australia’s 2024–25 Budget earmarked about AUD 120 billion for transport/infrastructure over the forward decade. Stable project pipelines boost debt trustee and corporate trust activity, while fiscal consolidation can reduce new issuance; housing and SME finance incentives reshape underlying collateral pools.
- Public spending: US$94tn global need to 2040
- Australia 2024–25: ~AUD 120bn infrastructure forward funding
- Stable pipelines: higher trustee/corporate trust volumes
- Fiscal consolidation: fewer new issuance opportunities
- Policy incentives: shift collateral toward housing/SME loans
Political stability and policy continuity
Australia’s stable governance underpins investor confidence and long-term contracting, with the next federal election due by May 2025; 10-year government bond yields around 4% supporting predictable financing costs. Election cycles still create uncertainty on tax, ESG and finance reform, while policy continuity enables planning for fund launches and platform upgrades; abrupt reversals can disrupt distribution and investment strategies.
- Election timeline: federal poll by May 2025
- 10y gov yield: ~4% (2024–25)
- Continuity aids product launches/platform upgrades
- Policy reversals risk distribution and strategy
Regulatory, election risk to A$4.5tn super pool threatens flows, fees and product timing
Perpetual faces high policy sensitivity as Australia’s A$4.5tn super pool (2024) means regulatory shifts materially alter flows and margins. Changes to concessional cap (A$27,500) or tax settings can reduce accumulation and adviser revenues; prudential or conduct rulings raise compliance costs. Election by May 2025 and 10y bond ~4% add timing and funding uncertainty for product launches and infrastructure mandates.
| Metric | Value / Date |
|---|---|
| Superannuation pool | A$4.5tn (2024) |
| Concessional cap | A$27,500 (2024) |
| Federal election | By May 2025 |
What is included in the product
Detailed Word Document
Explores how external macro-environmental factors uniquely affect the Perpetual across six dimensions—Political, Economic, Social, Technological, Environmental, and Legal—backed by relevant data and current trends. Designed for executives, consultants, and entrepreneurs, it highlights threats and opportunities with forward-looking insights ready for business plans, pitch decks, or scenario planning.
Customizable Excel Spreadsheet
A concise, continuously updated Perpetual PESTLE summary that highlights shifting external risks and opportunities, visually segmented for rapid interpretation and easily dropped into presentations or shared across teams to streamline strategic planning.
Economic factors
Interest rate and inflation dynamics
RBA policy (cash rate 4.10% in June 2025) materially shifts portfolio returns, client risk appetite and securitisation spreads; higher rates boost trust revenue from cash but compress valuations and reduce equity inflows. Inflation at 3.5% y/y increases operating costs and erodes client real returns, while rate cycles drive credit performance and default risk in underlying asset pools.
Market performance and AUM sensitivity
Equity and credit moves directly shift fee-bearing AUM; global asset management AUM exceeded $120 trillion in 2024, amplifying revenue sensitivity to market swings. Bull markets (eg MSCI World ~15% in 2024) drove positive net flows and higher performance fees, while drawdowns compress management fees and fee-related revenue. Diversified multi-strategy lineups have reduced AUM volatility for many firms. Prolonged volatility raises client switching and liquidity needs, increasing redemption risk.
Credit cycle and housing conditions
Household leverage in advanced economies averaged roughly 80% of GDP in 2024 (IMF), while mortgage arrears remained low but rising—US mortgage delinquencies ticked toward 1.5% in early 2025—shaping securitisation issuance and trust risk by pressuring collateral quality.
Strong housing markets, with global house prices up ~5% in 2024 (OECD), supported investor demand and tighter spreads on RMBS; downturns raise default risk, widen spreads and increase trustee workloads.
SME and consumer credit cycles mirror this: consumer credit growth slowed to ~6% YoY in 2024, constraining ABS deal flow and elevating credit scrutiny.
FX and global capital flows
Movements in the AUD materially alter offshore returns and mandate attractiveness; the AUD depreciated roughly 6% vs USD in 2024, shifting realized returns for unhedged foreign investors. Global liquidity cycles drive institutional allocations to Australian assets—foreign ownership of ASX-listed equities was about 40% in 2024—while currency hedging needs add operational complexity and costs, and diversified currency exposure can blunt domestic shocks.
- FX moves: AUD -6% vs USD (2024)
- Allocations: ASX foreign ownership ~40% (2024)
- Costs: hedging raises implementation and basis risk
- Mitigation: multi-currency exposure reduces local shock risk
Employment, wages, and savings rates
Employment stability drives regular contributions and advice uptake; US unemployment averaged about 3.7% in 2024 and sustained payrolls supported steady inflows. Wage growth and a roughly 4% US personal saving rate in 2024 shaped retail inflows, while slowdowns raise redemptions and fee compression. HNW activity parallels business confidence and liquidity events; global M&A value in 2024 was ~2.3 trillion USD.
- Employment stability: 3.7% US unemployment (2024)
- Savings: ~4% US personal saving rate (2024)
- Retail flows: tied to wage growth
- HNW: tracks confidence and 2024 M&A ≈ $2.3T
Regulatory, election risk to A$4.5tn super pool threatens flows, fees and product timing
Higher RBA cash rate 4.10% (Jun 2025) and 3.5% y/y inflation compress valuations, lift cash revenues and raise credit/default risk; global AUM >$120T (2024) and MSCI World ~15% (2024) amplify fee sensitivity and flows. Household leverage ~80% GDP (2024) and US mortgage delinquencies ~1.5% (early 2025) pressure securitisation collateral; AUD -6% vs USD (2024) shifts offshore returns.
| Metric | Value |
|---|---|
| RBA cash rate | 4.10% (Jun 2025) |
| Inflation | 3.5% y/y |
| Global AUM | >$120T (2024) |
| AUD vs USD | -6% (2024) |
| US unemployment | 3.7% (2024) |
Same Document Delivered
Perpetual PESTLE Analysis
The preview shown here is the exact Perpetual PESTLE Analysis you’ll receive after purchase — fully formatted, professionally structured, and ready to use. This screenshot reflects the final content and layout with no placeholders or hidden sections. After checkout you’ll instantly download the identical document, complete and deliverable for immediate application.











