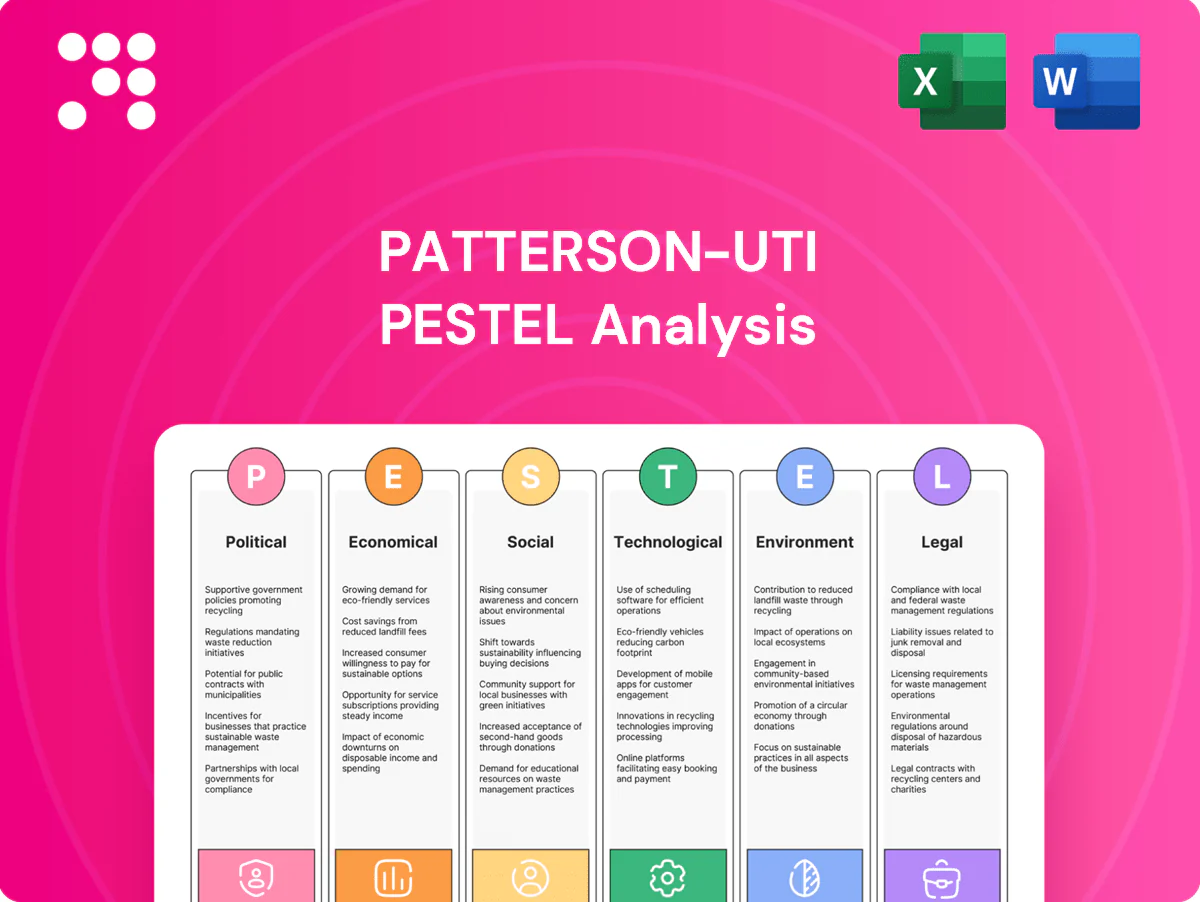
Patterson-UTI PESTLE Analysis

Skip the Research. Get the Strategy.
Gain a competitive edge with our targeted PESTLE Analysis of Patterson-UTI—uncover how political, economic, social, technological, legal and environmental forces will shape its future and your strategy. Ideal for investors and strategists, this ready-to-use report delivers actionable insights. Purchase the full analysis now for the complete, editable breakdown.
Political factors

Shifts in U.S. energy policy
Shifts in U.S. energy policy affect permitting timelines, federal land drilling and emissions standards; U.S. crude oil production averaged about 12.2 million barrels per day in 2024 (EIA), so policy swings materially affect activity. Pro-fossil administrations tend to fast-track approvals and infrastructure, boosting rig demand, while stricter regimes—eg EPA methane rules finalized in 2023—can slow projects through tighter reviews. Patterson-UTI must remain agile as policy changes cascade into E&P spending.
State-level regulation heterogeneity
Key basins—Permian (~6.0 mb/d 2024), Eagle Ford (~0.9 mb/d), Bakken (~1.1 mb/d) and gas-heavy Haynesville (~12 Bcf/d)—span states with divergent fracking, flaring and water rules; Texas remains broadly permissive while Colorado and New Mexico tightened limits and fines since 2021–24. This regulatory patchwork shifts fleet deployment and utilization, with operators favoring Texas for higher uptime and moving rigs when local politics change rapidly.

Public land and leasing decisions
Moratoria or limits on new federal leases and drilling permits directly cut activity on affected acreage, with federal onshore production accounting for roughly 10% of US oil output in recent years. NEPA reviews commonly add months to years to project lead times (EA 6–24 months; EIS often 3–5 years). Patterson-UTI exposure tracks its customers’ acreage mix across federal, state, and private land, and predictability of access drives fleet planning and capex timing.

Infrastructure and pipeline approvals
Federal and state approvals for pipelines and gas takeaway largely govern basin growth velocity; US dry natural gas production averaged about 101 Bcf/d in 2023 per EIA, so regional takeaway limits matter. Bottlenecks (Permian takeaway shortfalls ~1.5 Bcf/d in 2023–24) depressed well completions and pricing, muting service demand, while approved expansions unlock activity. Political resistance raises permitting delays, uncertainty and higher capex; service providers must align rig and fracing capacity with infrastructure timelines.
- Approvals drive basin growth
- Bottlenecks cut completions/pricing
- Permitting delays raise costs
- Align capacity to pipeline timelines
Geopolitical supply shocks
Brent averaged about $86/bbl in 2024, with monthly swings often exceeding 15% around OPEC+ moves, conflicts and sanctions; those swings directly reshape North American E&P budgets. Price spikes typically accelerate rig reactivations while downturns trigger rapid stackings within months. Patterson-UTI, though primarily domestic, transmits geopolitical risk via price volatility, mitigated by hedging and flexible staffing.
- OPEC+/conflicts: ±15% monthly oil swings
- Capex impact: drives E&P budget shifts, faster reactivations
- Operational mitigation: hedging, flexible staffing, rapid fleet mobilization
Policy swings drive US rig demand; Permian concentration, NEPA delays, Brent $86 ±15%
Political shifts alter permitting, federal leasing and emissions rules—US crude 12.2 mb/d (2024) and federal onshore ~10% of output, so policy swings materially change rig demand. State patchwork (Permian 6.0 mb/d; CO/NM tighter) drives fleet moves. NEPA reviews (EA 6–24m; EIS 3–5y) and pipeline bottlenecks (Permian ~1.5 Bcf/d) affect activity; Brent $86/bbl (2024), ±15% swings.
| Factor | Metric | Impact |
|---|---|---|
| Permitting | EA/EIS 6–60m | Delay capex |
| Basins | Permian 6.0 mb/d | Fleet concentration |
| Price | Brent $86; ±15% | Budget volatility |
What is included in the product
 Detailed Word Document
Explores how Political, Economic, Social, Technological, Environmental, and Legal forces uniquely affect Patterson-UTI, combining data-driven trends and region/industry context into forward-looking insights for executives, investors, and strategists—ready for reports and decks.

 Customizable Excel Spreadsheet
A concise, visually segmented Patterson-UTI PESTLE summary that relieves meeting prep pain by highlighting external risks and market positioning for quick inclusion in presentations, easy sharing across teams, and straightforward use in planning sessions.
Economic factors

Commodity price cyclicality
WTI around $80/bbl and Henry Hub near $3/MMBtu in H1 2025 set E&P cash flows and capex, directly driving drilling and frac activity; higher prices lift dayrates and utilization while lower prices compress margins and idle rigs. Patterson-UTI revenue remains tightly correlated with US rig count (≈700 rigs June 2025); contract mix and multi-year terms provide partial cycle buffering.
Customer consolidation and pricing power
Larger, consolidated E&Ps—the top 10 of which account for roughly half of U.S. oil production in 2024—negotiate lower costs and favor high-spec fleets with performance guarantees, squeezing service pricing but improving volume stability and safety standards. Patterson-UTI must defend margins through efficiency and reliability, using fleet uptime metrics and cost-per-well reductions. Strategic partnerships and multi-year MSAs can smooth activity and secure predictable revenue streams.

Inflation and input costs
Pressure‑pumping costs remain volatile as inputs like hot‑rolled steel (~$700/ton in mid‑2024), diesel (~$4/gal average in 2024), frac sand and specialty chemicals drive margins; these inputs can represent double‑digit percent swings in per‑job costs. Wage inflation (annual oilfield wage gains ~4% in 2024) and scarce skilled crews raise payroll and turnover risk. Patterson‑UTI uses index‑linked contracts and fuel surcharges plus long‑term supply agreements and logistics optimization to pass through spikes and protect margins.

Interest rates and capital availability
- Higher rates: ↑ financing costs, ↓ capex
- Lower rates: enable refinancing, fund rig/e‑frac upgrades
- Balance sheet strength: key to counter‑cyclical spending
- Priority: cash discipline and ROIC
Regional activity mix
Basin-specific economics — Permian breakevens ~$30–40/bbl and Midland–Gulf differentials up to ~$8–10/bbl — drive rig and frac-spread deployment; gas-weighted basins swing with US LNG export capacity ~13.5 Bcf/d (2024) and seasonal demand. Patterson-UTI’s rapid redeployment (days) reduces downtime, while proximity to high-ROIC wells sustains utilization and pricing.
- Basin breakevens: Permian ~$30–40/bbl
- Price differentials: up to $8–10/bbl
- US LNG capacity: ~13.5 Bcf/d (2024)
- Redeploy time: days; supports utilization
Policy swings drive US rig demand; Permian concentration, NEPA delays, Brent $86 ±15%
WTI ~$80/bbl and Henry Hub ~$3/MMBtu in H1 2025 drive E&P cash flows and US rig count (~700 June 2025), directly linking Patterson-UTI revenue to activity; higher prices raise dayrates and utilization, lower prices idle rigs. Higher rates (Fed funds ~5.25–5.50% mid‑2025) raise financing costs, favor firms with strong balance sheets and cash discipline.
| Metric | Value |
|---|---|
| WTI H1 2025 | ~$80/bbl |
| Henry Hub | ~$3/MMBtu |
| US rig count (Jun 2025) | ~700 |
| Fed funds (mid‑2025) | 5.25–5.50% |
| Permian breakeven | $30–40/bbl |
Preview the Actual Deliverable
Patterson-UTI PESTLE Analysis
This Patterson-UTI PESTLE Analysis preview is the exact, fully formatted document you’ll receive after purchase, with no placeholders or teasers. The content, structure, and layout shown here are the final version ready to download and use immediately. What you see is the real product—professionally organized and complete for strategic review and decision-making.

Original: $10.00
-65%$10.00
$3.50Product Information
Product Information
Shipping & Returns
Shipping & Returns
Description
Skip the Research. Get the Strategy.
Gain a competitive edge with our targeted PESTLE Analysis of Patterson-UTI—uncover how political, economic, social, technological, legal and environmental forces will shape its future and your strategy. Ideal for investors and strategists, this ready-to-use report delivers actionable insights. Purchase the full analysis now for the complete, editable breakdown.
Political factors
Shifts in U.S. energy policy
Shifts in U.S. energy policy affect permitting timelines, federal land drilling and emissions standards; U.S. crude oil production averaged about 12.2 million barrels per day in 2024 (EIA), so policy swings materially affect activity. Pro-fossil administrations tend to fast-track approvals and infrastructure, boosting rig demand, while stricter regimes—eg EPA methane rules finalized in 2023—can slow projects through tighter reviews. Patterson-UTI must remain agile as policy changes cascade into E&P spending.
State-level regulation heterogeneity
Key basins—Permian (~6.0 mb/d 2024), Eagle Ford (~0.9 mb/d), Bakken (~1.1 mb/d) and gas-heavy Haynesville (~12 Bcf/d)—span states with divergent fracking, flaring and water rules; Texas remains broadly permissive while Colorado and New Mexico tightened limits and fines since 2021–24. This regulatory patchwork shifts fleet deployment and utilization, with operators favoring Texas for higher uptime and moving rigs when local politics change rapidly.
Public land and leasing decisions
Moratoria or limits on new federal leases and drilling permits directly cut activity on affected acreage, with federal onshore production accounting for roughly 10% of US oil output in recent years. NEPA reviews commonly add months to years to project lead times (EA 6–24 months; EIS often 3–5 years). Patterson-UTI exposure tracks its customers’ acreage mix across federal, state, and private land, and predictability of access drives fleet planning and capex timing.
Infrastructure and pipeline approvals
Federal and state approvals for pipelines and gas takeaway largely govern basin growth velocity; US dry natural gas production averaged about 101 Bcf/d in 2023 per EIA, so regional takeaway limits matter. Bottlenecks (Permian takeaway shortfalls ~1.5 Bcf/d in 2023–24) depressed well completions and pricing, muting service demand, while approved expansions unlock activity. Political resistance raises permitting delays, uncertainty and higher capex; service providers must align rig and fracing capacity with infrastructure timelines.
- Approvals drive basin growth
- Bottlenecks cut completions/pricing
- Permitting delays raise costs
- Align capacity to pipeline timelines
Geopolitical supply shocks
Brent averaged about $86/bbl in 2024, with monthly swings often exceeding 15% around OPEC+ moves, conflicts and sanctions; those swings directly reshape North American E&P budgets. Price spikes typically accelerate rig reactivations while downturns trigger rapid stackings within months. Patterson-UTI, though primarily domestic, transmits geopolitical risk via price volatility, mitigated by hedging and flexible staffing.
- OPEC+/conflicts: ±15% monthly oil swings
- Capex impact: drives E&P budget shifts, faster reactivations
- Operational mitigation: hedging, flexible staffing, rapid fleet mobilization
Policy swings drive US rig demand; Permian concentration, NEPA delays, Brent $86 ±15%
Political shifts alter permitting, federal leasing and emissions rules—US crude 12.2 mb/d (2024) and federal onshore ~10% of output, so policy swings materially change rig demand. State patchwork (Permian 6.0 mb/d; CO/NM tighter) drives fleet moves. NEPA reviews (EA 6–24m; EIS 3–5y) and pipeline bottlenecks (Permian ~1.5 Bcf/d) affect activity; Brent $86/bbl (2024), ±15% swings.
| Factor | Metric | Impact |
|---|---|---|
| Permitting | EA/EIS 6–60m | Delay capex |
| Basins | Permian 6.0 mb/d | Fleet concentration |
| Price | Brent $86; ±15% | Budget volatility |
What is included in the product
Detailed Word Document
Explores how Political, Economic, Social, Technological, Environmental, and Legal forces uniquely affect Patterson-UTI, combining data-driven trends and region/industry context into forward-looking insights for executives, investors, and strategists—ready for reports and decks.
Customizable Excel Spreadsheet
A concise, visually segmented Patterson-UTI PESTLE summary that relieves meeting prep pain by highlighting external risks and market positioning for quick inclusion in presentations, easy sharing across teams, and straightforward use in planning sessions.
Economic factors
Commodity price cyclicality
WTI around $80/bbl and Henry Hub near $3/MMBtu in H1 2025 set E&P cash flows and capex, directly driving drilling and frac activity; higher prices lift dayrates and utilization while lower prices compress margins and idle rigs. Patterson-UTI revenue remains tightly correlated with US rig count (≈700 rigs June 2025); contract mix and multi-year terms provide partial cycle buffering.
Customer consolidation and pricing power
Larger, consolidated E&Ps—the top 10 of which account for roughly half of U.S. oil production in 2024—negotiate lower costs and favor high-spec fleets with performance guarantees, squeezing service pricing but improving volume stability and safety standards. Patterson-UTI must defend margins through efficiency and reliability, using fleet uptime metrics and cost-per-well reductions. Strategic partnerships and multi-year MSAs can smooth activity and secure predictable revenue streams.
Inflation and input costs
Pressure‑pumping costs remain volatile as inputs like hot‑rolled steel (~$700/ton in mid‑2024), diesel (~$4/gal average in 2024), frac sand and specialty chemicals drive margins; these inputs can represent double‑digit percent swings in per‑job costs. Wage inflation (annual oilfield wage gains ~4% in 2024) and scarce skilled crews raise payroll and turnover risk. Patterson‑UTI uses index‑linked contracts and fuel surcharges plus long‑term supply agreements and logistics optimization to pass through spikes and protect margins.
Interest rates and capital availability
- Higher rates: ↑ financing costs, ↓ capex
- Lower rates: enable refinancing, fund rig/e‑frac upgrades
- Balance sheet strength: key to counter‑cyclical spending
- Priority: cash discipline and ROIC
Regional activity mix
Basin-specific economics — Permian breakevens ~$30–40/bbl and Midland–Gulf differentials up to ~$8–10/bbl — drive rig and frac-spread deployment; gas-weighted basins swing with US LNG export capacity ~13.5 Bcf/d (2024) and seasonal demand. Patterson-UTI’s rapid redeployment (days) reduces downtime, while proximity to high-ROIC wells sustains utilization and pricing.
- Basin breakevens: Permian ~$30–40/bbl
- Price differentials: up to $8–10/bbl
- US LNG capacity: ~13.5 Bcf/d (2024)
- Redeploy time: days; supports utilization
Policy swings drive US rig demand; Permian concentration, NEPA delays, Brent $86 ±15%
WTI ~$80/bbl and Henry Hub ~$3/MMBtu in H1 2025 drive E&P cash flows and US rig count (~700 June 2025), directly linking Patterson-UTI revenue to activity; higher prices raise dayrates and utilization, lower prices idle rigs. Higher rates (Fed funds ~5.25–5.50% mid‑2025) raise financing costs, favor firms with strong balance sheets and cash discipline.
| Metric | Value |
|---|---|
| WTI H1 2025 | ~$80/bbl |
| Henry Hub | ~$3/MMBtu |
| US rig count (Jun 2025) | ~700 |
| Fed funds (mid‑2025) | 5.25–5.50% |
| Permian breakeven | $30–40/bbl |
Preview the Actual Deliverable
Patterson-UTI PESTLE Analysis
This Patterson-UTI PESTLE Analysis preview is the exact, fully formatted document you’ll receive after purchase, with no placeholders or teasers. The content, structure, and layout shown here are the final version ready to download and use immediately. What you see is the real product—professionally organized and complete for strategic review and decision-making.











