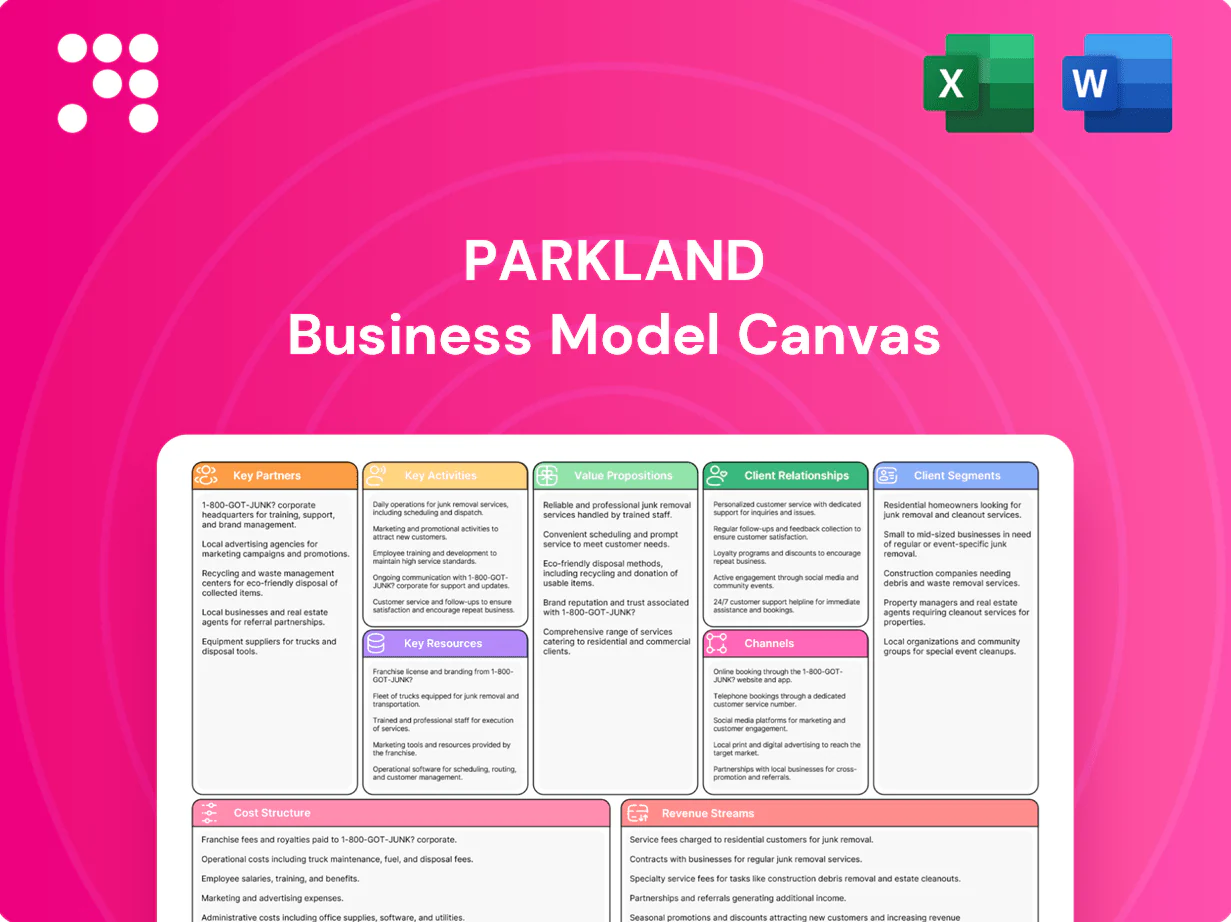
Parkland Business Model Canvas

Unlock the full strategic blueprint behind a major retail energy company's business model
Unlock the full strategic blueprint behind Parkland’s business model with our complete Business Model Canvas—three-sentence preview can’t capture its depth. This downloadable, editable canvas maps value propositions, revenue streams, key partners, and cost structure to show how Parkland scales and sustains margins. Purchase the full file (Word & Excel) for section-by-section insights, benchmarking, and investor-ready analysis.
Partnerships

Upstream refiners and fuel producers
In 2024 Parkland secures gasoline, diesel, jet and LPG through strategic supply agreements with upstream refiners and fuel producers across its operating regions. These partners provide volume certainty and specification compliance, while a mix of long-term contracts and spot purchases balances cost and flexibility. Co-optimization with blending partners enhances margin capture and supply reliability.
Logistics, shipping, and terminal operators
Pipeline, marine, rail and trucking partners enable Parkland to move fuel efficiently across Canada, the US and the Caribbean, supporting its retail and wholesale networks; global oil demand in 2024 averaged about 101 million barrels per day. Third-party terminals supplement owned storage to cover seasonal peaks and provide flexibility. Integrated scheduling reduces demurrage and stockouts while partners follow aligned safety and compliance standards.

Franchisees, dealers, and independent retailers
Franchisees, dealers, and independent retailers extend Parkland's network with lower capital intensity, supporting over 2,800 retail sites globally in 2024. They adopt Parkland brand standards, pricing frameworks, and loyalty programs while Parkland supplies product, training, and merchandising support. Performance-based incentives tie operator payouts to growth and customer-experience metrics.

CPG suppliers and foodservice providers
Convenience offerings depend on deep FMCG and fresh-food partnerships to ensure SKU availability, freshness and margin capture; co-developed planograms and joint promotions consistently lift basket size and visit frequency. Exclusive or preferred SKUs create differentiation and pricing power, while joint data sharing refines assortments by site archetype to boost per-site sales and reduce shrink.
- Co-developed planograms increase basket size
- Exclusive SKUs drive differentiation
- Data-sharing refines assortments by site
Technology, payments, and loyalty partners
Technology, payments, and mobile partners enable seamless transactions across Parkland's retail network, with POS and payments integrations driving faster checkout and reduced friction in 2024. Loyalty coalitions and fintech tie-ins boost rewards value and drive repeat visits, while data and cybersecurity vendors maintain PCI-level protections and threat monitoring. APIs connect pricing, inventory, and customer engagement to enable real-time offers and dynamic pricing.
- 2024: expanded API integrations for pricing and inventory
- POS and mobile payments: reduced checkout times
- Loyalty + fintech: higher redemption and retention
- Data & cybersecurity: PCI-compliant monitoring
Integrated fuel supply, logistics and payments support 2,800+ sites amid 2024 101M bpd demand
Parkland secures fuel via upstream supply contracts and spot purchases, supporting retail and wholesale needs; global oil demand averaged 101 million bpd in 2024. Logistics partners (pipeline, marine, rail, trucking) and third-party terminals ensure delivery and seasonal flexibility for 2,800+ retail sites in 2024. Tech, payments and loyalty partners expanded API integrations and maintain PCI-level protections to drive faster checkout and retention.
| Metric | 2024 |
|---|---|
| Retail sites | 2,800+ |
| Global oil demand | 101 million bpd |
| API integrations | Expanded in 2024 |
What is included in the product
 Detailed Word Document
A comprehensive Business Model Canvas for Parkland that maps customer segments, channels, value propositions, revenue streams and key activities, with SWOT-linked insights and real-world operational detail for investor presentations and strategic planning.

 Customizable Excel Spreadsheet
Condenses Parkland’s business strategy into a single, editable canvas to quickly identify core components and relieve analysis bottlenecks. Perfect for team collaboration, fast deliverables, and comparing scenarios without rebuilding structure from scratch.
Activities

Fuel sourcing and trading
Diversified procurement across refiners, traders and import lanes mitigates price, specification and regional supply risk for Parkland. Blending strategies and hedging programs optimize crack spreads and protect downstream margins. Continuous market intelligence informs purchase timing while active counterparty management preserves supply reliability and credit lines.
Supply chain and terminal operations
Inventory planning, storage, and terminal throughput are coordinated to ensure product availability across Parkland’s network, minimizing stockouts and working capital needs.
Scheduling across marine, rail, pipeline, and road optimizes modal mix to reduce freight and handling costs while improving delivery speed.
Rigorous quality control from rack to nozzle preserves product integrity, and preventive maintenance programs target maximum terminal uptime and safety.

Retail operations and merchandising
Site execution drives conversion and basket growth, with Parkland targeting same-store sales lifts of 3–5% via weekly merchandising and planogram compliance; assortment and pricing are continuously tuned to market demand. Foodservice programs, contributing up to 30% of in-store gross margin in 2024 benchmarks, elevate margin mix. Tight labor scheduling (labor ~15–18% of sales) and shrink controls (industry shrink 1–2%) protect profitability.

Network development and site optimization
Network growth through greenfields, targeted acquisitions and rebranding (about 1,900 retail sites as of 2024) expands market reach while data-led location analytics steer capex, openings and closures to maximize ROI.
Forecourt and store upgrades boost throughput and customer experience, and Parkland pilots EV charging and alternative fuels at select sites where utilization and payback metrics justify deployment.
- Greenfields, acquisitions, rebranding — ~1,900 sites (2024)
- Data-led site analytics — guides capex, closures, ROI
- Forecourt/store upgrades — higher throughput & CX
- EV charging/alt fuels — piloted at select viable sites
Marketing, pricing, and loyalty management
Dynamic pricing across Parkland's network of over 2,000 sites in 2024 aligns prices to local competition and demand, protecting margins during fuel volatility. CRM-driven loyalty offers lift visit frequency and basket spend while omnichannel campaigns tie app, pump screens and in-store messaging. Analytics quantify promo ROI and cut churn through cohort-based retention metrics.
- Dynamic pricing: local vs market
- CRM & loyalty: frequency + spend
- Omnichannel: app, pump, in-store
- Analytics: promo ROI, churn reduction
Hedging and procurement secure margins — foodservice ≈30%, network ≈1.9k
Diversified procurement, blending and hedging protect downstream margins while inventory, modal scheduling and maintenance secure availability and uptime. Site execution, foodservice (≈30% in-store gross margin 2024), dynamic pricing and CRM drive basket growth; labor ~15–18% of sales and shrink 1–2% protect profitability. Network expansion (~1,900 retail sites; ~2,000 total sites in 2024) guided by data analytics optimizes capex and ROI.
| Metric | 2024 |
|---|---|
| Retail sites | ≈1,900 |
| Total sites | ≈2,000 |
| Foodservice gross margin | ≈30% |
| Labor | 15–18% of sales |
| Shrink | 1–2% |
| Same-store sales target | 3–5% |
Full Version Awaits
Business Model Canvas
The document previewed here is the actual Parkland Business Model Canvas—not a mockup—and reflects the exact file you will receive after purchase. When you complete your order, you’ll get this same professional, ready-to-edit document in its full form (Word and Excel). No surprises—what you see is what you’ll download and use.

Original: $10.00
-65%$10.00
$3.50Product Information
Product Information
Shipping & Returns
Shipping & Returns
Description
Unlock the full strategic blueprint behind a major retail energy company's business model
Unlock the full strategic blueprint behind Parkland’s business model with our complete Business Model Canvas—three-sentence preview can’t capture its depth. This downloadable, editable canvas maps value propositions, revenue streams, key partners, and cost structure to show how Parkland scales and sustains margins. Purchase the full file (Word & Excel) for section-by-section insights, benchmarking, and investor-ready analysis.
Partnerships
Upstream refiners and fuel producers
In 2024 Parkland secures gasoline, diesel, jet and LPG through strategic supply agreements with upstream refiners and fuel producers across its operating regions. These partners provide volume certainty and specification compliance, while a mix of long-term contracts and spot purchases balances cost and flexibility. Co-optimization with blending partners enhances margin capture and supply reliability.
Logistics, shipping, and terminal operators
Pipeline, marine, rail and trucking partners enable Parkland to move fuel efficiently across Canada, the US and the Caribbean, supporting its retail and wholesale networks; global oil demand in 2024 averaged about 101 million barrels per day. Third-party terminals supplement owned storage to cover seasonal peaks and provide flexibility. Integrated scheduling reduces demurrage and stockouts while partners follow aligned safety and compliance standards.
Franchisees, dealers, and independent retailers
Franchisees, dealers, and independent retailers extend Parkland's network with lower capital intensity, supporting over 2,800 retail sites globally in 2024. They adopt Parkland brand standards, pricing frameworks, and loyalty programs while Parkland supplies product, training, and merchandising support. Performance-based incentives tie operator payouts to growth and customer-experience metrics.
CPG suppliers and foodservice providers
Convenience offerings depend on deep FMCG and fresh-food partnerships to ensure SKU availability, freshness and margin capture; co-developed planograms and joint promotions consistently lift basket size and visit frequency. Exclusive or preferred SKUs create differentiation and pricing power, while joint data sharing refines assortments by site archetype to boost per-site sales and reduce shrink.
- Co-developed planograms increase basket size
- Exclusive SKUs drive differentiation
- Data-sharing refines assortments by site
Technology, payments, and loyalty partners
Technology, payments, and mobile partners enable seamless transactions across Parkland's retail network, with POS and payments integrations driving faster checkout and reduced friction in 2024. Loyalty coalitions and fintech tie-ins boost rewards value and drive repeat visits, while data and cybersecurity vendors maintain PCI-level protections and threat monitoring. APIs connect pricing, inventory, and customer engagement to enable real-time offers and dynamic pricing.
- 2024: expanded API integrations for pricing and inventory
- POS and mobile payments: reduced checkout times
- Loyalty + fintech: higher redemption and retention
- Data & cybersecurity: PCI-compliant monitoring
Integrated fuel supply, logistics and payments support 2,800+ sites amid 2024 101M bpd demand
Parkland secures fuel via upstream supply contracts and spot purchases, supporting retail and wholesale needs; global oil demand averaged 101 million bpd in 2024. Logistics partners (pipeline, marine, rail, trucking) and third-party terminals ensure delivery and seasonal flexibility for 2,800+ retail sites in 2024. Tech, payments and loyalty partners expanded API integrations and maintain PCI-level protections to drive faster checkout and retention.
| Metric | 2024 |
|---|---|
| Retail sites | 2,800+ |
| Global oil demand | 101 million bpd |
| API integrations | Expanded in 2024 |
What is included in the product
Detailed Word Document
A comprehensive Business Model Canvas for Parkland that maps customer segments, channels, value propositions, revenue streams and key activities, with SWOT-linked insights and real-world operational detail for investor presentations and strategic planning.
Customizable Excel Spreadsheet
Condenses Parkland’s business strategy into a single, editable canvas to quickly identify core components and relieve analysis bottlenecks. Perfect for team collaboration, fast deliverables, and comparing scenarios without rebuilding structure from scratch.
Activities
Fuel sourcing and trading
Diversified procurement across refiners, traders and import lanes mitigates price, specification and regional supply risk for Parkland. Blending strategies and hedging programs optimize crack spreads and protect downstream margins. Continuous market intelligence informs purchase timing while active counterparty management preserves supply reliability and credit lines.
Supply chain and terminal operations
Inventory planning, storage, and terminal throughput are coordinated to ensure product availability across Parkland’s network, minimizing stockouts and working capital needs.
Scheduling across marine, rail, pipeline, and road optimizes modal mix to reduce freight and handling costs while improving delivery speed.
Rigorous quality control from rack to nozzle preserves product integrity, and preventive maintenance programs target maximum terminal uptime and safety.
Retail operations and merchandising
Site execution drives conversion and basket growth, with Parkland targeting same-store sales lifts of 3–5% via weekly merchandising and planogram compliance; assortment and pricing are continuously tuned to market demand. Foodservice programs, contributing up to 30% of in-store gross margin in 2024 benchmarks, elevate margin mix. Tight labor scheduling (labor ~15–18% of sales) and shrink controls (industry shrink 1–2%) protect profitability.
Network development and site optimization
Network growth through greenfields, targeted acquisitions and rebranding (about 1,900 retail sites as of 2024) expands market reach while data-led location analytics steer capex, openings and closures to maximize ROI.
Forecourt and store upgrades boost throughput and customer experience, and Parkland pilots EV charging and alternative fuels at select sites where utilization and payback metrics justify deployment.
- Greenfields, acquisitions, rebranding — ~1,900 sites (2024)
- Data-led site analytics — guides capex, closures, ROI
- Forecourt/store upgrades — higher throughput & CX
- EV charging/alt fuels — piloted at select viable sites
Marketing, pricing, and loyalty management
Dynamic pricing across Parkland's network of over 2,000 sites in 2024 aligns prices to local competition and demand, protecting margins during fuel volatility. CRM-driven loyalty offers lift visit frequency and basket spend while omnichannel campaigns tie app, pump screens and in-store messaging. Analytics quantify promo ROI and cut churn through cohort-based retention metrics.
- Dynamic pricing: local vs market
- CRM & loyalty: frequency + spend
- Omnichannel: app, pump, in-store
- Analytics: promo ROI, churn reduction
Hedging and procurement secure margins — foodservice ≈30%, network ≈1.9k
Diversified procurement, blending and hedging protect downstream margins while inventory, modal scheduling and maintenance secure availability and uptime. Site execution, foodservice (≈30% in-store gross margin 2024), dynamic pricing and CRM drive basket growth; labor ~15–18% of sales and shrink 1–2% protect profitability. Network expansion (~1,900 retail sites; ~2,000 total sites in 2024) guided by data analytics optimizes capex and ROI.
| Metric | 2024 |
|---|---|
| Retail sites | ≈1,900 |
| Total sites | ≈2,000 |
| Foodservice gross margin | ≈30% |
| Labor | 15–18% of sales |
| Shrink | 1–2% |
| Same-store sales target | 3–5% |
Full Version Awaits
Business Model Canvas
The document previewed here is the actual Parkland Business Model Canvas—not a mockup—and reflects the exact file you will receive after purchase. When you complete your order, you’ll get this same professional, ready-to-edit document in its full form (Word and Excel). No surprises—what you see is what you’ll download and use.