Owens & Minor Business Model Canvas

Business Model Canvas: Strategic playbook for medical supply distribution
Unlock Owens & Minor’s strategic playbook with our Business Model Canvas: a concise breakdown of its value propositions, customer segments, partnerships, revenue streams and cost drivers. Perfect for investors, consultants and founders who need actionable insights. Download the full, editable Canvas in Word and Excel to benchmark, plan, or pitch with confidence.
Partnerships

Medical device and supply manufacturers
Strategic sourcing relationships with medical device and supply manufacturers secure product breadth, competitive pricing, and prioritized allocations during demand surges, supporting Owens & Minor’s scale in 2024 revenue of $8.9 billion.
Joint demand planning and vendor-managed inventory align production with provider needs, reducing stockouts and smoothing supply across the network.
Co-marketing and clinician education drive adoption and formulary compliance, while quality and regulatory collaboration ensures compliant, traceable products.
Healthcare providers and IDNs
Partnerships with hospitals, IDNs, and health systems enable Owens & Minor to implement integrated supply chain models that align procurement, inventory and clinical workflows. Contracting and GPO alignment drive standardization and measurable cost savings across product categories. On-site logistics programs deepen operational ties and provide real-time performance visibility for inventory turns and delivery metrics. Secure data-sharing with partners improves forecasting, fill rates and service levels.

Group Purchasing Organizations (GPOs)
GPO partnerships give Owens & Minor scaled access to membership networks covering over 90% of U.S. hospitals and purchasing power exceeding $100 billion annually, broadening contracted volume and market reach. Compliance programs and onboarding drive adherence, capturing predictable volume that supports margin certainty and working-capital planning. Joint value initiatives focus on SKU rationalization and total cost reduction, while collaborative analytics—tying contract performance to utilization—validate projected savings and measured outcomes against Owens & Minor’s fiscal 2024 net sales of approximately $9.6 billion.

Logistics, transportation, and 3PL/4PL partners
Carriers and 3PL/4PL partners extend Owens & Minor reach, capacity, and delivery speed, supporting national hospital networks and last-mile needs; the global 3PL market was about $1.5 trillion in 2024. Multi-modal options (air, rail, road) hedge disruption risks and optimize cost-to-serve, while technology integration enables real-time tracking and OTIF targets above 95%. Seasonal and surge flex capacity (up to ~30% demand spikes) supports pandemic and flu-season resilience.
- reach: national + last-mile
- market: 3PL ~$1.5T (2024)
- OTIF: target >95%
- surge: ~30% flex capacity
Technology and data analytics providers
ERP, WMS and analytics partners drive Owens & Minor demand planning, inventory optimization and EDI integration, while AI/ML models boost forecasting accuracy by 20–40% and enable SKU rationalization; IoT/RFID deliver manufacturer-to-point-of-care visibility, cutting stockouts up to 30%, and cybersecurity/compliance partners guard PHI amid average healthcare breach costs near $11M in 2024.
- ERP/WMS/EDI: real‑time inventory & order flow
- AI/ML: +20–40% forecast accuracy; SKU rationalization
- IoT/RFID: end‑to‑end visibility; −30% stockouts
- Cybersecurity: PHI protection; mitigates ~$11M breach risk
GPO reach >90%, $100B purchasing; OTIF >95%, forecasts +20–40%
Strategic sourcing and GPO ties secured scale in 2024 (revenue $8.9B; net sales ~$9.6B) and access to >90% of U.S. hospitals with >$100B purchasing power. 3PL/carrier partnerships leverage a $1.5T global market to hit OTIF targets >95% and provide ~30% surge capacity. ERP/WMS and AI/ML partners drive +20–40% forecast accuracy; IoT/RFID cuts stockouts ~30% while cybersecurity defends against ~$11M avg breach costs (2024).
| Metric | 2024 Value |
|---|---|
| Revenue | $8.9B |
| Net sales | $9.6B |
| GPO hospital coverage | >90% |
| Purchasing power | >$100B |
| 3PL market | $1.5T |
| OTIF target | >95% |
| Forecast lift (AI/ML) | +20–40% |
| Stockout reduction (IoT) | ~30% |
| Avg breach cost | ~$11M |
What is included in the product
 Detailed Word Document
A comprehensive Business Model Canvas for Owens & Minor that maps customer segments, value propositions, channels, key partners, activities, resources, cost structure and revenue streams across the company’s real-world supply‑chain and distribution strategy. Ideal for presentations and investor discussions, it includes block-level competitive advantages plus linked SWOT insights to support analysis and decision-making.

 Customizable Excel Spreadsheet
High-level view of Owens & Minor’s business model with editable cells, clarifying its healthcare supply-chain value proposition, distribution partnerships, and revenue streams for quick strategic decisions.
Activities

Medical-surgical distribution operations
Owens & Minor’s medical-surgical distribution operations integrate procurement, warehousing and last-mile delivery to sustain high service levels, leveraging cross-docking and pick-optimization to boost throughput. Cold chain and sterile handling comply with FDA and USP standards. KPIs target industry benchmarks: fill rates ~98%, OTIF ~95%, shrink control below 0.5%.
Inventory and supply chain management
VMI, PAR-level management and consignment programs reduce stockouts and carrying costs, cutting on-hand inventory by 20–30% and improving fill rates. Demand forecasting synchronizes upstream supply with clinical usage, driving service levels above 98%. Backorder mitigation and substitution protect care continuity, while data-driven dashboards guide replenishment and reduce emergency buys.

Manufacturing and owned-brand products
Owens & Minor leverages private-label and owned brands to complement distributed portfolios, driving cost-effective SKUs that boost margins and customer value. Rigorous quality assurance in 2024 maintained regulatory and clinical acceptance across acute and ambulatory channels. Category management aligns owned SKUs with provider formularies to improve fill-rates and procurement efficiency. These activities support networked manufacturing and supply resilience.

Clinical and operational consulting
Clinical and operational consulting at Owens & Minor drives workflow mapping and SKU standardization that can lower total cost of care by 10–25%, while OR, cath lab and procedural-area optimization improves case readiness and throughput by 8–18%. Waste reduction and enhanced charge capture recover 2–6% of revenue, and structured change management raises sustained adoption and compliance rates above 75%.
- SKU standardization: 10–25% cost reduction
- OR/cath optimization: 8–18% increased throughput
- Waste & charge capture: 2–6% revenue recovery
- Change management: >75% adoption
Digital enablement and EDI/eCommerce
- eProcurement/EDI/punchout: streamlined ordering
- Real-time inventory, substitutions, tracking: reduced friction
- Analytics: CFO and supply chain decision support
- APIs: seamless provider system connectivity
Integrated supply network achieves ~98% fill rate, ~95% OTIF and 20–30% inventory cut
Owens & Minor operates integrated procurement, cross-dock warehousing and last-mile delivery with fill rates ~98% and OTIF ~95% in 2024. VMI, PAR and consignment lowered on-hand inventory 20–30% and cut emergency buys via demand forecasting. Clinical consulting and SKU standardization delivered 10–25% TCO reductions, 8–18% throughput gains and 2–6% revenue recovery with >75% adoption.
| Metric | 2024 Value |
|---|---|
| Fill rate | ~98% |
| OTIF | ~95% |
| Inventory reduction | 20–30% |
| TCO reduction | 10–25% |
| Throughput | 8–18% |
| Revenue recovery | 2–6% |
| Adoption | >75% |
Full Document Unlocks After Purchase
Business Model Canvas
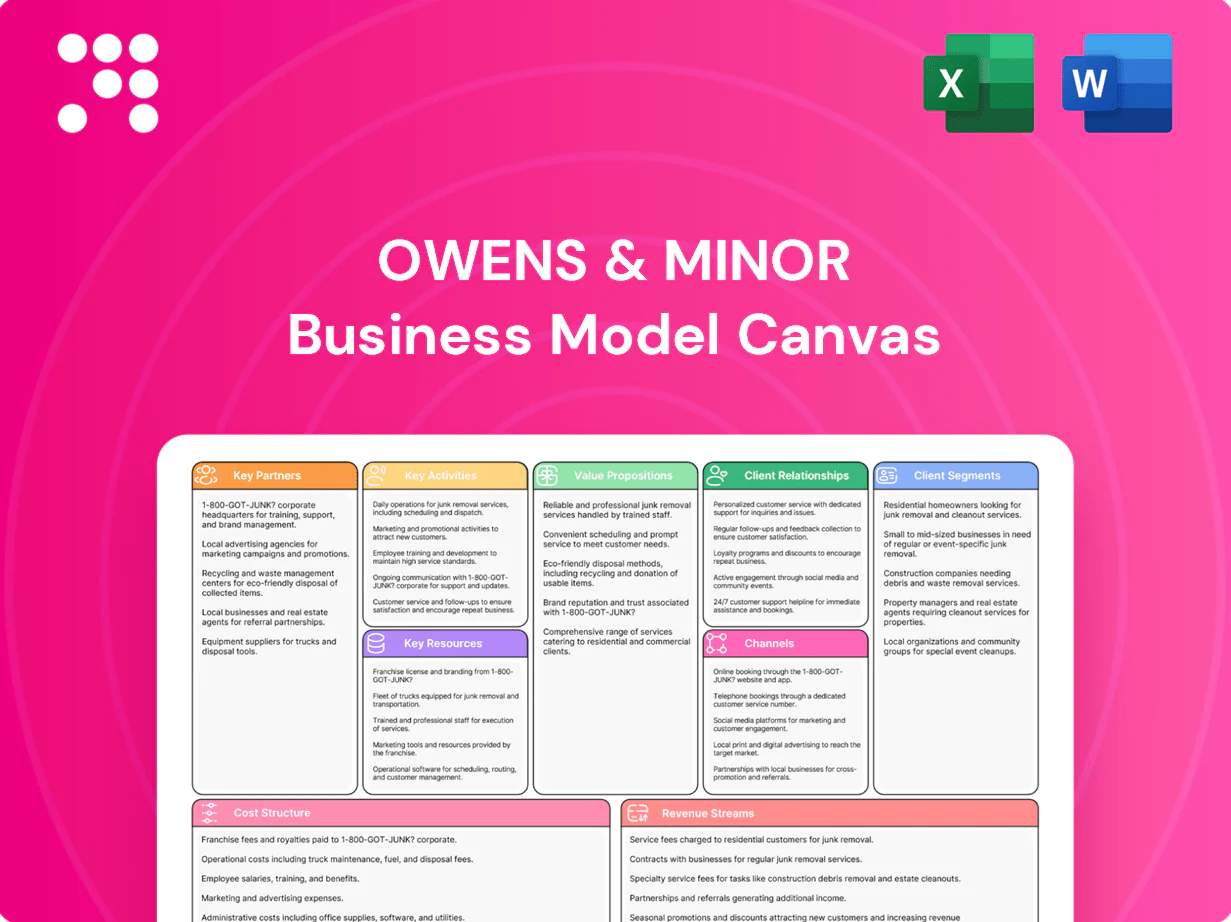
The Owens & Minor Business Model Canvas you’re previewing is the actual deliverable, not a mockup—what you see is a direct excerpt from the file you’ll receive. Upon purchase you’ll get this exact document in full, ready to edit and present in Word and Excel formats. No surprises, just the complete, professionally formatted canvas shown here.

Product Information
Product Information
Shipping & Returns
Shipping & Returns
Description
Business Model Canvas: Strategic playbook for medical supply distribution
Unlock Owens & Minor’s strategic playbook with our Business Model Canvas: a concise breakdown of its value propositions, customer segments, partnerships, revenue streams and cost drivers. Perfect for investors, consultants and founders who need actionable insights. Download the full, editable Canvas in Word and Excel to benchmark, plan, or pitch with confidence.
Partnerships
Medical device and supply manufacturers
Strategic sourcing relationships with medical device and supply manufacturers secure product breadth, competitive pricing, and prioritized allocations during demand surges, supporting Owens & Minor’s scale in 2024 revenue of $8.9 billion.
Joint demand planning and vendor-managed inventory align production with provider needs, reducing stockouts and smoothing supply across the network.
Co-marketing and clinician education drive adoption and formulary compliance, while quality and regulatory collaboration ensures compliant, traceable products.
Healthcare providers and IDNs
Partnerships with hospitals, IDNs, and health systems enable Owens & Minor to implement integrated supply chain models that align procurement, inventory and clinical workflows. Contracting and GPO alignment drive standardization and measurable cost savings across product categories. On-site logistics programs deepen operational ties and provide real-time performance visibility for inventory turns and delivery metrics. Secure data-sharing with partners improves forecasting, fill rates and service levels.
Group Purchasing Organizations (GPOs)
GPO partnerships give Owens & Minor scaled access to membership networks covering over 90% of U.S. hospitals and purchasing power exceeding $100 billion annually, broadening contracted volume and market reach. Compliance programs and onboarding drive adherence, capturing predictable volume that supports margin certainty and working-capital planning. Joint value initiatives focus on SKU rationalization and total cost reduction, while collaborative analytics—tying contract performance to utilization—validate projected savings and measured outcomes against Owens & Minor’s fiscal 2024 net sales of approximately $9.6 billion.
Logistics, transportation, and 3PL/4PL partners
Carriers and 3PL/4PL partners extend Owens & Minor reach, capacity, and delivery speed, supporting national hospital networks and last-mile needs; the global 3PL market was about $1.5 trillion in 2024. Multi-modal options (air, rail, road) hedge disruption risks and optimize cost-to-serve, while technology integration enables real-time tracking and OTIF targets above 95%. Seasonal and surge flex capacity (up to ~30% demand spikes) supports pandemic and flu-season resilience.
- reach: national + last-mile
- market: 3PL ~$1.5T (2024)
- OTIF: target >95%
- surge: ~30% flex capacity
Technology and data analytics providers
ERP, WMS and analytics partners drive Owens & Minor demand planning, inventory optimization and EDI integration, while AI/ML models boost forecasting accuracy by 20–40% and enable SKU rationalization; IoT/RFID deliver manufacturer-to-point-of-care visibility, cutting stockouts up to 30%, and cybersecurity/compliance partners guard PHI amid average healthcare breach costs near $11M in 2024.
- ERP/WMS/EDI: real‑time inventory & order flow
- AI/ML: +20–40% forecast accuracy; SKU rationalization
- IoT/RFID: end‑to‑end visibility; −30% stockouts
- Cybersecurity: PHI protection; mitigates ~$11M breach risk
GPO reach >90%, $100B purchasing; OTIF >95%, forecasts +20–40%
Strategic sourcing and GPO ties secured scale in 2024 (revenue $8.9B; net sales ~$9.6B) and access to >90% of U.S. hospitals with >$100B purchasing power. 3PL/carrier partnerships leverage a $1.5T global market to hit OTIF targets >95% and provide ~30% surge capacity. ERP/WMS and AI/ML partners drive +20–40% forecast accuracy; IoT/RFID cuts stockouts ~30% while cybersecurity defends against ~$11M avg breach costs (2024).
| Metric | 2024 Value |
|---|---|
| Revenue | $8.9B |
| Net sales | $9.6B |
| GPO hospital coverage | >90% |
| Purchasing power | >$100B |
| 3PL market | $1.5T |
| OTIF target | >95% |
| Forecast lift (AI/ML) | +20–40% |
| Stockout reduction (IoT) | ~30% |
| Avg breach cost | ~$11M |
What is included in the product
Detailed Word Document
A comprehensive Business Model Canvas for Owens & Minor that maps customer segments, value propositions, channels, key partners, activities, resources, cost structure and revenue streams across the company’s real-world supply‑chain and distribution strategy. Ideal for presentations and investor discussions, it includes block-level competitive advantages plus linked SWOT insights to support analysis and decision-making.
Customizable Excel Spreadsheet
High-level view of Owens & Minor’s business model with editable cells, clarifying its healthcare supply-chain value proposition, distribution partnerships, and revenue streams for quick strategic decisions.
Activities
Medical-surgical distribution operations
Owens & Minor’s medical-surgical distribution operations integrate procurement, warehousing and last-mile delivery to sustain high service levels, leveraging cross-docking and pick-optimization to boost throughput. Cold chain and sterile handling comply with FDA and USP standards. KPIs target industry benchmarks: fill rates ~98%, OTIF ~95%, shrink control below 0.5%.
Inventory and supply chain management
VMI, PAR-level management and consignment programs reduce stockouts and carrying costs, cutting on-hand inventory by 20–30% and improving fill rates. Demand forecasting synchronizes upstream supply with clinical usage, driving service levels above 98%. Backorder mitigation and substitution protect care continuity, while data-driven dashboards guide replenishment and reduce emergency buys.
Manufacturing and owned-brand products
Owens & Minor leverages private-label and owned brands to complement distributed portfolios, driving cost-effective SKUs that boost margins and customer value. Rigorous quality assurance in 2024 maintained regulatory and clinical acceptance across acute and ambulatory channels. Category management aligns owned SKUs with provider formularies to improve fill-rates and procurement efficiency. These activities support networked manufacturing and supply resilience.
Clinical and operational consulting
Clinical and operational consulting at Owens & Minor drives workflow mapping and SKU standardization that can lower total cost of care by 10–25%, while OR, cath lab and procedural-area optimization improves case readiness and throughput by 8–18%. Waste reduction and enhanced charge capture recover 2–6% of revenue, and structured change management raises sustained adoption and compliance rates above 75%.
- SKU standardization: 10–25% cost reduction
- OR/cath optimization: 8–18% increased throughput
- Waste & charge capture: 2–6% revenue recovery
- Change management: >75% adoption
Digital enablement and EDI/eCommerce
- eProcurement/EDI/punchout: streamlined ordering
- Real-time inventory, substitutions, tracking: reduced friction
- Analytics: CFO and supply chain decision support
- APIs: seamless provider system connectivity
Integrated supply network achieves ~98% fill rate, ~95% OTIF and 20–30% inventory cut
Owens & Minor operates integrated procurement, cross-dock warehousing and last-mile delivery with fill rates ~98% and OTIF ~95% in 2024. VMI, PAR and consignment lowered on-hand inventory 20–30% and cut emergency buys via demand forecasting. Clinical consulting and SKU standardization delivered 10–25% TCO reductions, 8–18% throughput gains and 2–6% revenue recovery with >75% adoption.
| Metric | 2024 Value |
|---|---|
| Fill rate | ~98% |
| OTIF | ~95% |
| Inventory reduction | 20–30% |
| TCO reduction | 10–25% |
| Throughput | 8–18% |
| Revenue recovery | 2–6% |
| Adoption | >75% |
Full Document Unlocks After Purchase
Business Model Canvas
The Owens & Minor Business Model Canvas you’re previewing is the actual deliverable, not a mockup—what you see is a direct excerpt from the file you’ll receive. Upon purchase you’ll get this exact document in full, ready to edit and present in Word and Excel formats. No surprises, just the complete, professionally formatted canvas shown here.