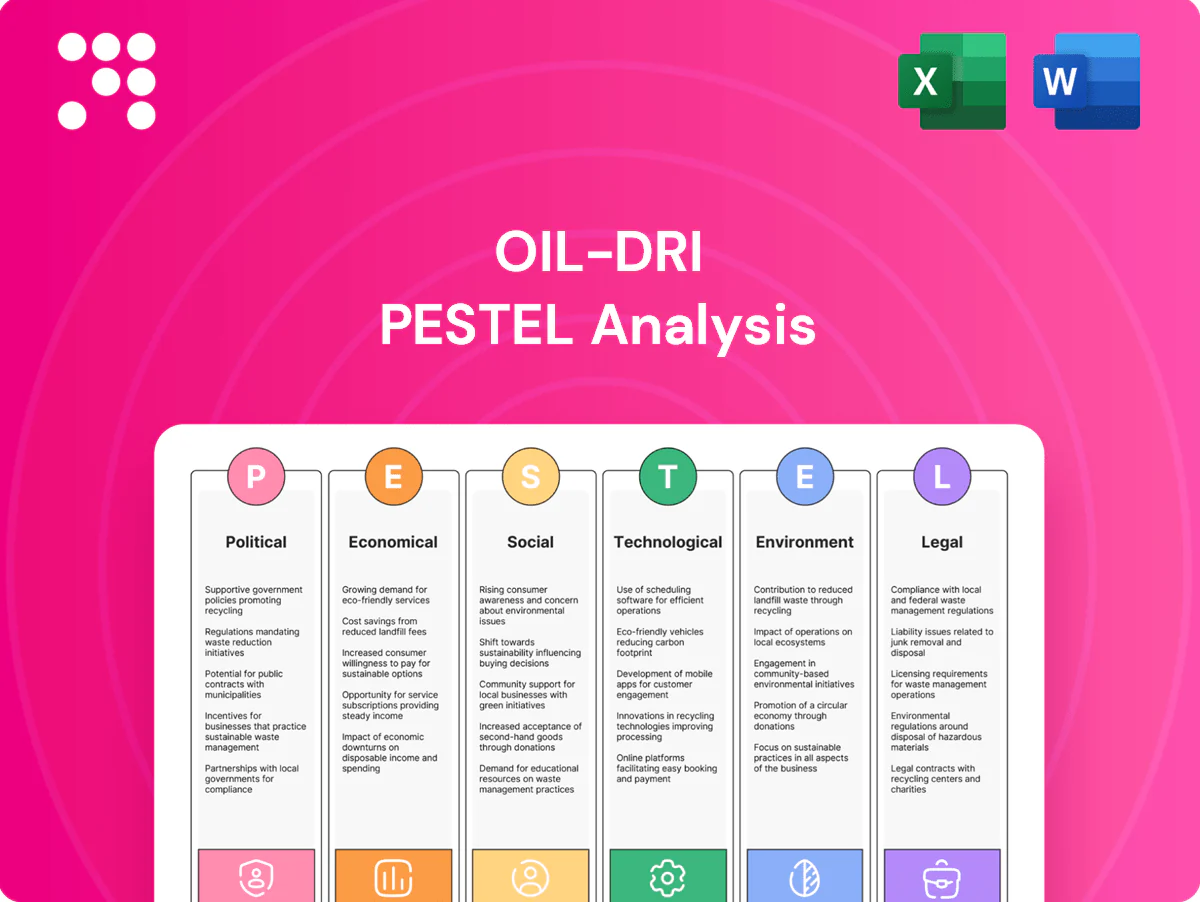
Oil-Dri PESTLE Analysis

Your Shortcut to Market Insight Starts Here
Gain a strategic edge with our concise PESTLE Analysis of Oil‑Dri—revealing how political, economic, social, technological, legal, and environmental forces shape its prospects. Ideal for investors and strategists, this ready-to-use report saves time and informs decisions. Purchase the full analysis for the complete, actionable breakdown.
Political factors

Mining permits & land use
Permitting timelines and land-use zoning—often spanning 6–36 months for state and local approvals—directly determine access to attapulgite and montmorillonite deposits and can delay production starts.
Local and state politics can tighten or expedite approvals and reclamation obligations, while strong community relations and political goodwill reduce opposition to expansions.
Shifts in public policy may add mitigation or monitoring requirements that increase operating and capital costs per ton.
Trade policy & tariffs
Import/export rules on minerals, machinery and packaging change costs and sourcing flexibility for Oil-Dri, particularly where US Section 232 tariffs of 25% on steel and 10% on aluminum raise input costs. Tariffs or anti-dumping duties, sometimes exceeding 50%, can swing competitiveness versus foreign substitutes. Trade pacts like USMCA and CPTPP affect market access for animal health and purification lines. Geopolitical tensions in 2024 have heightened logistical delays and volatile freight rates, increasing lead times.

Agriculture policy support
Subsidies and programs such as the EU Common Agricultural Policy (CAP) with its €387 billion 2021–27 budget and US feed-safety regulations drive demand for toxin binders and flow agents by raising feed-quality expectations; FAO estimates up to 25% of cereals face mycotoxin contamination, boosting sorbent adoption. Policy shifts toward biosecurity and stricter feed standards increase product usage, while budget cuts to subsidy programs can reduce adoption incentives.

Infrastructure & energy policy
- rail investment: 66B
- roads/bridges: 110B
- electricity (industrial, 2024): ~7.5¢/kWh
- gas (2024): ~3–4 USD/MMBtu
- policy impact: grid rules & carbon mandates → capex for equipment
International standards diplomacy
Government alignment with Codex (189 member countries) directly affects national acceptance of animal additives, influencing market access and regulatory approval timelines. Political participation in standards bodies shapes testing and certification burdens, shifting costs between producers and regulators. Harmonization can open WTO (164 members) markets for purification aids, while divergence raises compliance complexity and cost.
- Codex members: 189 — affects acceptance
- WTO members: 164 — market access implications
- Harmonization — lowers entry barriers, expands markets
- Divergence — increases testing, certification costs
Permitting, tariffs and infrastructure shape costs, lead times and market access
Permitting timelines (6–36 months) and local politics determine mine access, reclamation costs and project start dates.
Tariffs (US Section 232: +25% steel, +10% aluminum), anti-dumping duties (>50% in cases) and 2024 geopolitical freight volatility raise input and lead-time risk.
Subsidies/CAP (€387B 2021–27), FAO mycotoxin prevalence (~25%), infrastructure (IIJA: rail 66B, roads 110B) and standards bodies (Codex 189, WTO 164) shape demand, costs and market access.
| Factor | Key data |
|---|---|
| Permitting | 6–36 months |
| Tariffs | steel+25%, alum+10% |
| CAP | €387B (2021–27) |
| Infra | rail 66B / roads 110B |
| Energy (2024) | ~7.5¢/kWh; $3–4/MMBtu |
| Standards | Codex 189; WTO 164 |
What is included in the product
 Detailed Word Document
Explores how macro-environmental factors uniquely affect Oil-Dri across Political, Economic, Social, Technological, Environmental and Legal dimensions, with data-backed trends and forward-looking insights to identify risks and opportunities; designed for executives, consultants and investors and ready for inclusion in plans and reports.

 Customizable Excel Spreadsheet
A concise, visually segmented PESTLE summary for Oil-Dri that removes research friction and can be dropped into presentations or strategy sessions. Ideal for quick team alignment, note-taking for regional or product tweaks, and supporting discussions on external risks and market positioning.
Economic factors

Input cost volatility
Diesel (~$3.5–4.0/gal US, 2024–H1 2025), industrial electricity (~10–14¢/kWh) and natural gas (Henry Hub ~$2.5–3.5/MMBtu) plus rising packaging costs directly compress margins, with energy often representing 15–30% of mining/processing COGS. Energy-intensive extraction amplifies inflation exposure, so forward contracting and fuel/commodity hedges are critical to stabilize COGS. Prolonged supply tightness has forced peers to lift prices or shift to higher-margin blends, sometimes raising realized prices 5–10%.
Freight & logistics cycles
Bulk mineral transport for Oil-Dri hinges on rail and truck rates and capacity; American Trucking Associations estimated a US driver shortfall of about 80,000 in 2024, which, alongside terminal congestion, lengthens lead times and lifts unit costs. Proximity to customers reduces transit variability and improves service. McKinsey analyses indicate network optimization can trim logistics costs by roughly 5–15%, creating sustainable advantages.

Pet care demand resilience
Cat litter is defensive, helping revenue stability as the global cat litter market was valued at about USD 4.0 billion in 2023 with a ~3.8% CAGR forecast to 2030, while US pet spending hit USD 136.8 billion in 2023; premiumization (clumping, odor-control, natural litters) can expand margins but recessions tend to slow trade-up while volumes hold; rising e-commerce and big-box share influence pricing power and promo intensity.

Agricultural and commodity cycles
Livestock herd sizes and feed prices drive demand for Oil‑Dri animal health sorbents; US cattle inventory around 88.8 million head in 2024 (USDA) and elevated corn feed costs pressured producer margins, lifting demand for feed additives and binders.
Droughts and grain shocks in 2022–24 increased mycotoxin incidence, raising sorbent usage during crop stress periods, while down‑cycles see producers cut discretionary spend on higher‑margin products.
Shifting global crop patterns—diversified production across Americas, Asia and Africa—smooth regional demand volatility for sorbents.
- US cattle inventory 2024: ~88.8M head
- Higher 2024 feed costs boosted sorbent demand
- Droughts/grain shocks raised mycotoxin risk
- Down‑cycles reduce discretionary producer spend
- Global crop diversification spreads demand
FX and global market exposure
Foreign currency swings affect translated revenues and input costs for Oil-Dri, with the US dollar index averaging about 103 in 2024, pressuring margins when revenues are earned in weaker currencies. A strong dollar can reduce competitiveness of purification aids and feed additives in export markets, while localizing production or pricing helps offset FX headwinds. Diversified end-markets across animal feed, water purification and industrial uses dampen regional economic shocks.
- FX exposure: US dollar avg ~103 (2024)
- Mitigation: local production/pricing
- Resilience: diversified end-markets reduce regional risk
Permitting, tariffs and infrastructure shape costs, lead times and market access
Energy (diesel ~$3.5–4/gal, Henry Hub ~$2.5–3.5/MMBtu, industrial power 10–14¢/kWh) and packaging lift COGS 15–30%, hedging/forward buys vital. Logistics constraints (US truck driver shortfall ~80k in 2024) raise transit costs; network optimization can cut 5–15%. Demand stable from cat litter (USD 4.0B 2023) and livestock (US cattle ~88.8M 2024); droughts/mycotoxins spike sorbent use.
| Metric | Value |
|---|---|
| Diesel (2024–H1 2025) | $3.5–4.0/gal |
| US cattle (2024) | ~88.8M |
| Cat litter market (2023) | $4.0B |
| US dollar avg (2024) | ~103 |
Full Version Awaits
Oil-Dri PESTLE Analysis
The preview shown here is the exact document you’ll receive after purchase—fully formatted and ready to use. This Oil‑Dri PESTLE Analysis covers political, economic, social, technological, legal and environmental factors with structured insights and actionable implications. No placeholders or teasers; you’ll download this final, professionally formatted file immediately after payment.

Product Information
Product Information
Shipping & Returns
Shipping & Returns
Description
Your Shortcut to Market Insight Starts Here
Gain a strategic edge with our concise PESTLE Analysis of Oil‑Dri—revealing how political, economic, social, technological, legal, and environmental forces shape its prospects. Ideal for investors and strategists, this ready-to-use report saves time and informs decisions. Purchase the full analysis for the complete, actionable breakdown.
Political factors
Mining permits & land use
Permitting timelines and land-use zoning—often spanning 6–36 months for state and local approvals—directly determine access to attapulgite and montmorillonite deposits and can delay production starts.
Local and state politics can tighten or expedite approvals and reclamation obligations, while strong community relations and political goodwill reduce opposition to expansions.
Shifts in public policy may add mitigation or monitoring requirements that increase operating and capital costs per ton.
Trade policy & tariffs
Import/export rules on minerals, machinery and packaging change costs and sourcing flexibility for Oil-Dri, particularly where US Section 232 tariffs of 25% on steel and 10% on aluminum raise input costs. Tariffs or anti-dumping duties, sometimes exceeding 50%, can swing competitiveness versus foreign substitutes. Trade pacts like USMCA and CPTPP affect market access for animal health and purification lines. Geopolitical tensions in 2024 have heightened logistical delays and volatile freight rates, increasing lead times.
Agriculture policy support
Subsidies and programs such as the EU Common Agricultural Policy (CAP) with its €387 billion 2021–27 budget and US feed-safety regulations drive demand for toxin binders and flow agents by raising feed-quality expectations; FAO estimates up to 25% of cereals face mycotoxin contamination, boosting sorbent adoption. Policy shifts toward biosecurity and stricter feed standards increase product usage, while budget cuts to subsidy programs can reduce adoption incentives.
Infrastructure & energy policy
- rail investment: 66B
- roads/bridges: 110B
- electricity (industrial, 2024): ~7.5¢/kWh
- gas (2024): ~3–4 USD/MMBtu
- policy impact: grid rules & carbon mandates → capex for equipment
International standards diplomacy
Government alignment with Codex (189 member countries) directly affects national acceptance of animal additives, influencing market access and regulatory approval timelines. Political participation in standards bodies shapes testing and certification burdens, shifting costs between producers and regulators. Harmonization can open WTO (164 members) markets for purification aids, while divergence raises compliance complexity and cost.
- Codex members: 189 — affects acceptance
- WTO members: 164 — market access implications
- Harmonization — lowers entry barriers, expands markets
- Divergence — increases testing, certification costs
Permitting, tariffs and infrastructure shape costs, lead times and market access
Permitting timelines (6–36 months) and local politics determine mine access, reclamation costs and project start dates.
Tariffs (US Section 232: +25% steel, +10% aluminum), anti-dumping duties (>50% in cases) and 2024 geopolitical freight volatility raise input and lead-time risk.
Subsidies/CAP (€387B 2021–27), FAO mycotoxin prevalence (~25%), infrastructure (IIJA: rail 66B, roads 110B) and standards bodies (Codex 189, WTO 164) shape demand, costs and market access.
| Factor | Key data |
|---|---|
| Permitting | 6–36 months |
| Tariffs | steel+25%, alum+10% |
| CAP | €387B (2021–27) |
| Infra | rail 66B / roads 110B |
| Energy (2024) | ~7.5¢/kWh; $3–4/MMBtu |
| Standards | Codex 189; WTO 164 |
What is included in the product
Detailed Word Document
Explores how macro-environmental factors uniquely affect Oil-Dri across Political, Economic, Social, Technological, Environmental and Legal dimensions, with data-backed trends and forward-looking insights to identify risks and opportunities; designed for executives, consultants and investors and ready for inclusion in plans and reports.
Customizable Excel Spreadsheet
A concise, visually segmented PESTLE summary for Oil-Dri that removes research friction and can be dropped into presentations or strategy sessions. Ideal for quick team alignment, note-taking for regional or product tweaks, and supporting discussions on external risks and market positioning.
Economic factors
Input cost volatility
Diesel (~$3.5–4.0/gal US, 2024–H1 2025), industrial electricity (~10–14¢/kWh) and natural gas (Henry Hub ~$2.5–3.5/MMBtu) plus rising packaging costs directly compress margins, with energy often representing 15–30% of mining/processing COGS. Energy-intensive extraction amplifies inflation exposure, so forward contracting and fuel/commodity hedges are critical to stabilize COGS. Prolonged supply tightness has forced peers to lift prices or shift to higher-margin blends, sometimes raising realized prices 5–10%.
Freight & logistics cycles
Bulk mineral transport for Oil-Dri hinges on rail and truck rates and capacity; American Trucking Associations estimated a US driver shortfall of about 80,000 in 2024, which, alongside terminal congestion, lengthens lead times and lifts unit costs. Proximity to customers reduces transit variability and improves service. McKinsey analyses indicate network optimization can trim logistics costs by roughly 5–15%, creating sustainable advantages.
Pet care demand resilience
Cat litter is defensive, helping revenue stability as the global cat litter market was valued at about USD 4.0 billion in 2023 with a ~3.8% CAGR forecast to 2030, while US pet spending hit USD 136.8 billion in 2023; premiumization (clumping, odor-control, natural litters) can expand margins but recessions tend to slow trade-up while volumes hold; rising e-commerce and big-box share influence pricing power and promo intensity.
Agricultural and commodity cycles
Livestock herd sizes and feed prices drive demand for Oil‑Dri animal health sorbents; US cattle inventory around 88.8 million head in 2024 (USDA) and elevated corn feed costs pressured producer margins, lifting demand for feed additives and binders.
Droughts and grain shocks in 2022–24 increased mycotoxin incidence, raising sorbent usage during crop stress periods, while down‑cycles see producers cut discretionary spend on higher‑margin products.
Shifting global crop patterns—diversified production across Americas, Asia and Africa—smooth regional demand volatility for sorbents.
- US cattle inventory 2024: ~88.8M head
- Higher 2024 feed costs boosted sorbent demand
- Droughts/grain shocks raised mycotoxin risk
- Down‑cycles reduce discretionary producer spend
- Global crop diversification spreads demand
FX and global market exposure
Foreign currency swings affect translated revenues and input costs for Oil-Dri, with the US dollar index averaging about 103 in 2024, pressuring margins when revenues are earned in weaker currencies. A strong dollar can reduce competitiveness of purification aids and feed additives in export markets, while localizing production or pricing helps offset FX headwinds. Diversified end-markets across animal feed, water purification and industrial uses dampen regional economic shocks.
- FX exposure: US dollar avg ~103 (2024)
- Mitigation: local production/pricing
- Resilience: diversified end-markets reduce regional risk
Permitting, tariffs and infrastructure shape costs, lead times and market access
Energy (diesel ~$3.5–4/gal, Henry Hub ~$2.5–3.5/MMBtu, industrial power 10–14¢/kWh) and packaging lift COGS 15–30%, hedging/forward buys vital. Logistics constraints (US truck driver shortfall ~80k in 2024) raise transit costs; network optimization can cut 5–15%. Demand stable from cat litter (USD 4.0B 2023) and livestock (US cattle ~88.8M 2024); droughts/mycotoxins spike sorbent use.
| Metric | Value |
|---|---|
| Diesel (2024–H1 2025) | $3.5–4.0/gal |
| US cattle (2024) | ~88.8M |
| Cat litter market (2023) | $4.0B |
| US dollar avg (2024) | ~103 |
Full Version Awaits
Oil-Dri PESTLE Analysis
The preview shown here is the exact document you’ll receive after purchase—fully formatted and ready to use. This Oil‑Dri PESTLE Analysis covers political, economic, social, technological, legal and environmental factors with structured insights and actionable implications. No placeholders or teasers; you’ll download this final, professionally formatted file immediately after payment.











